. 2015 Dec 22;132(25):2372-84.
doi: 10.1161/CIRCULATIONAHA.115.018131. Epub 2015 Oct 8.

Direct Evidence for Microdomain-Specific Localization and Remodeling of Functional L-Type Calcium Channels in Rat and Human Atrial Myocytes

Affiliations

Direct Evidence for Microdomain-Specific Localization and Remodeling of Functional L-Type Calcium Channels in Rat and Human Atrial Myocytes

Alexey V Glukhov et al. Circulation. .

Abstract

Background: Distinct subpopulations of L-type calcium channels (LTCCs) with different functional properties exist in cardiomyocytes. Disruption of cellular structure may affect LTCC in a microdomain-specific manner and contribute to the pathophysiology of cardiac diseases, especially in cells lacking organized transverse tubules (T-tubules) such as atrial myocytes (AMs).

Methods and results: Isolated rat and human AMs were characterized by scanning ion conductance, confocal, and electron microscopy. Half of AMs possessed T-tubules and structured topography, proportional to cell width. A bigger proportion of myocytes in the left atrium had organized T-tubules and topography than in the right atrium. Super-resolution scanning patch clamp showed that LTCCs distribute equally in T-tubules and crest areas of the sarcolemma, whereas, in ventricular myocytes, LTCCs primarily cluster in T-tubules. Rat, but not human, T-tubule LTCCs had open probability similar to crest LTCCs, but exhibited ≈ 40% greater current. Optical mapping of Ca(2+) transients revealed that rat AMs presented ≈ 3-fold as many spontaneous Ca(2+) release events as ventricular myocytes. Occurrence of crest LTCCs and spontaneous Ca(2+) transients were eliminated by either a caveolae-targeted LTCC antagonist or disrupting caveolae with methyl-β-cyclodextrin, with an associated ≈ 30% whole-cell ICa,L reduction. Heart failure (16 weeks post-myocardial infarction) in rats resulted in a T-tubule degradation (by ≈ 40%) and significant elevation of spontaneous Ca(2+) release events. Although heart failure did not affect LTCC occurrence, it led to ≈ 25% decrease in T-tubule LTCC amplitude.

Conclusions: We provide the first direct evidence for the existence of 2 distinct subpopulations of functional LTCCs in rat and human AMs, with their biophysical properties modulated in heart failure in a microdomain-specific manner.

Keywords: T-tubules; calcium channels; heart atria; heart failure; myocytes, cardiac; scanning ion conductance microscopy.


Figures

Figure 1.
Figure 1.
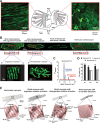
Spatial heterogeneity of the atrial T-tubular system: in situ and in vitro measurements. A, In situ confocal imaging of T-tubules (TTs) in intact rat atrial preparation stained with wheat germ agglutinin. In the middle, the schematic outlines of the isolated rat atrial preparation showing the main anatomic features. The enlarged images from the endocardium of the right (RAA) and left (LAA) atrial appendages demonstrate typical atrial myocytes with organized TTs (white arrows), disorganized TTs (red arrows), or mixture of both types. AVN indicates atrioventricular node; CT, crista terminalis; IAS, interatrial septum; IVC, inferior vena cava; SAN, sinoatrial node; SVC, superior vena cava; and TRAB, trabeculae. B, Di-8-ANEPPS membrane staining showing a TT network in ventricular myocytes and in atrial myocytes with organized, disorganized, and absent TTs. Below the confocal images, enlarged areas of 40×5 µm are shown that were binarized and used in TT density and regularity measurements. For structured atrial myocytes, 3D reconstructions of the TTs obtained from confocal stack images are shown (see also online-only Data Supplement Movies I and II). C, Representative distribution of power of the predominant frequency retrieved from 2D Fourier transformation of confocal images (B insets). D, Average width of cells with different TT structure isolated from left ventricle (LV, n=45 cells from 3 rats) and LA and RA (n=29/2, 26/35, and 22/38 cells from 6 rats for organized, disorganized, and absent TTs for cells from LA/RA, respectively). * P<0.001 versus atrial myocytes; ** P<0.001 versus other cell groups within the atrium by unpaired Student t test. E, Correlation between surface structure and cell size. Optical images and topography scans (zoomed areas) of a ventricular myocyte and atrial myocytes with various degrees of organization of surface structures are shown. TTs, crests, and nonstructured areas are indicated by arrows. Note that the cell shown in the right-most panel does not possess any organized surface structures.
Figure 2.
Figure 2.
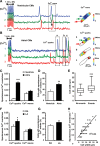
Spontaneous Ca2+ release events. Spontaneous Ca2+ activity was measured in isolated ventricular (A) and atrial (B) myocytes. Cells were electrically paced at 4 Hz for 1 minute to enhance sarcoplasmic reticulum Ca2+ loading. Ca2+ sparks and waves were quantified during a 8- to 16-s rest period after cessation of pacing. On the left, optical traces indicating changes in [Ca2+]i during measurements are shown from 3 different areas (1–3) from the selected cardiomyocytes. On the right, Ca2+ transient propagation color contour maps are presented for a spontaneous Ca2+ wave recorded from the ventricular myocyte (A) and 3 Ca2+ sparks obtained from the atrial myocyte (B). Near the maps, the corresponding color time scales for propagation time are shown. C, Average frequency of spontaneous Ca2+ sparks and waves measured in ventricular (n=126 from 8 rats) and atrial (n=357 from 9 rats) myocytes. *** P<0.001 by Mann-Whitney test. D, Percentage of atrial (n=126) and ventricular myocytes (n=357) with spontaneous Ca2+ release events. ** P<0.01 by unpaired Student t test. E, Average cell width for atrial myocytes with and without spontaneous Ca2+ release events (n=117 cells from 7 rats). *** P<0.001 by Mann-Whitney test. F, Average frequency of spontaneous Ca2+ sparks and waves measured separately in right (RA, n=156 from 4 rats) and left (LA, n=201 from 4 rats) atrial myocytes. * P<0.05 by Mann-Whitney test. G, Percentage of RA (n=156) and LA myocytes (n=201) with spontaneous Ca2+ events. H, Correlation between cell width and frequency of spontaneous Ca2+ events for atrial myocytes together with a correlation coefficient. CM indicates cardiomyocyte; LA, left atrium; and RA, right atrium.
Figure 3.
Figure 3.
Single LTCC activity recorded from T-tubule, crest, and nonstructured areas in rat atrial myocytes. Typical 10×10 µm topographical scans of cardiomyocytes showing locations where a pipette was placed after clipping and a giga-seal was obtained over a T-tubule (A), a crest (B), and a nonstructured flat area (C) of the sarcolemma. On the right, corresponding representative current traces of single LTCC activity at the given voltages using a pipette of 25 Ω resistance. D, Percentage of occurrence of the LTCC current from the T-tubules (TT; 78 successful patches), crests (63 successful patches), and nonstructured areas (NStr; 26 successful patches). E, Current-voltage relationship of single LTCC activity recorded from the T-tubules, crest, and NStr areas . n=6 to 16 channels for T-tubules, n=8 to 12 channels for crests, and n=5 channels for nonstructured areas. * P<0.05 and ** P<0.01 versus C-LTCCs by analysis of variance. F, Top, LTCC openings evoked by voltage jumps to –26.7mV and using 90 mM Ba2+ as the charge carrier. The dashed lines indicate substates and fully open levels. Bottom, The LTCC amplitude histogram of single-channel openings to different substate levels measured as shown on the panel above. C-LTCC indicates crest L-type calcium channel; and LTCC, L-type calcium channel.
Figure 4.
Figure 4.
Microdomain distribution of functional LTCCs in human right atrial myocytes. A, Left, Typical 10×10 µm topographical scan of the human right atrial myocyte isolated from a patient with sinus rhythm. T-tubule and crest areas are indicated by arrows. Z-grooves are shown by the dotted lines when present. Right, Representative current traces of single LTCC activity recorded at –6.7mV using a pipette of 25 Ω resistance. B, Percentage of occurrence of functional LTCC current from the T-tubules and crest areas of human atrial myocytes. Above the columns is the number of patches with the active current out of the total number of patches for each location. C, Current-voltage relationship of single LTCC current activity recorded from the T-tubules and from the crests. LTCC indicates L-type calcium channel.
Figure 5.
Figure 5.
Cholesterol depletion removes caveolae, abolishes the occurrence of extratubular LTCCs decreasing whole-cell ICa,L and suppressing spontaneous Ca2+ sparks. A, Ultrastructural changes in rat atrial myocytes after methyl-β-cyclodextrin incubation. Electron micrographs of representative control (Left) and 10 mM methyl-β-cyclodextrin (MβCD)–treated rat atrial (Right) myocytes are shown. Caveolae are marked by arrowheads. Right, Caveolae per micrometer in the cellular membrane before and after MβCD treatment (n=16 for control and n=10 for MβCD group, n=3 rats per group). *** P<0.001 by unpaired Student t test. B, Typical 10×10 µm topographical scans of control (Left) and MβCD-treated (Right) rat atrial myocytes. Below are single-channel recordings obtained from the T-tubule (TT) and the crest of sarcolemma (Crest). C, Percentage of LTCC current occurrence in the T-tubules and crests. ** P<0.01 for Crest MβCD LTCC versus other groups, by Fisher exact test. D, Whole-cell ICa,L density (n=9 for control and n=12 for MβCD groups) before and after MβCD treatment. * P<0.05 by unpaired Student t test. E, Along with changes in ICa,L, MβCD significantly suppressed the occurrence of spontaneous Ca2+ sparks. *** P<0.001 by Mann-Whitney test. The proportion of cells with spontaneous Ca2+ events (F) and Ca2+ spark amplitude (G) were also decreased following the treatment. Ca2+ spark amplitude was calculated as a percentage from the amplitude of electrically induced Ca2+ transient measured during 4-Hz pacing. n=82 cells from 12 rats and n=99 cells from 7 rats for control and MβCD groups, respectively. * P<0.05, ** P<0.01 by unpaired Student t test. LTCC indicates L-type calcium channel.
Figure 6.
Figure 6.
A caveolae-targeted LTCC antagonist decreases the occurrence of single LTCC current on the crest area of the sarcolemma and reduces spontaneous Ca2+ events. Percentage of occurrence (A) and current-voltage relationship (B) of the single LTCC current from the crest area of uninfected (48 hours of culturing without a virus; 12 channels in 32 patches), Rem1-265-infected (8 channels in 21 patches), and Rem1-265-Cav-infected (48 hours after infection; 5 channels in 28 patches) atrial myocytes. C, Average data for Ca2+ sparks and waves measured in uninfected (n=67 cells from 5 rats), Rem1-265-infected (n=50 cells from 4 rats), and Rem1-265-Cav–infected (n=35 cells from 5 rats) atrial myocytes measured 48 hours after infection. *** P<0.001 versus uninfected, # P<0.05 versus Rem1-256 by Kruskal-Wallis test. D, Percentage of atrial myocytes with spontaneous Ca2+ events in 3 groups of cells studied. * P<0.05 versus both groups by Kruskal-Wallis test. LTCC indicates L-type calcium channel.
Figure 7.
Figure 7.
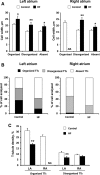
Structural remodeling of atrial myocytes in heart failure (HF) rats. Average cell width (A), composition (in percent) of populations of myocytes (B), and T-tubule system density (C) in cells with different T-tubule (TT) structure isolated from control and HF left (LA) and right (RA) atrial, n=77/75 control cells for LA/RA (29/26/22 and 2/35/38 cells for organized/disorganized/absent TT in LA and RA, respectively) versus n=65/43 HF cells for LA/RA (9/19/37 and 0/10/33 cells for organized/disorganized/absent TT in LA and RA, respectively) for LA/RA control versus HF rats). * P<0.05, ** P<0.01, *** P<0.001 versus control by unpaired Student t test or Mann-Whitney test as appropriate.
Figure 8.
Figure 8.
Microdomain-specific remodeling of single LTCCs in HF. A, Spontaneous Ca2+ activity measured in isolated control (Left) and HF (Right) rat atrial myocytes. Optical traces indicating changes in [Ca2+]i are shown from 3 different areas (1–3) from the selected cardiomyocytes. Below the traces, Ca2+ transient propagation color contour maps are presented for selected events. Near the maps, the corresponding color time scales for propagation time are shown. B, Average frequency of spontaneous Ca2+ sparks and waves measured in control (n=116 cells from 5 rats) and HF (n=119 cells from 4 rats) atrial myocytes. *** P<0.001 by Mann-Whitney test. C, Maximal amplitude of sparks (in percent from a paced Ca2+ transient, %CaTA). ** P<0.01 by Mann-Whitney test. D, Maximal length activated by a spark (ΔLmax, pixels). *** P<0.001 by unpaired Student t test. E, Current-voltage relationship of single LTCC activity recorded from the T-tubules (TT) and crest in control and HF rat atrial myocytes. F, LTCC amplitude histogram of single-channel openings to different substate levels calculated for T-LTCC in control and HF. CaTA indicates calcium transient amplitude; LTCC, L-type calcium channel; and T-LTCC, T-tubule L-type calcium channel.

References

    1. Bers DM. Calcium cycling and signaling in cardiac myocytes. Annu Rev Physiol. 2008;70:23–49. doi: 10.1146/annurev.physiol.70.113006.100455. - PubMed
    1. Bhargava A, Lin X, Novak P, Mehta K, Korchev Y, Delmar M, Gorelik J. Super-resolution scanning patch clamp reveals clustering of functional ion channels in adult ventricular myocyte. Circ Res. 2013;112:1112–1120. doi: 10.1161/CIRCRESAHA.111.300445. - PMC - PubMed
    1. Brette F, Komukai K, Orchard CH. Validation of formamide as a detubulation agent in isolated rat cardiac cells. Am J Physiol Heart Circ Physiol. 2002;283:H1720–H1728. doi: 10.1152/ajpheart.00347.2002. - PubMed
    1. Kirk MM, Izu LT, Chen-Izu Y, McCulle SL, Wier WG, Balke CW, Shorofsky SR. Role of the transverse-axial tubule system in generating calcium sparks and calcium transients in rat atrial myocytes. J Physiol. 2003;547(Pt 2):441–451. doi: 10.1113/jphysiol.2002.034355. - PMC - PubMed
    1. Richards MA, Clarke JD, Saravanan P, Voigt N, Dobrev D, Eisner DA, Trafford AW, Dibb KM. Transverse tubules are a common feature in large mammalian atrial myocytes including human. Am J Physiol Heart Circ Physiol. 2011;301:H1996–H2005. doi: 10.1152/ajpheart.00284.2011. - PMC - PubMed

Publication types

Substances