. 2015 Nov 15;142(22):3954-63.
doi: 10.1242/dev.124172. Epub 2015 Oct 8.

Suppression of epithelial differentiation by Foxi3 is essential for molar crown patterning

Affiliations

Suppression of epithelial differentiation by Foxi3 is essential for molar crown patterning

Maria Jussila et al. Development. .

Abstract

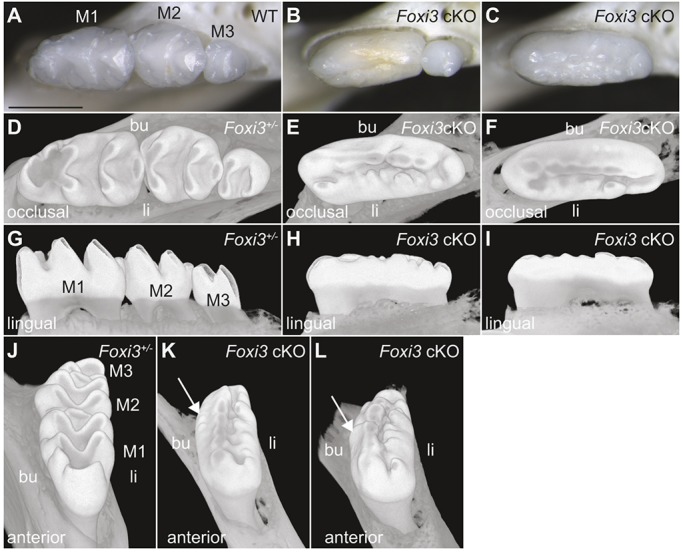
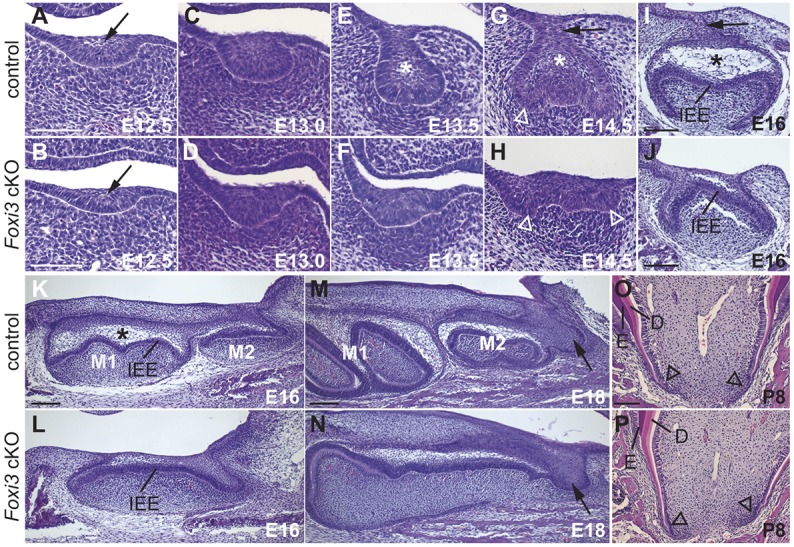
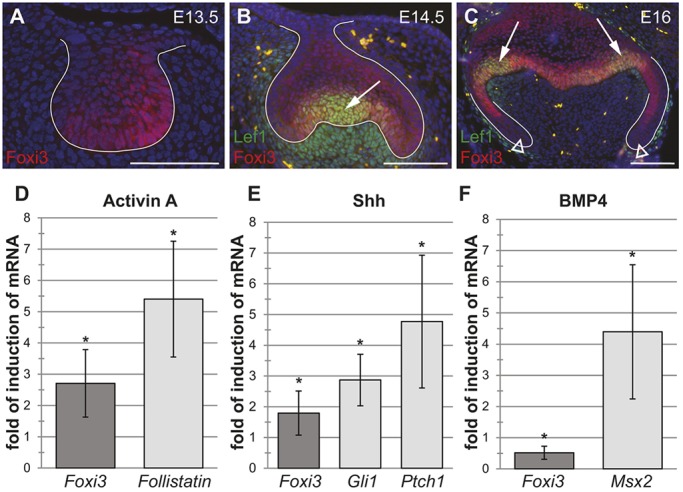
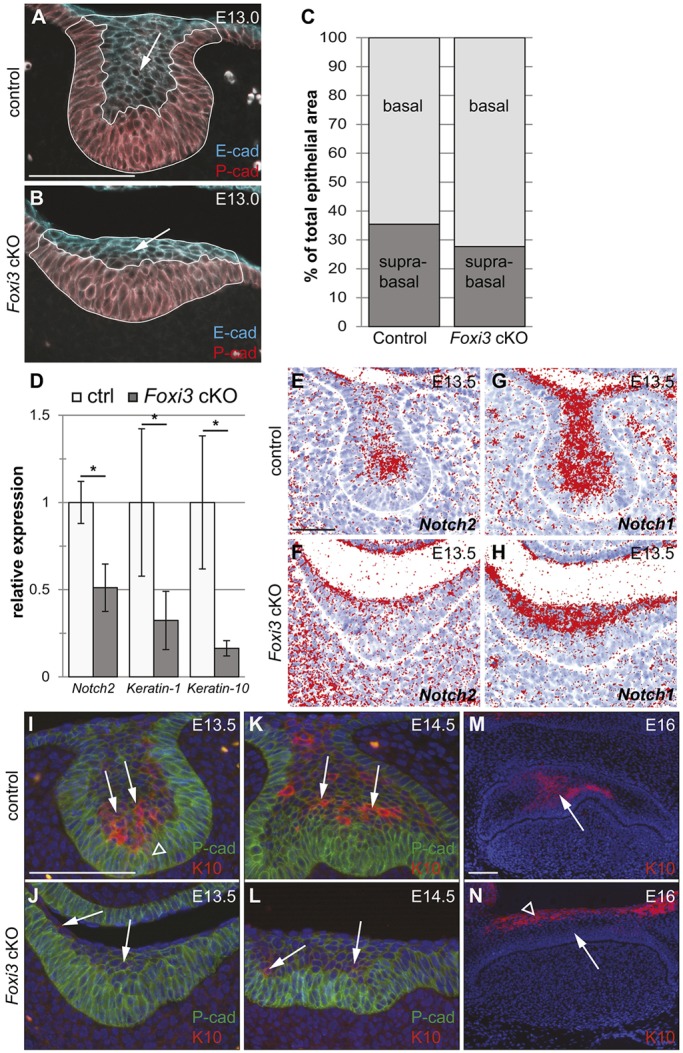
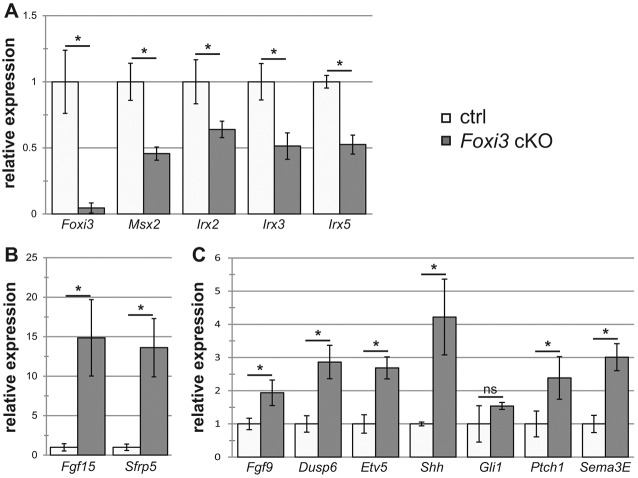
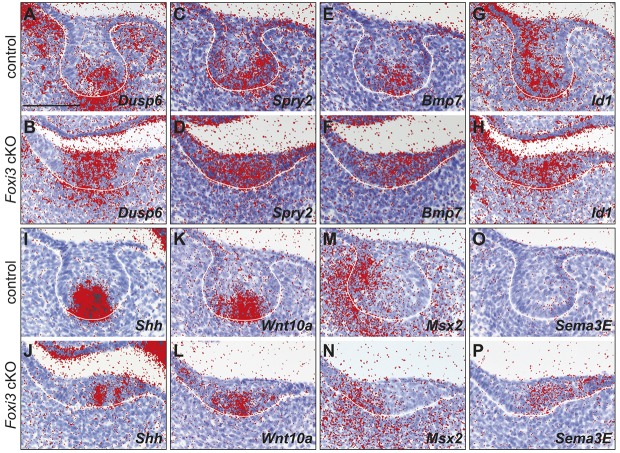
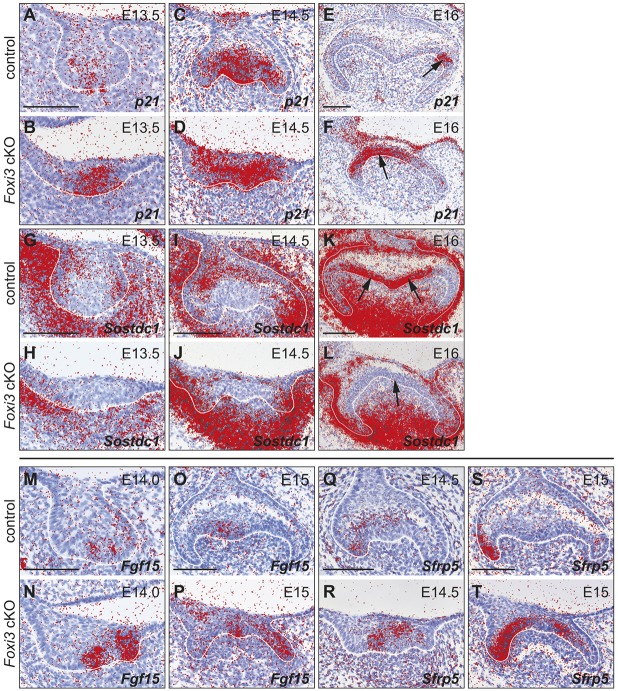
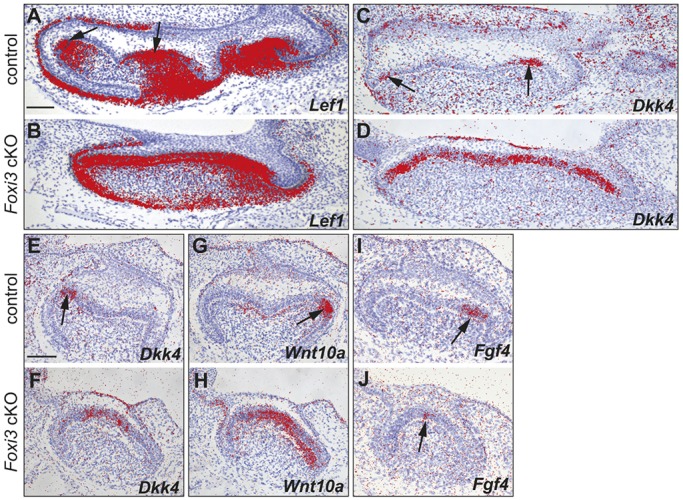
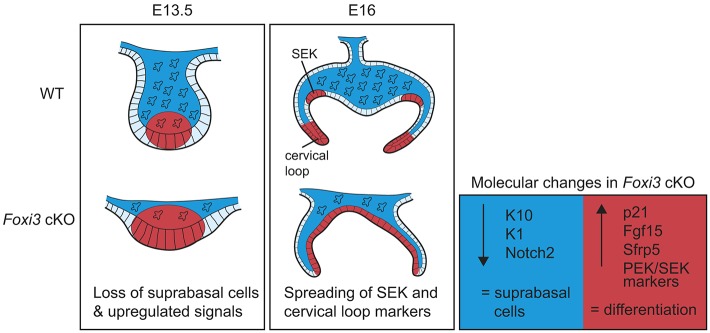
Epithelial morphogenesis generates the shape of the tooth crown. This is driven by patterned differentiation of cells into enamel knots, root-forming cervical loops and enamel-forming ameloblasts. Enamel knots are signaling centers that define the positions of cusp tips in a tooth by instructing the adjacent epithelium to fold and proliferate. Here, we show that the forkhead-box transcription factor Foxi3 inhibits formation of enamel knots and cervical loops and thus the differentiation of dental epithelium in mice. Conditional deletion of Foxi3 (Foxi3 cKO) led to fusion of molars with abnormally patterned shallow cusps. Foxi3 was expressed in the epithelium, and its expression was reduced in the enamel knots and cervical loops and in ameloblasts. Bmp4, a known inducer of enamel knots and dental epithelial differentiation, downregulated Foxi3 in wild-type teeth. Using genome-wide gene expression profiling, we showed that in Foxi3 cKO there was an early upregulation of differentiation markers, such as p21, Fgf15 and Sfrp5. Different signaling pathway components that are normally restricted to the enamel knots were expanded in the epithelium, and Sostdc1, a marker of the intercuspal epithelium, was missing. These findings indicated that the activator-inhibitor balance regulating cusp patterning was disrupted in Foxi3 cKO. In addition, early molar bud morphogenesis and, in particular, formation of the suprabasal epithelial cell layer were impaired. We identified keratin 10 as a marker of suprabasal epithelial cells in teeth. Our results suggest that Foxi3 maintains dental epithelial cells in an undifferentiated state and thereby regulates multiple stages of tooth morphogenesis.

Keywords: Epithelium; Foxi3; Morphogenesis; Multituberculata; Signaling center; Tooth development.


Conflict of interest statement

Competing interests

The authors declare no competing or financial interests.

Figures

Fig. 1.
Fig. 1.
Phenotype of K14cre43;Foxi3−/floxed (Foxi3 cKO) mice. (A-C) Molars of 5-week-old WT and two Foxi3 cKO mice showing fused molars in Foxi3 cKO. (D-L) Micro-CT scans showing occlusal (D-F), lingual (G-I) and anterior (J-L) views of right molars of one Foxi3−/floxed and two Foxi3 cKO mice. Arrows point to an additional cusp-like row in Foxi3 cKO teeth. The remaining micro-CT-scanned samples are shown in Fig. S1. Scale bar: 1 mm (for A-C). bu, buccal; cKO, conditional knockout; CT, computed tomography; li, lingual; M1, first molar; M2, second molar; M3, third molar; WT, wild type.
Fig. 2.
Fig. 2.
Embryonic phenotype of Foxi3 cKO mice. (A-J) Frontal sections of control and Foxi3 cKO molars from E12.5 to E16. Arrows in A,B point to the suprabasal cells; asterisks in E,G,I mark the stellate reticulum; white open arrowheads in G,H point to the cervical loops; and arrows in G,I point to the dental cord. (K-N) Sagittal sections of control and Foxi3 cKO molars at E16 and E18. Asterisk in K marks the stellate reticulum; arrows in M,N point to M3. (O,P) Frontal sections of developing roots of control and Foxi3 cKO molars at P8. Arrowheads point to the tips of roots. D, dentin; E, enamel; IEE, inner enamel epithelium; M1, first molar; M2, second molar; M3, third molar. Lingual is on the right in A-J. Scale bars: 100 μm.
Fig. 3.
Fig. 3.
Foxi3 protein expression and upstream regulation. (A-C) Localization of Foxi3 protein together with Lef1 (B,C) in molar epithelium at E13.5, E14.5 and E16. Arrows point to enamel knots; white open arrowheads point to cervical loops. White line indicates the border between epithelium and mesenchyme. Scale bars: 100 μm. (D-F) Relative expression of Foxi3 analyzed by qRT-PCR (mean±s.d.) in E13.5 wild-type molars in the presence or absence of a growth factor. Known target genes of each pathway were used as the positive controls. (D) Activin A induced Foxi3 2.7-fold and follistatin 5.4-fold (P=0.012, Wilcoxon signed-rank test), n=8. (E) Shh induced Foxi3 1.8-fold, Gli 2.9-fold and Ptch1 4.8-fold (P=0.028, Wilcoxon signed-rank test), n=6. (F) Bmp4 induced Foxi3 0.5-fold and Msx2 4.4-fold (P=0.018, Wilcoxon signed-rank test), n=7. *P<0.05.
Fig. 4.
Fig. 4.
Analysis of the suprabasal epithelium in Foxi3 cKO molars. (A,B) E- and P-cadherin double staining of control and Foxi3 cKO molars at E13.0. Arrows point to the suprabasal epithelium. White line indicates areas of suprabasal and basal epithelium measured in C. (C) Relative ratios of suprabasal and basal epithelial areas of the total epithelium in wild-type and Foxi3 cKO molars at E13.0 (n=3). Total areas are shown in Fig. S4. (D) Relative expression of downregulated Notch2 (0.51-fold), Krt1 (0.32-fold) and Krt10 (0.16-fold) analyzed by qRT-PCR (mean±s.d.) in control and Foxi3 cKO molars at E13.5 (P=0.029, Mann–Whitney U-test, n=4). (E,F) Expression of Notch2 in E13.5 control and Foxi3 cKO molars. (G,H) Expression of Notch1 in E13.5 control and Foxi3 cKO molars. (I-N) Keratin 10 and P-cadherin (in I-L) staining of control and Foxi3 cKO molars at E13.5, E14.5 and E16. Arrows point to K10-positive cells, open white arrowheads to K10-positive cells in the oral epithelium. White line in E-H indicates the border between epithelium and mesenchyme. Lingual is on the right. Scale bars: 100 μm.
Fig. 5.
Fig. 5.
Validation of differentially expressed genes from the microarray by qRT-PCR. (A) Relative expression of Foxi3 (0.05-fold), Msx2 (0.5-fold), Irx2 (0.6-fold), Irx3 (0.5-fold) and Irx5 (0.5-fold) analyzed by qRT-PCR (mean±s.d.) in wild-type and Foxi3 cKO molars at E13.5 (mean±s.d., P=0.029, Mann–Whitney U-test, n=4). (B) Relative expression of Fgf15 (14.9-fold) and Sfrp5 (13.6-fold) in wild-type and Foxi3 cKO molars at E13.5 (mean±s.d., P=0.029, Mann–Whitney U-test, n=4). (C) Relative expression of Fgf9 (1.9-fold), Dusp6 (2.9-fold), Etv5 (2.7-fold), Shh (4.2-fold), Gli1 (1.5-fold), Ptch1 (2.4-fold) and Sema3e (3.0-fold) in wild-type and Foxi3 cKO molars at E13.5 (mean±s.d., Gli1 P=0.34, others P=0.029, Mann–Whitney U-test, n=4). ns, not statistically significant; *P<0.05.
Fig. 6.
Fig. 6.
Validation of differentially expressed genes from the microarray by in situ hybridization. (A-P) Expression of microarray hit genes in E13.5 control and Foxi3 cKO molars. White line indicates the border between epithelium and mesenchyme. Lingual is on the right. Scale bar: 100 μm.
Fig. 7.
Fig. 7.
Expression of p21, Sostdc1, Fgf15 and Sfrp5 in Foxi3 cKO. (A-F) Expression of p21 in E13.5, E14.5 and E16 control and Foxi3 cKO molars. Arrows in E,F point to p21 expression in IEE. (G-L) Expression of Sostdc1 in E13.5, E14.5 and E16 control and Foxi3 cKO molars. Arrows in K,L point to IEE where Sostdc1 is expressed in control molars. (M-P) Expression of Fgf15 in E14.0 and E15 control and Foxi3 cKO molars. (Q-T) Expression of Sfrp5 in E14.5 and E15 control and Foxi3 cKO molars. IEE, inner enamel epithelium. White line indicates the border between epithelium and mesenchyme. Lingual is on the right. Scale bars: 100 μm.
Fig. 8.
Fig. 8.
Expression of SEK markers in Foxi3 cKO. (A-D) Expression of Lef1 and Dkk4 in sagittal sections of E16 control and Foxi3 cKO molars. (E-J) Expression of Dkk4, Wnt10a and Fgf4 in frontal sections of E16 control and Foxi3 cKO molars. Arrows point to focal expression in SEK signaling centers. Lingual is on the right. Scale bars: 100 μm.
Fig. 9.
Fig. 9.
Foxi3 inhibits epithelial differentiation and promotes suprabasal cell formation. Schematic illustration of the key findings in this article. At the bud stage at E13.5, loss of Foxi3 leads to a lack of suprabasal cells and upregulation of signaling pathway components in the epithelium. At E16, markers of SEKs and cervical loops become expanded. The key genes identified were Krt10 (K10), Krt1 (K1) and Notch2 in suprabasal cells and p21, Fgf15 and Sfrp5, in addition to several PEK and SEK markers, as indicators of differentiation. WT, wild type.

Similar articles

Cited by

References

    1. Åberg T., Wozney J. and Thesleff I. (1997). Expression patterns of bone morphogenetic proteins (Bmps) in the developing mouse tooth suggest roles in morphogenesis and cell differentiation. Dev. Dyn. 210, 383-396. 10.1002/(SICI)1097-0177(199712)210:4<383::AID-AJA3>3.0.CO;2-C - DOI - PubMed
    1. Ahtiainen L., Lefebvre S., Lindfors P. H., Renvoisé E., Shirokova V., Vartiainen M. K., Thesleff I. and Mikkola M. L. (2014). Directional cell migration, but not proliferation, drives hair placode morphogenesis. Dev. Cell. 28, 588-602. 10.1016/j.devcel.2014.02.003 - DOI - PubMed
    1. Andl T., Ahn K., Kairo A., Chu E. Y., Wine-Lee L., Reddy S. T., Croft N. J., Cebra-Thomas J. A., Metzger D., Chambon P. et al. (2004). Epithelial Bmpr1a regulates differentiation and proliferation in postnatal hair follicles and is essential for tooth development. Development. 131, 2257-2268. 10.1242/dev.01125 - DOI - PubMed
    1. Bei M. (2009). Molecular genetics of tooth development. Curr. Opin. Genet. Dev. 19, 504-510. 10.1016/j.gde.2009.09.002 - DOI - PMC - PubMed
    1. Benayoun B. A., Caburet S. and Veitia R. A. (2011). Forkhead transcription factors: key players in health and disease. Trends Genet. 27, 224-232. 10.1016/j.tig.2011.03.003 - DOI - PubMed

Publication types

MeSH terms

Substances

Associated data