. 2015 Oct 8;163(2):354-66.
doi: 10.1016/j.cell.2015.08.030.

Microbiota-Dependent Sequelae of Acute Infection Compromise Tissue-Specific Immunity

Affiliations

Microbiota-Dependent Sequelae of Acute Infection Compromise Tissue-Specific Immunity

Denise Morais da Fonseca et al. Cell. .

Abstract

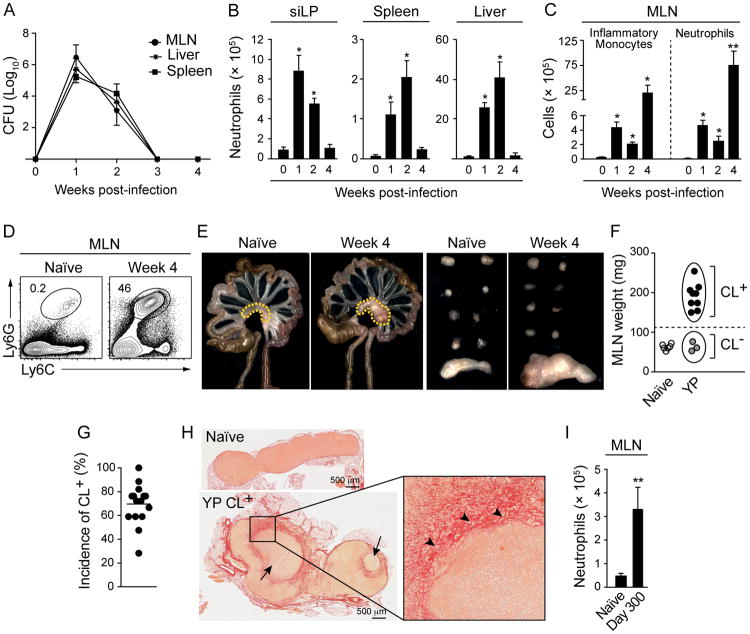
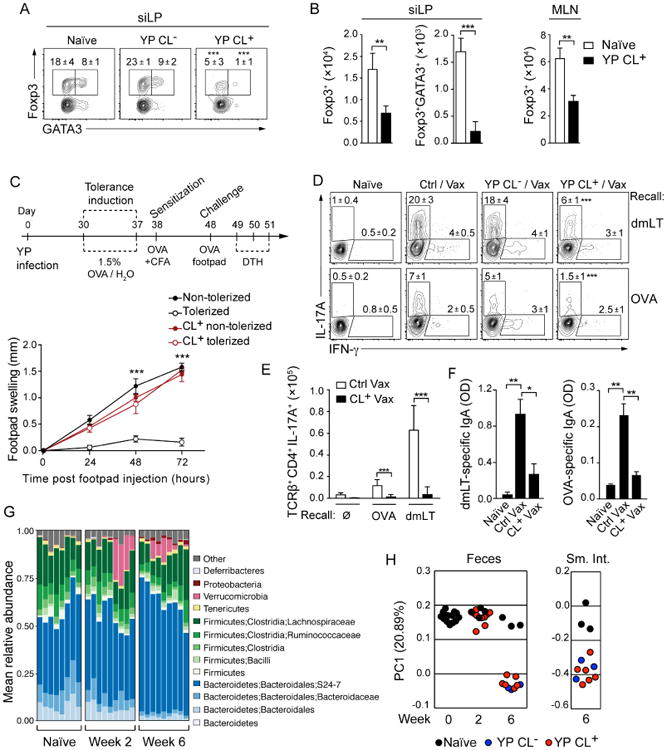
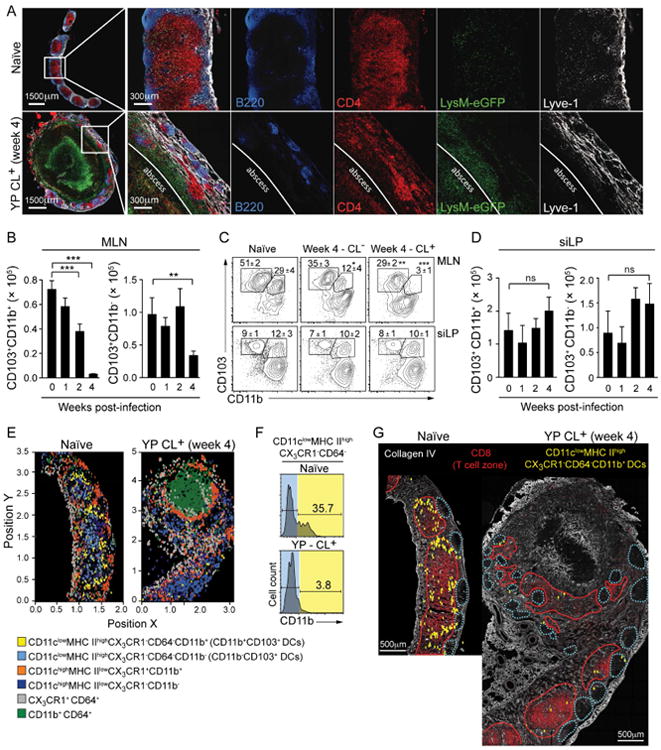
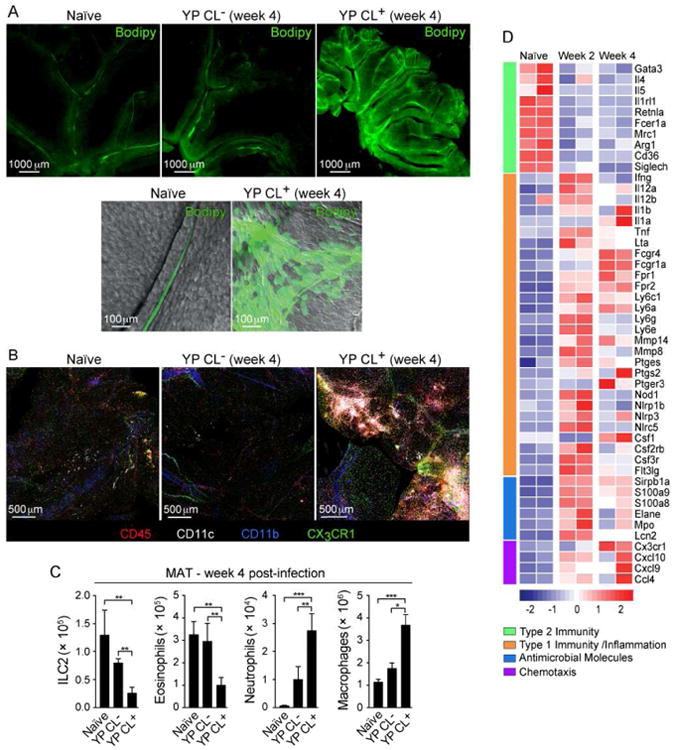
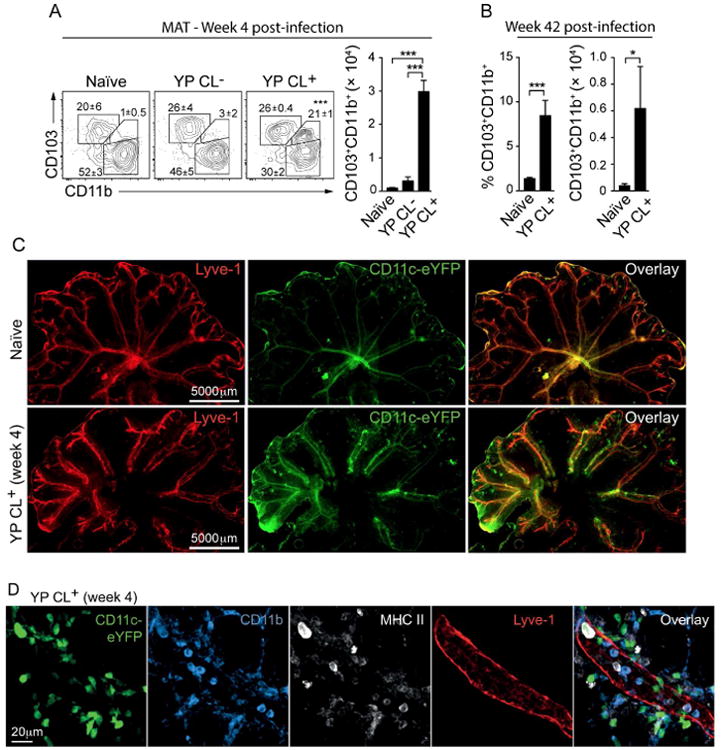
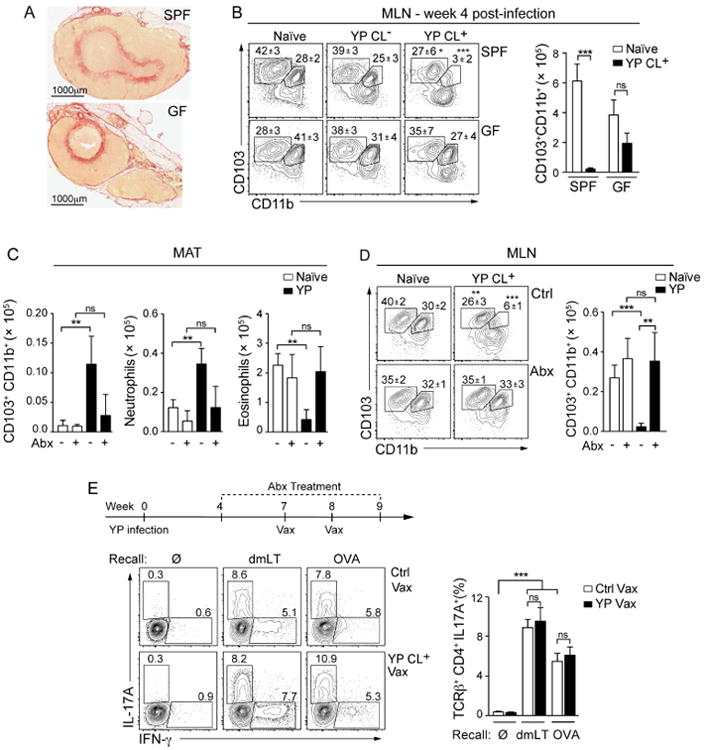
Infections have been proposed as initiating factors for inflammatory disorders; however, identifying associations between defined infectious agents and the initiation of chronic disease has remained elusive. Here, we report that a single acute infection can have dramatic and long-term consequences for tissue-specific immunity. Following clearance of Yersinia pseudotuberculosis, sustained inflammation and associated lymphatic leakage in the mesenteric adipose tissue deviates migratory dendritic cells to the adipose compartment, thereby preventing their accumulation in the mesenteric lymph node. As a consequence, canonical mucosal immune functions, including tolerance and protective immunity, are persistently compromised. Post-resolution of infection, signals derived from the microbiota maintain inflammatory mesentery remodeling and consequently, transient ablation of the microbiota restores mucosal immunity. Our results indicate that persistent disruption of communication between tissues and the immune system following clearance of an acute infection represents an inflection point beyond which tissue homeostasis and immunity is compromised for the long-term. VIDEO ABSTRACT.


Figures

Figure 1
Figure 1. Oral infection with Y. pseudotuberculosis induces persistent mesenteric lymphadenopathy
C57BL/6 mice were orally infected with Y. pseudotuberculosis (YP). (A) Infectious burden in the spleen, MLN and liver at indicated time points. (B and C) Numbers of neutrophils and inflammatory monocytes from siLP, spleen, liver and MLN. (D) Representative flow cytometric contour plots indicating the percentage of neutrophils in the MLNs of naïve and infected mice. (E) Images on the left depict the gastrointestinal tract, mesenteric adipose tissue (MAT) and MLN (dotted lines) from naïve and infected mice. Images on the right show (from top) the axillary, brachial, lumbar, inguinal and mesenteric nodes. (F) Weight of MLN from naïve (white circles) or infected mice with chronic lymphadenopathy (CL+) (black circles) and without lymphadenopathy (CL-) (grey circles). (G) Compilation of 15 separate experiments involving week 4 to week 9 infected mice showing the percent of animals with lymphadenopathy. (H) Histology of naïve and CL+ MLNs stained with picrosirius red. Large arrows show abscesses, arrowheads indicate areas of collagen deposition. (I) Number of neutrophils in the MLN at day 300 post-infection. All bar graphs show the mean ± SEM. All data shown, except I and G, is representative of 3-6 experiments, each containing 3-5 naïve and 6-10 infected animals. Data represented in (I) are representative of 2 experiments with 3 naïve and 3-9 infected animals. *p<0.05, **p<0.005 compared to naïve mice (Student's T test). See also Figure S1.
Figure 2
Figure 2. Infection-induced mesenteric lymphadenopathy is associated with disruption of mucosal immunity
(A and B) Naïve or 4-week infected C57BL/6 (CD45.2) mice were transferred with CD45.1+ Rag1-/- OT-II TCR transgenic T cells (CD45.1), fed ovalbumin (OVA) in the drinking water and cells from the siLP and MLNs were isolated. (A) Representative flow cytometric contour plots of Foxp3 and GATA3 expression by OT-II T cells isolated from the siLP of naïve and infected mice with or without lymphadenopathy (YP CL+ and YP CL-, respectively). Numbers represent the mean percentage within the gate (± SEM) of all samples in this experiment. (B) Numbers of OTII Foxp3+ and OT-II Foxp3+GATA3+ T cells in the siLP and MLN. (C) (Top) Scheme for induction of oral tolerance; CFA – Complete Freund's Adjuvant. (Bottom) Footpad swelling was measured in the feet of sensitized mice after challenge with OVA. (D-F) Naïve, YP CL- and YP CL+ mice were immunized orally with OVA and double mutant heat labile toxin (dmLT). (D and E) Seven days after immunization, lymphocytes were isolated from the siLP and stimulated in vitro with DCs pulsed with dmLT or OVA to measure T cell responses. (D) Flow cytometric contour plots show representative populations of antigen-specific IFN-γ and IL-17A-producing CD4+ T cells from naïve, vaccinated (Ctrl/Vax) or Y. pseudotuberculosis-infected vaccinated (YP CL+/-/Vax) mice. Numbers in plots represent the mean frequency of cells within the adjacent gate (± SEM) of all samples within this experiment. (E) Numbers of IL-17A-producing CD4+ T cells from (D). (F) Measurement of dmLT and OVA-specific fecal IgA by ELISA (OD: Optical Density). (G) Bar graphs showing the fraction of the fecal microbiota represented by individual Operational Taxonomic Units (OTUs) identified by 16S bacterial gene sequencing at the timepoints indicated. (H) Principal coordinate analysis of 16S gene sequencing data derived from fecal and small intestinal samples (Weighted UniFrac). All experiments, except G and H, are representative of 3-5 separate experiments containing 5 control mice and 5-10 infected mice per group. All graphs show the mean ± SEM. *p<0.05, **p<0.005, ***p<0.0005 (Student's T test).
Figure 3
Figure 3. Mesenteric lymphadenopathy is associated with a reduction in migratory DCs in the MLN
(A) LysM-eGFP reporter mice were infected with Y. pseudotuberculosis. At 4 weeks post-infection, sections of naïve or CL+ MLNs were analyzed by confocal microscopy. (B-D) Bar graphs show the numbers of DC subsets (gated as described in Figure S2C), isolated from the MLN (B) and siLP (D) at the time points indicated. (C) Representative flow cytometric contour plots of DC subsets from the MLN and siLP. Numbers in plot represent the mean frequency of cells within the adjacent gate (± SEM) of all samples within this experiment. (E-G) MLN sections from naïve or 4-week infected CX3CR1-GFP reporter mice were stained for analysis by multiparameter confocal microscopy. (E) 3D ‘Cell-of-Interest’ surfaces were generated based on CD11c expression and quantitatively analyzed by histo-cytometry (Figure S3) to identify the X and Y positions of individual cells within the antigen-presenting cell subsets (labels below image). (F) Representative histograms obtained from the histo-cytometric analysis indicating the expression of CD11b+ in cells occupying the CD11c+ MHCIIhigh CX3CR1- CD64- gate (Figure S3). (G) Representative confocal image of MLN sections stained for Collagen IV and CD8α overlaid with the position of CD11c+ MHCIIhigh CX3CR1- CD64- CD11b+ DCs (analogous to CD11b+CD103+ DCs) reconstructed by histo-cytometry. Dotted blue lines represent the B cell zones and red lines indicate the T cell zones. Images in (A), (E) and (G) are representative of 2 separate experiments. Flow cytometry data from (B-D) are representative of 5 experiments each containing 5 control animals and 5-10 infected animals. All bar graphs show the mean ± (SEM). *p<0.05, **p<0.005, ***p<0.0005 (Student's T test). CL+: infected mice with lymphadenopathy; CL-: infected mice without lymphadenopathy. See also Figures S2 and S3.
Figure 4
Figure 4. Mesenteric lymphadenopathy is associated with lymphatic leakage and mesenteric adipose tissue remodeling
(A) Naïve or 4-week infected mice were gavaged with Bodipy. Shown are representative fluorescent microscope images of the MAT (top) or high magnification confocal images of individual MAT lymphatics overlaid with the bright field (bottom). (B) MAT samples from naïve or infected CX3CR1-GFP mice were stained and imaged by confocal microscopy. (C) Numbers of ILC2s, eosinophils, neutrophils and macrophages in the MAT determined by flow cytometry. (D) Heat map of gene expression from CD45+ cells isolated from the MAT at the indicated time points and analyzed by NanoString technology. Images in (A) and (B) are representative of 3 experiments. Data from (C) are representative of 3-5 experiments each containing 5 control animals and 5 -10 infected animals. Data in (D) are representative of 2 separate experiments. All bar graphs show the mean (± SEM). *p<0.05, **p<0.005, ***p<0.0005 (Student's T test). CL+: infected mice with lymphadenopathy; CL-: infected mice without lymphadenopathy. See also Figure S4 and Table S1.
Figure 5
Figure 5. CD103+CD11b+ DCs accumulate in the MAT following the development of mesenteric lymphadenopathy
(A) DC subsets in the MAT as characterized by flow cytometry, according to the gate strategy described in Figure S4E. Shown are representative contour plots of MAT DC subsets from naïve or infected animals (CL+/-). Numbers in plot indicate the mean frequency of cells (± SEM) within the adjacent gate from all samples in this experiment. Bar graph shows the number of CD103+CD11b+ DCs in the MAT. (B) Bar graphs show the frequency and number of CD103+CD11b+ DCs in the MAT at 42 weeks post-infection. (C) Representative whole tissue fluorescent images of MAT from naïve or 4-week infected CD11c-YFP reporter mice. (D) Representative confocal images describing the localization of CD11c+CD11b+MHCII+ cells in relation to lymphatics (LYVE1+) in the MAT. All the data are representative of 3 experiments each containing 5 control animals and 5-10 infected animals. All bar graphs show the mean (± SEM). *p<0.05, ***p<0.0005 (Student's T test). CL+: infected mice with lymphadenopathy; CL-: infected mice without lymphadenopathy. See also Figure S4.
Figure 6
Figure 6. Microbiota sustains MAT inflammation and immune dysfunction post-infection
(A and B) Specific pathogen-free (SPF) or germ-free (GF) C57BL/6 mice were infected with Y. pseudotuberculosis. (A) Sections of MLNs isolated 4 weeks post-infection were stained with picrosirus red. (B) Frequency and number of DC subsets in the MLN. Shown are representative flow cytometric contour plots of DC subsets (gated according to the Figure S2C). Numbers in plots represent the mean frequency (± SEM) of cells within the adjacent gate. Bar graph shows the numbers of CD103+CD11b+ DCs in the MLN. (C and D) Four weeks post-infection, SPF mice were treated with broad-spectrum antibiotics (Abx) for 3 weeks. (C) Bar graphs show the number of CD103+CD11b+ DCs (gated as indicated in Figure S4B), neutrophils and eosinophils isolated from the MAT of naïve or infected animals with or without antibiotic treatment. (D) Shown are representative plots of the MLN DC subsets from naïve and infected mice, with and without antibiotic treatment. Numbers represent the mean frequency (± SEM) of cells within the adjacent gate of all samples within this experiment. Bar graph shows the number of CD103+CD11b+ DCs in the MLNs. (E) (Top) Scheme for vaccination of antibiotic-treated mice. Abx treatment was continued during the vaccination period. 7 days post-immunization, lymphocytes were isolated from the siLP and stimulated in vitro with dmLT or OVA pulsed DCs. (bottom left) Contour plots showing IFN-γ and IL-17A producing CD4+ T cells after vaccination in naïve (Ctrl Vax) or infected (YP Vax) mice treated with Abx. Numbers represent the percent of CD4+ T cells that express each cytokine in the adjacent gate. The bar graph (bottom right) shows the mean percent of IL-17A producing CD4+ T cells from Abx treated naïve or infected mice. All data are representative of 2-3 experiments with 3-5 mice in each control group and 5-7 mice in each infected group. All bar graphs show the mean (± SEM). *p<0.05, **p<0.005, ***p<0.0005 (Student's T test). ns: not significant. CL+: infected mice with lymphadenopathy; CL-: infected mice without lymphadenopathy. See also Figure S5.

Comment in

References

    1. Aldrich MB, Sevick-Muraca EM. Cytokines are systemic effectors of lymphatic function in acute inflammation. Cytokine. 2013;64:362–369. - PMC - PubMed
    1. Asano S. Granulomatous lymphadenitis. J Clin Exp Hematop. 2012;52:1–16. - PubMed
    1. Barton ES, White DW, Cathelyn JS, Brett-McClellan KA, Engle M, Diamond MS, Miller VL, Virgin HWt. Herpesvirus latency confers symbiotic protection from bacterial infection. Nature. 2007;447:326–329. - PubMed
    1. Behr MA. The path to Crohn's disease: is mucosal pathology a secondary event? Inflamm Bowel Dis. 2010;16:896–902. - PubMed
    1. Bekiaris V, Persson EK, Agace WW. Intestinal dendritic cells in the regulation of mucosal immunity. Immunol Rev. 2014;260:86–101. - PubMed

Publication types

MeSH terms