. 2016 Apr;10(4):945-58.
doi: 10.1038/ismej.2015.170. Epub 2015 Oct 9.

Large variability of bathypelagic microbial eukaryotic communities across the world's oceans

Affiliations

Large variability of bathypelagic microbial eukaryotic communities across the world's oceans

Massimo C Pernice et al. ISME J. 2016 Apr.

Abstract

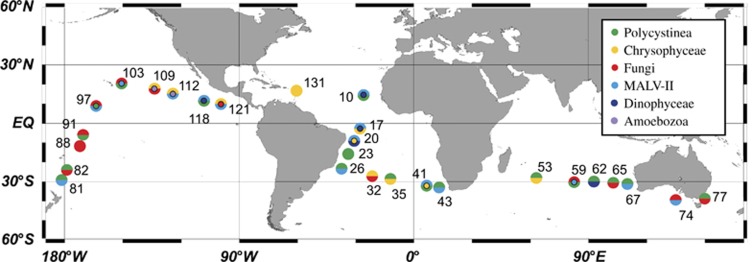
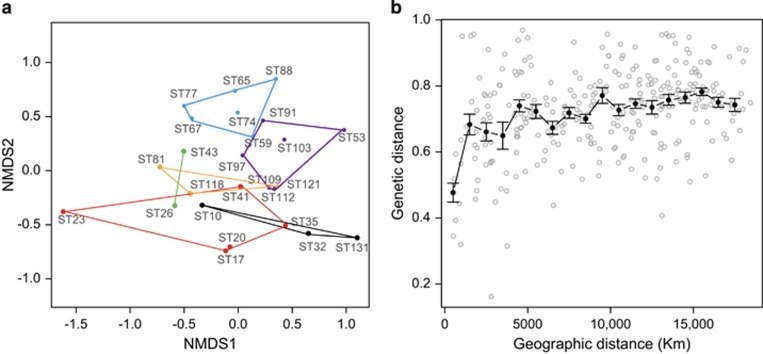
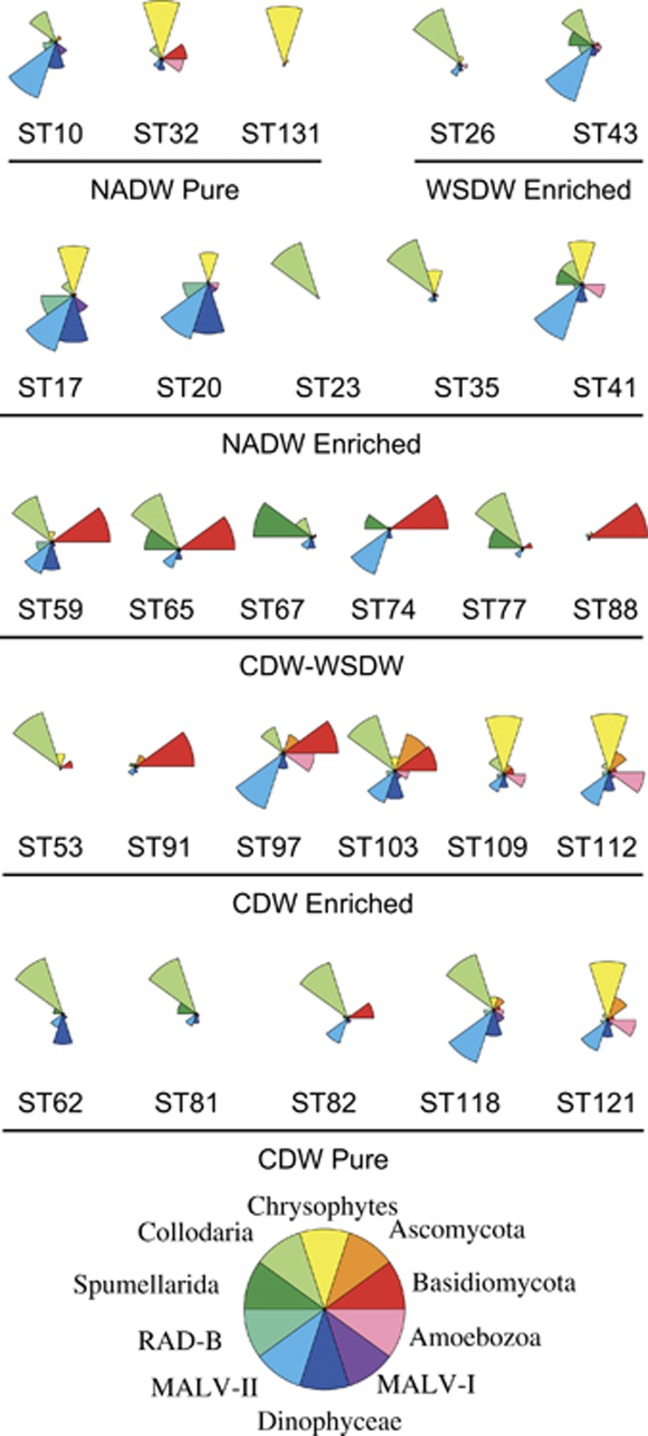
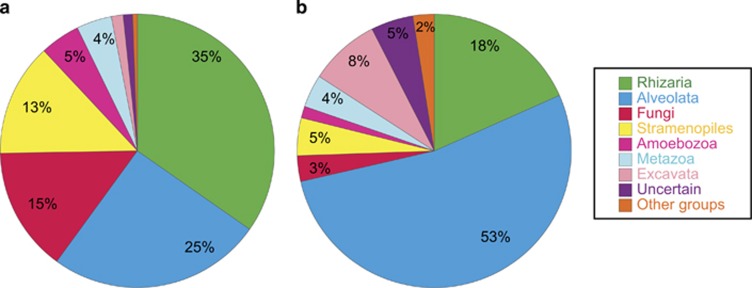
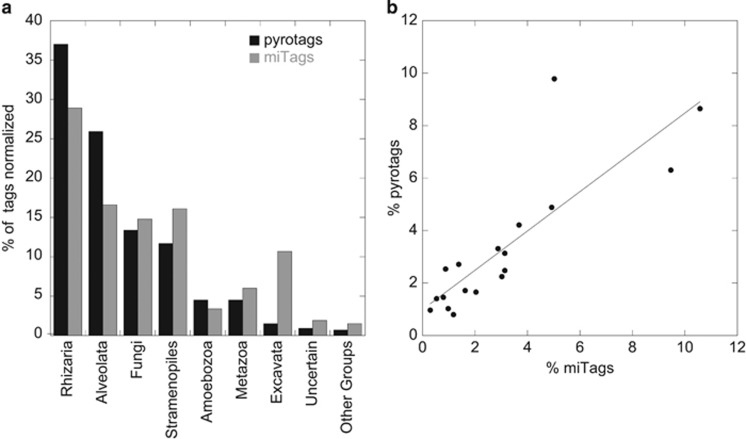
In this work, we study the diversity of bathypelagic microbial eukaryotes (0.8-20 μm) in the global ocean. Seawater samples from 3000 to 4000 m depth from 27 stations in the Atlantic, Pacific and Indian Oceans were analyzed by pyrosequencing the V4 region of the 18S ribosomal DNA. The relative abundance of the most abundant operational taxonomic units agreed with the results of a parallel metagenomic analysis, suggesting limited PCR biases in the tag approach. Although rarefaction curves for single stations were seldom saturated, the global analysis of all sequences together suggested an adequate recovery of bathypelagic diversity. Community composition presented a large variability among samples, which was poorly explained by linear geographic distance. In fact, the similarity between communities was better explained by water mass composition (26% of the variability) and the ratio in cell abundance between prokaryotes and microbial eukaryotes (21%). Deep diversity appeared dominated by four taxonomic groups (Collodaria, Chrysophytes, Basidiomycota and MALV-II) appearing in different proportions in each sample. Novel diversity amounted to 1% of the pyrotags and was lower than expected. Our study represents an essential step in the investigation of bathypelagic microbial eukaryotes, indicating dominating taxonomic groups and suggesting idiosyncratic assemblages in distinct oceanic regions.


Figures

Figure 1
Figure 1
Map of the stations sampled during the Malaspina-2010 cruise that are used for diversity analysis of bathypelagic microbial eukaryotes. Each station is colored according to the dominant taxonomic groups in the sample: one color if a single group represents >75% of the pyrotags, two (or three) colors if the sum of the groups is >50%. Groups with >20% are always displayed. The top half circle indicates the group at higher abundance, followed by the lower half circle and the inner circle.
Figure 2
Figure 2
Alpha diversity of bathypelagic microbial eukaryotic assemblages as inferred by the analysis of pyrosequences clustered at 97% similarity. (a) Rarefaction curves for each sample, relating the number of OTUs detected as a function of the sequencing effort. (b) Global rarefaction curve relating the OTUs detected to the number of reads from all samples.
Figure 3
Figure 3
Beta diversity in bathypelagic microbial eukaryotic assemblages. (a) NMDS plot based in Bray–Curtis distances displaying community similarity. Samples are grouped according to the water mass: NADW pure (black), NADW enriched (red), CDW pure (yellow), CDW enriched (violet), CDW–WSDW (light blue), WSDW enriched (green). (b) Plot showing Bray–Curtis dissimilarities and geographic distances between assemblages. Average values (±s.e.) in intervals of 1000 km are shown in black.
Figure 4
Figure 4
Relative abundance of the 10 most abundant taxonomic groups in all deep samples. Stations are grouped by their respective water mass.
Figure 5
Figure 5
Overview of the diversity of deep microbial eukaryotes at the supergroup taxonomic level. (a) Number of pyrotags per supergroup, averaging the relative abundance in each sample. (b) Number of OTUs clustered at 97% of similarity (OTU97) per supergroup.
Figure 6
Figure 6
Comparison between pyrosequencing and metagenomics approaches. (a) Relative abundance of each supergroup averaging in both cases the relative abundance in the 24 stations in common. (b) Relationship of the relative abundance of miTags versus pyrotags for the 20 most abundant OTUs.

References

    1. Acinas S, Sarma-Rupavtarm R, Klepac-Ceraj V, Polz M. (2005). PCR-induced sequence artifacts and bias: insights from comparison of two 16S rRNA clone libraries constructed from the same sample. Appl Environ Microbiol 71: 8966. - PMC - PubMed
    1. Agogué H, Brink M, Dinasquet J, Herndl GJ. (2008). Major gradients in putatively nitrifying and non-nitrifying Archaea in the deep North Atlantic. Nature 456: 788–791. - PubMed
    1. Agusti S, Gonzalez-Gordillo JI, Vaque D, Estrada M, Cerezo MI, Salazar G et al. (2015). Ubiquitous healthy diatoms in the deep sea confirm deep carbon injection by the biological pump. Nat Commun 6: e-pub ahead of print 9 July 2015; doi:10.1038/ncomms8608. - PMC - PubMed
    1. Angel MV. (1993). Biodiversity of the Pelagic ocean. Conserv Biol 7: 760–772.
    1. Arístegui J, Gasol JM, Duarte CM, Herndl GJ. (2009). Microbial oceanography of the dark ocean's Pelagic realm. Limnol Oceanogr 54: 1501–1529.

Publication types