. 2015 Oct 13;6(31):32138-53.
doi: 10.18632/oncotarget.5171.

Amphiregulin activates regulatory T lymphocytes and suppresses CD8+ T cell-mediated anti-tumor response in hepatocellular carcinoma cells

Affiliations

Amphiregulin activates regulatory T lymphocytes and suppresses CD8+ T cell-mediated anti-tumor response in hepatocellular carcinoma cells

Chun-Hui Yuan et al. Oncotarget. .

Abstract

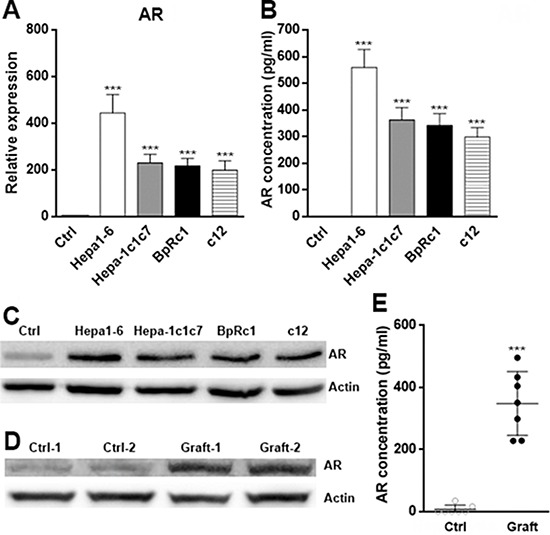
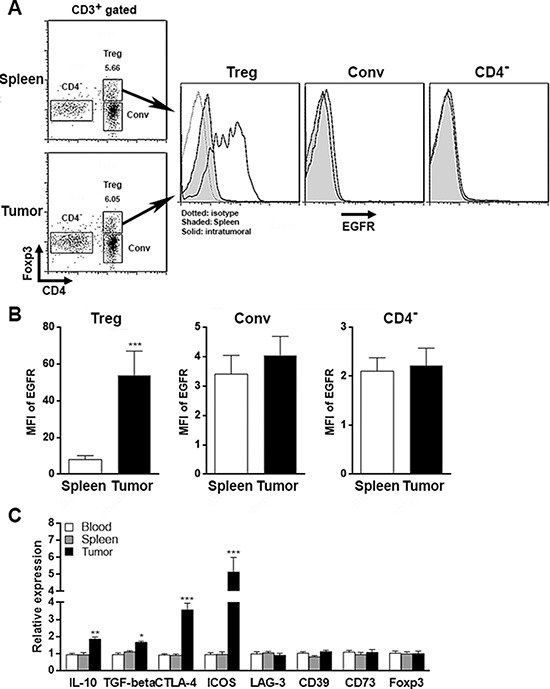
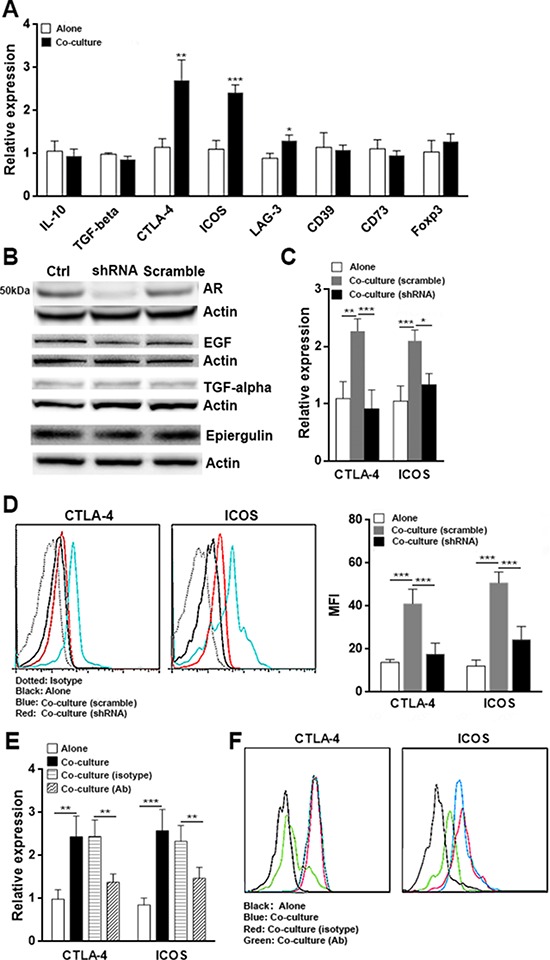
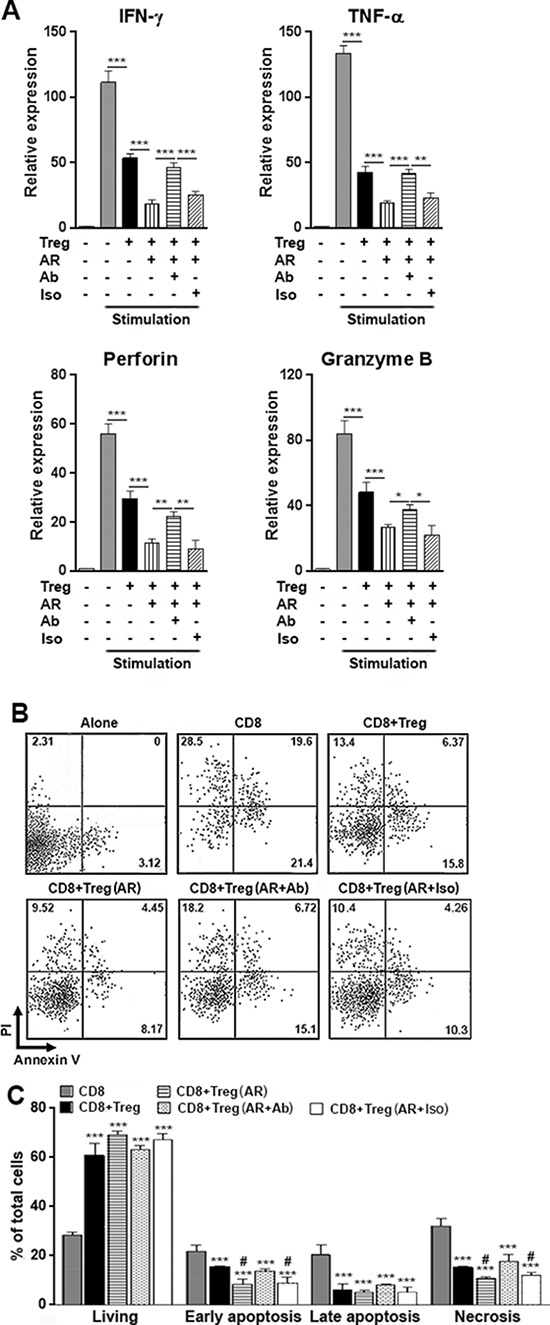
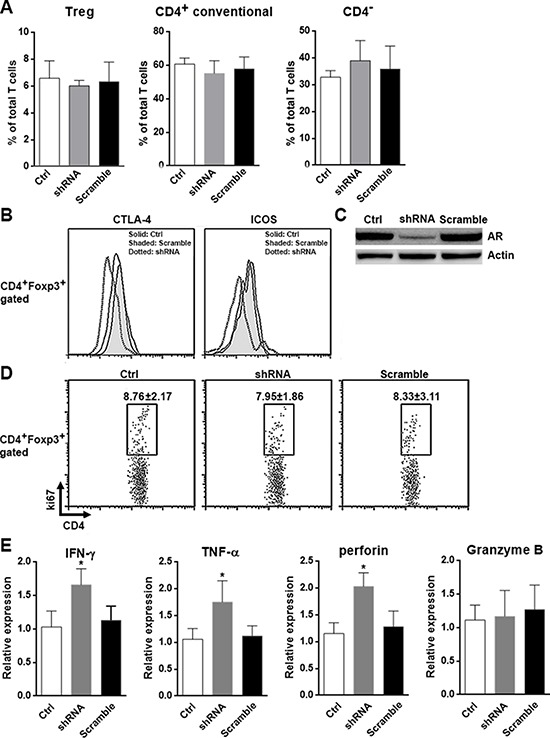
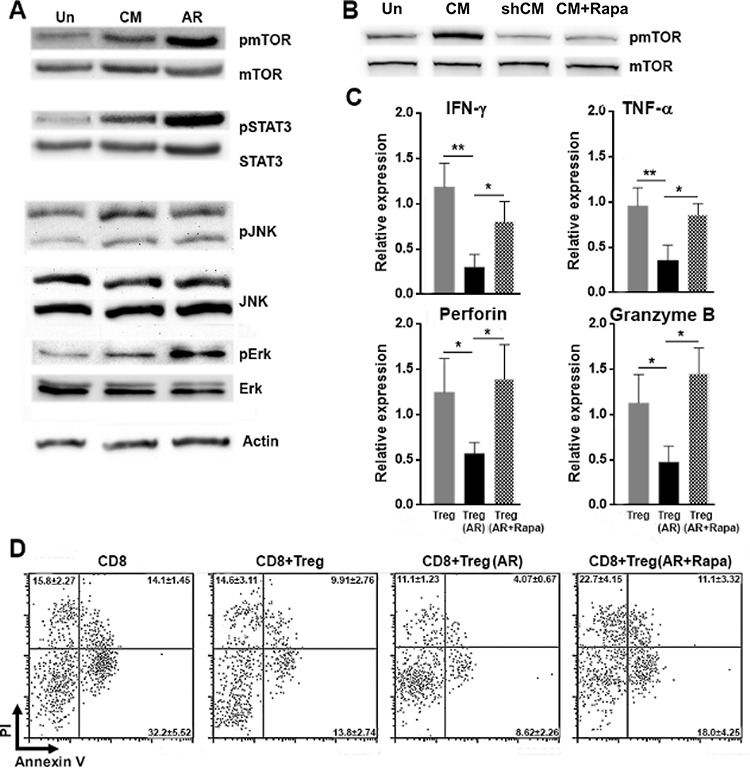
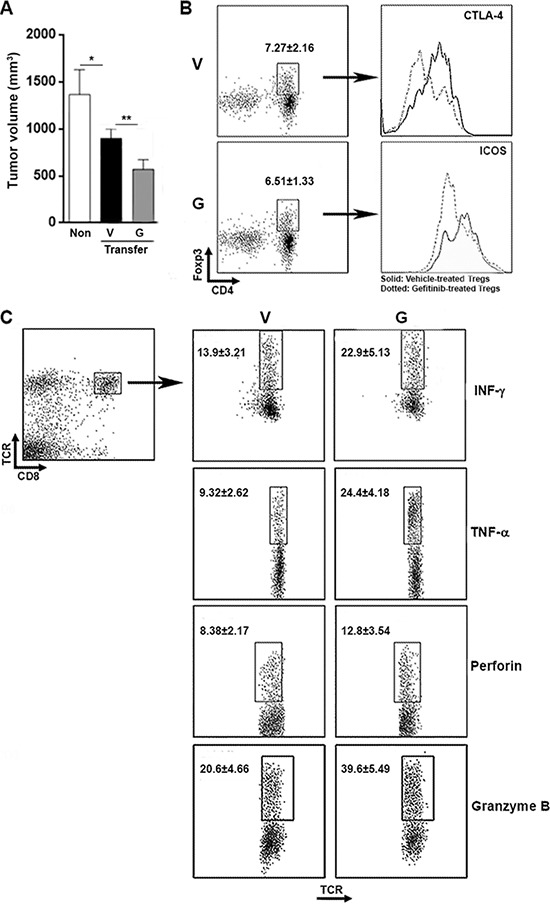
CD8+ T cell-mediated immune response plays an important role in inhibiting progression of hepatocellular carcinoma (HCC). For strategic immunotherapy, it is critical to understand why some of the tumor cells escape from this immune attack. In this study, we investigated how HCC cells alter endogenous anti-tumor immunity and their related signaling pathways. We found that HCC cells, both in vitro and in vivo, substantially secret and express amphiregulin (AR). AR in turn activates immunosuppressive function of intratumoral CD4+Foxp3+ regulatory T cells (Tregs), a major inhibitor of CD8+ T cells. Using either lentiviral siRNA, or AR neutralizing antibody, we blocked the expression and function of AR to test the specificity of AR mediated activation of Tregs, Biochemical and cell biology studies were followed and confirmed that blocking of AR inhibited Tregs activation. In addition, we found that AR can trigger the activation of rapamycin complex 1(mTORC1) signaling in Tregs. The mTORC1 inhibitor rapamycin treatment led to compromise Treg function and resulted in enhancing anti-tumor function of CD8+ T cells. Blocking AR/EGFR signaling in Tregs with Gefitinib also enhanced anti-tumor immunity and decreased tumor size in a mouse xenograft tumor model. Taken together, our study suggested a novel mechanism of functional interaction between HCC and Tregs for regulating anti-tumor function of CD8+ T cells.

Keywords: CD4+ regulatory T cells; CD8+ T cells; amphiregulin; hepatocellular carcinoma.


Conflict of interest statement

CONFLICTS OF INTEREST

No potential conflicts of interest were disclosed.

Figures

Figure 1
Figure 1. Expression of AR in HCC cell lines
A-C. Normal murine hepatocytes, murine HCC cell lines Hepa1–6, Hepa-1c1c7, BpRc1 and c12b were cultured in vitro. AR expression was determined by qRT-PCR (A), ELISA (B) and Western blotting (C) Ctrl, normal hepatocytes. D-E. AR expression in normal liver tissue and Hepa1–6 xenografts in Rag1−/− mice were determined by Western blotting (D) and ELISA (E) Ctrl, normal liver tissue; Graft, Hepa1–6 xenograft. N = 8 per group. Data presented as mean ± SD. ***P < 0.001 compared with ctrl.
Figure 2
Figure 2. Phenotype of intratumoral Tregs
A. Detection of EGFR on T cells isolated from Rag1−/− mouse spleens and Hepa1–6 xenografts after adoptive transfer of C57BL/6J splenic T cells. Each T subset was gated for analysis of EGFR expression. Left panel, gating strategies for T subsets. Numbers in the plots were the percentages of Tregs in total T cells. Right panel, representative histograms of EGFR staining. Spleen, splenic T cells; tumor, intratumoral T cells. Conv, CD4+ conventional T cells. CD4, CD4 T cells (mostly CD8+ T cells). B. Statistical analysis on the mean fluorescent intensity (MFI) of EGFR staining. C. Signature gene expression in Tregs isolated from blood, spleens and tumor xenografts was determined by qRT-PCR. N = 8 per group. Data presented as mean ± SD. *p < 0.05; **p < 0.01; ***p < 0.001 compared with splenic Tregs.
Figure 3
Figure 3. HCC cells alter Treg phenotype through AR
A. Intratumoral Tregs were enriched from intratumoral mononuclear cells as described in Materials and methods. Tregs were co-cultured with Hepa1–6 cells in Transwell plates for 24 h, followed by determining Tregs signature gene expression using qRT-PCR. Alone, Tregs cultured alone; Co-culture, Tregs cultured with Hepa1–6 cells. B. Tranfection of Hepa1–6 cells with AR shRNA-containing lentivirus (LV-ARsh) down-regulated AR protein level. Ctrl, non-transfected cells; shRNA, cells transfected with AR shRNA-containing lentivirus; Scramble, cells transfected with scramble shRNA-containing lentivirus (LV-scramble). This is a representative of two independent experiments. (C–D) Intratumoral Tregs were co-cultured with Hepa1–6 cells transfected with LV-ARsh or LV-scramble. Expression of CTLA-4 and ICOS in Tregs was analyzed by qRT-PCR C. and flow cytometry D. Left panel of (D), representative histograms. Right panel of (D), Statistical analysis for the mean fluorescent intensity (MFI) of CTLA-4 and ICOS. E-F. Tumor-infiltrating Tregs were co-cultured with Hepa1–6 cells in the presence of AR neutralizing antibody or polyclonal goat IgG. Expression of CTLA-4 and ICOS in Tregs was analyzed by qRT-PCR (E) and flow cytometry (F) Alone, Tregs cultured alone; Co-culture (scramble), Tregs cultured with LV-scramble-transfected Hepa1–6; Co-culture (shRNA), Tregs cultured with LV-ARsh-transfected Hepa1–6. Co-culture (isotype), Tregs cultured with Hepa1–6 cells in the presence of polyclonal goat IgG; Co-culture (Ab), Tregs cultured with Hepa1–6 cells in the presence of AR neutralizing antibody. N = 6 per group. Data presented as mean ± SD. *p < 0.05; **p < 0.01; ***p < 0.001.
Figure 4
Figure 4. AR promotes Treg activity to suppress anti-tumor immunity in vitro
A. Intratumoral CD8+ T cells and Tregs were isolated from Hepa1–6 xenografts and were co-cultured in the medium containing agonistic antibodies (anti-CD3 and anti-CD28). 100 ng/ml AR, 10 μg/ml AR neutralizing antibody or 10 μg/ml polyclonal goat IgG were present or absent in the co-culture. At day 4 after antibodies stimulation, CD8+ T cells were sorted by flow cytometry, and expression of IFN-γ, TNF-α, perforin and granzyme B were analyzed using qRT-PCR. *p < 0.05; **p < 0.01; ***p < 0.001. B–C. Intratumoral CD8+ T cells and Tregs were treated the same way as in (A) At day 4 after stimulation, CD8+ T cells were sorted by flow cytometry and were added into Hepa1–6 cells for additional 24 h incubation. Then CD8 Hepa1–6 cells were stained with PI and Annexin V to analyze cell death. Representative dot plots of cell death is shown in (B) Numbers in the quadrants are the percentages of each cell population. Statistical analysis for cell death is shown in (C) Stimulation, stimulation with agonistic antibodies; Ab, AR neutralizing antibody; Iso, polyclonal goat IgG; Alone, Hepa1–6 cells cultured alone; CD8, Hepa1–6 cells cultured with CD8+ T cells; CD8+Treg, Hepa1–6 cells cultured with CD8+ T cells which were previously cultured with Tregs; CD8+Treg (AR), Hepa1–6 cells cultured with CD8+ T cells which were previously cultured with Tregs and AR; CD8+Treg (AR+Ab), Hepa1–6 cells cultured with CD8+ T cells which were previously cultured with Tregs and AR and AR neutralizing antibody. CD8+Treg (AR+Iso), Hepa1–6 cells cultured with CD8+ T cells which were previously cultured with Tregs and AR and polyclonal goat IgG. N = 6 per group. Data presented as mean ± SD. *p < 0.05; **p < 0.01; ***p < 0.001 compared with CD8 group. #p < 0.05 compared with CD8+Treg group.
Figure 5
Figure 5. AR suppresses anti-tumor activity of CD8+ T cells in vivo
A. Proportion of each T subset in the Hepa1–6 xenografts was determined by flow cytometry. B. Histograms of the expression of CTLA-4 and ICOS on intratumoral Tregs determined by flow cytometry. This is a representative of three independent experiments. C. AR expression in the xenografts was determined by Western blotting. This is a representative of two independent experiments. D. Intratumoral Tregs proliferation was determined by ki67 staining. Numbers in the plots were the percentages of ki67+ cells presented as mean ± SD. E. Expression of IFN-γ, TNF-α, perforin and granzyme B in intratumoral CD8+ T cells were analyzed using qRT-PCR. Ctrl, xenografts of non-transfected Hepa1–6 cells; shRNA, xenografts of LV-shRNA-transfected Hepa1–6 cells; Scramble, xenografts of LV-scramble-transfected Hepa1–6 cells. N = 7 per group. *p < 0.05.
Figure 6
Figure 6. AR promotes Treg activity through mTORC1 signaling
A. Tregs were cultured in Hepa1–6-conditioned medium or in the medium containing 100 ng/ml AR for 1 h. Phosphorylation of indicated signaling molecules determined by Western blotting. Un, untreated Tregs; CM, hepa1–6-conditioned medium; AR, AR-containing medium. B. mTOR phosphorylation in cultured Tregs determined by Western blotting. Un, untreated Tregs; CM, conditioned medium of non-transfected hepa1–6 cells; shCM, conditioned medium of LV-ARsh-transfected hepa1–6 cells; CM+Rapa, conditioned medium of non-transfected hepa1–6 cells with rapamycin. C. Tregs were treated with 100 ng/ml AR and 100 ng/ml rapamycin for 24 h. Tregs were then mixed with intratumoral CD8+ T cells at 1:1 and cultured for additional 24 h. Then the expression of IFN-γ, TNF-α, perforin and granzyme B in CD8+ T cells were analyzed using qRT-PCR. Treg, CD8+ T cells cultured with untreated Tregs; Treg (AR), CD8+ T cells cultured with Tregs pre-treated with AR; Treg (AR+Rapa), CD8+ T cells cultured with Tregs pre-treated with AR and rapamycin. D. The experimental procedure was the same as (C), except that after co-culture with Tregs, CD8+ T cells were sorted by flow cytometry and were added into Hepa1–6 cells. 24 h after addition of CD8+ T cells, Hepa1–6 cell death was determined. CD8, Hepa1–6 cells cultured with CD8+ T cells; CD8+Treg, Hepa1–6 cells cultured with CD8+ T cells which were previously cultured with Tregs; CD8+Treg (AR), Hepa1–6 cells cultured with CD8+ T cells which were previously cultured with AR-treated Tregs; CD8+Treg (AR+Rapa), Hepa1–6 cells cultured with CD8+ T cells which were previously cultured with AR-and-rapamycin-treated Tregs. N = 8 per group. Data presented as mean ± SD. *p < 0.05; **p < 0.01.
Figure 7
Figure 7. Inhibition of EGFR in Tregs leads to activation of T cells and tumor suppression
A. Tumor xenograft size in recipient mice. Non, non-transferred mice; Transfer, mice transferred with T cells; V, mice transferred with vehicle-treated T cells; G, mice transferred with Gefitinib-treated T cells. B. Expression CTLA-4 and ICOS on Tregs. This is a representative data of three mice. V, mice transferred with vehicle-treated T cells; G, mice transferred with Gefitinib-treated T cells. C. Expression of IFN-γ, TNF-α, perforin and granzyme B in intrtumoral CD8+ T cells were determined by flow cytometry. Numbers in the plots are the percentages of gated positive cells presented as mean ± SD. N = 8 per group. V, mice transferred with vehicle-treated T cells; G, mice transferred with Gefitinib-treated T cells. *p < 0.05; **p < 0.01.

Similar articles

Cited by

References

    1. Mizukoshi E, Nakamoto Y, Arai K, Yamashita T, Sakai A, Sakai Y, et al. Comparative analysis of various tumor-associated antigen-specific t-cell responses in patients with hepatocellular carcinoma. Hepatology. 2011;53:1206–16. - PubMed
    1. Korangy F, Ormandy LA, Bleck JS, Klempnauer J, Wilkens L, Manns MP, et al. Spontaneous tumor-specific humoral and cellular immune responses to NY-ESO-1 in hepatocellular carcinoma. Clin Cancer Res. 2004;10:4332–41. - PubMed
    1. Chen W, Jin W, Hardegen N, Lei KJ, Li L, Marinos N, et al. Conversion of peripheral CD4+CD25- naive T cells to CD4+CD25+ regulatory T cells by TGF-beta induction of transcription factor Foxp3. J Exp Med. 2003;198:1875–86. - PMC - PubMed
    1. Curiel TJ, Coukos G, Zou L, Alvarez X, Cheng P, Mottram P, et al. Specific recruitment of regulatory T cells in ovarian carcinoma fosters immune privilege and predicts reduced survival. Nat Med. 2004;10:942–9. - PubMed
    1. Wei S, Kryczek I, Zou W. Regulatory T-cell compartmentalization and trafficking. Blood. 2006;108:426–31. - PMC - PubMed

Publication types

MeSH terms