. 2015 Nov 3;6(34):35978-90.
doi: 10.18632/oncotarget.5427.

MiR-573 inhibits prostate cancer metastasis by regulating epithelial-mesenchymal transition

Affiliations

MiR-573 inhibits prostate cancer metastasis by regulating epithelial-mesenchymal transition

Lin Wang et al. Oncotarget. .

Abstract

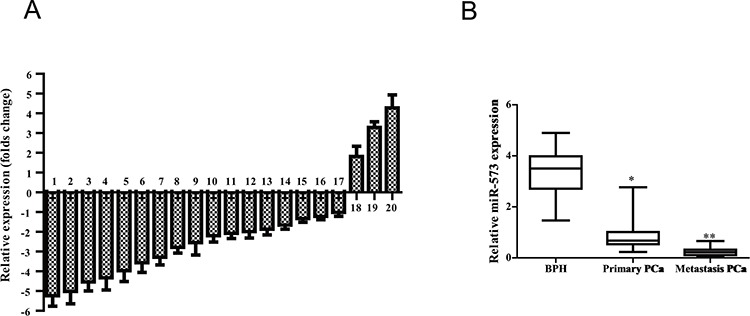
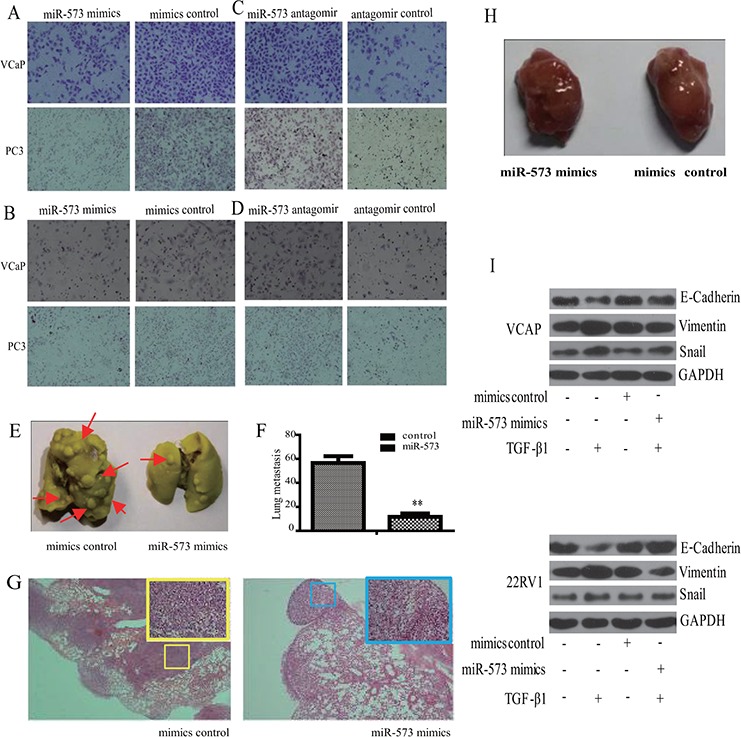
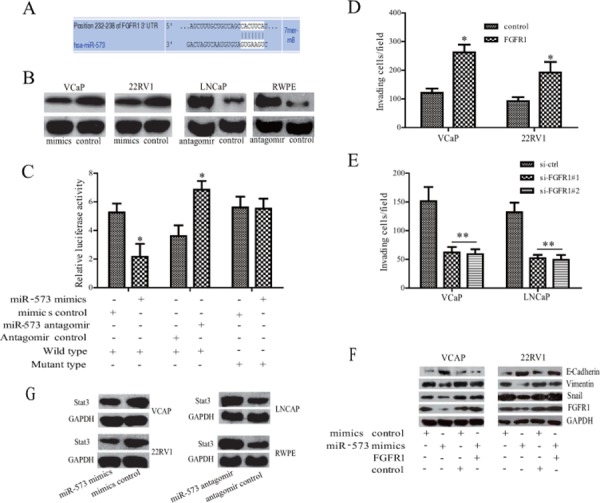
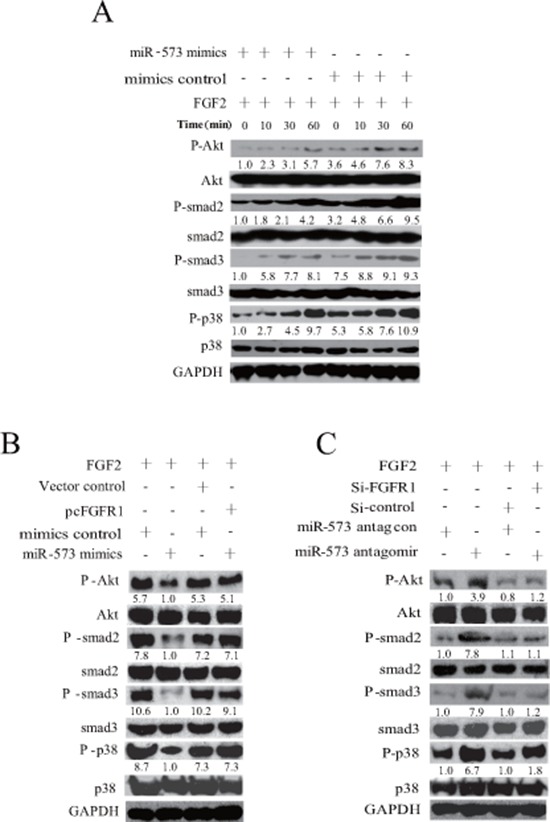
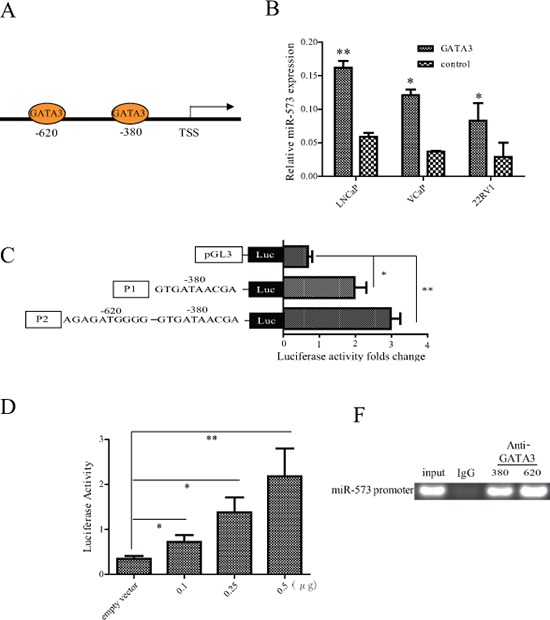
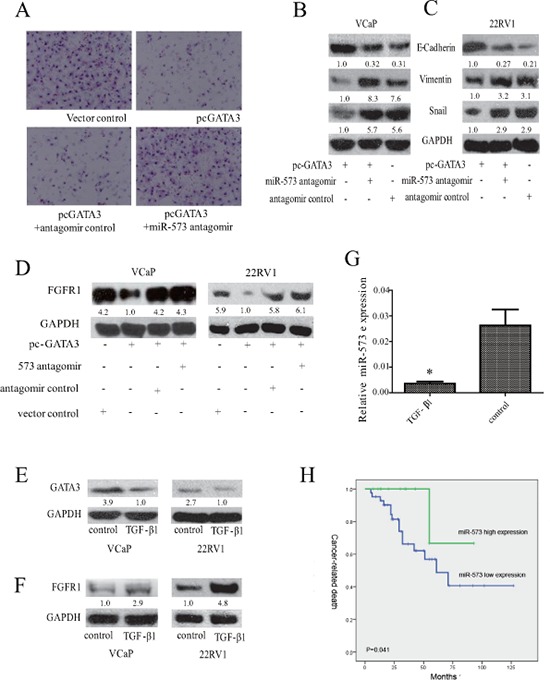
The metastastic cascade is a complex process that is regulated at multiple levels in prostate cancer (PCa). Recent evidence suggests that microRNAs (miRNAs) are involved in PCa metastasis and hold great promise as therapeutic targets. In this study, we found that miR-573 expression is significantly lower in metastatic tissues than matched primary PCa. Its downregulation is correlated with high Gleason score and cancer-related mortality of PCa patients (P = 0.041, Kaplan-Meier analysis). Through gain- and loss-of function experiments, we demonstrated that miR-573 inhibits PCa cell migration, invasion and TGF-β1-induced epithelial-mesenchymal transition (EMT) in vitro and lung metastasis in vivo. Mechanistically, miR573 directly targets the fibroblast growth factor receptor 1 (FGFR1) gene. Knockdown of FGFR1 phenocopies the effects of miR-573 expression on PCa cell invasion, whereas overexpression of FGFR1 partially attenuates the functions of miR-573. Consequently, miR-573 modulates the activation of FGFR1-downstream signaling in response to fibroblast growth factor 2 (FGF2). Importantly, we showed that GATA3 directly increases miR-573 expression, and thus down-regulates FGFR1 expression, EMT and invasion of PCa cells in a miR-573-dependent manner, supporting the involvement of GATA3, miR-573 and FGFR1 in controlling the EMT process during PCa metastasis. Altogether, our findings demonstrate a novel mechanism by which miR-573 modulates EMT and metastasis of PCa cells, and suggest miR-573 as a potential biomarker and/or therapeutic target for PCa management.

Keywords: FGFR1; GATA3; metastasis; miR-573; prostate cancer.


Conflict of interest statement

CONFLICTS OF INTEREST

The authors declare no conflict of interest.

Figures

Figure 1
Figure 1. miR-573 level is decreased in human prostate cancer tissues
A. Quantitation of 20 miRNAs were performed using qRT-PCR in three matched-pairs of primary and metastasis tissues and the results are shown as folds number in metastatic to primary ones. 1–20 represents miR-199, miR-573, miR-505, miR-449, miR-107, miR-23b, miR-22, miR-26b, miR-26a, miR-149, miR-455, miR-195, miR-331, miR-146a/b, miR-374b, miR-184, miR-301a, miR-92, miR-223 and miR-374a, respectively. B. qRT-PCR was further applied to investigate the miR-573 expression in BPH (n = 12), primary tumor (n = 65) and metastatic tissues (n = 15). *p < 0.05, **p < 0.01. Data are means of biological triplicates (± standard error).
Figure 2
Figure 2. Effect of miR-573 on cell motility in vitro and and tumor metastasis in vivo
Transwell migration A, B. and invasion C, D. assays were applied to detect the invasive and migratory potentials of VCaP and PC3 cells after transfection with the miR-573 mimics (left), its antagomir (right) or their controls, respectively (200 nM). E. VCaP stably transfected with miR573 and its controls were injected subcutaneously into the flanks of nude mice (n = 10). The metastatic foci in the lung is shown in (E) and quantified in F. G. Representative H&E staining images of lungs from one mouse per treatment group are shown. miR-573 mimics transfection showed significantly reduced number of metastatic lesions (red arrow). H. Tumor volumes of tumor mouse model were measured. I. Western blot was performed to detect the expression of E-cadherin, Vimentin and Snail in VCaP and 22RV1 cells during TGF-β1 induced EMT. Mimics/antagomir control: cells transfected with the mimics/antagomir control; miR-573 mimics/antagomir: cells transfected with the miR-573 mimics/antagomir. *p < 0.05, **p < 0.01. Data in F are means of biological triplicates (± standard error) and are representative of duplicate (E–H) or triplicate (A–D) experiments.
Figure 3
Figure 3. FGFR1 is directly targeted by miR-573 during EMT process
A. The 3′-UTR element of EGFR1 messenger RNA is partially complementary to miR-573. B. Western blot was performed to detect the expression of FGFR1 in different kinds of cells after the indicated transfection. C. Luciferase reporter assay was used to analyse whether FGFR1 was a direct target of miR-573. HEK293T cells were co-transfected with FGFR1–3′-UTR luciferase reporter, wild or mutant-type, mimicss control or miR-573 mimicss and antagomir control or miR-573 antagomir for 48 hours before analysis. Firefly luciferase activity of the reporter was normalized to the internal Renilla luciferase activity. The means ± SD of three independent experiments are shown. D. VCaP and 22RV1 cells were co-transfected with FGFR1 or empty vector together with miR-573. Forty-eight hours later, transwell assay was applied. E. VCaP and LNCaP were transfected with si-ctrl or with si-FGFR1 together with miR-573 antagomir. Forty-eight hours later, invasion ability was detected by Transwell apparatus. F. E-cadherin, Vimentin and Snail were assayed by Western blot analysis. G. The Stat3 expression was detected by Western blot analysis in various PCa cell lines after the indicated transfection. *p < 0.05, **p < 0.01. Data in D and E are means of biological triplicates (± standard error) and all data are representative of duplicate experiments.
Figure 4
Figure 4. miR-573 inhibits FGFR1 signaling
A. Phospgorylation and total levels of Akt, smad2, smad3, p38 was assayed by Western blot with the FGF2 stimulation in VCaP cells after miR-573 mimicss or its control transfection. B. After co-transfection with lentivirus of miR573 and FGFR1 expression plasmids in VCaP cells, activation of signaling pathways was measured by Western blot in response to FGF2. C. Effects of silencing FGFR1 on Akt, smad2, smad3, p38 activation in VCaP cells with/without miR-573 antagomir transfection by Western blotting. The quantification of each protein band in the result of Western blotting was done using LAS-3000 with MultiGauge software (Fuji film). The amount of phosphorylated protein was normalized versus that of total ones. Data are representative of triplicate experiments.
Figure 5
Figure 5. The expression of miR-573 was directly regulated by GATA3
A. The putative GATA3 binding sites in two gene promoter regions. B. Expression of miR-573 was determined by qRT-PCR after overexpressing GATA3 in indicated cell lines. C. Luciferase activity was assayed after co-transfection with GATA3 expression plasmid and miR57-pGL3-pro constructs with different lengthens of its promoter. D. Luciferase assay of miR-573 transcriptional activity in HEK392T cells after transfection with GATA3 expression plasmid of increased concentrations. E. ChIP was performed using an anti-GATA3 antibody and a rabbit IgG as the control. *p < 0.05, **p < 0.01. Data in (B–D) are means of biological triplicates (± standard error) and are representative of triplicate (B–E) experiments.
Figure 6
Figure 6. Association of miR-573 expression with FGFR1 and GATA3 in PCa
A. The invasive ability was measured by Transwell apparatus after the indicated transfeciton. Expression of E-cadherin, Vimentin and Snail were examined by Western blot after co-transfection with GATA3 vector or its control, and miR-573 antagomir or its control in VCaP B. and 22RV1 C. D. Western blot was applied to assay the expression of FGFR1 in VCaP and 22RV1 after indicated transfection. The expression levels of GATA3 E. and FGFR1 F. were detected by Western blot in VCaP and 22RV1 during TGF-β1 treament. G. miR-573 expression was detected in VCaP and 22RV1 cells after TGF-beta1 treatment by qRT-PCR. H. Kaplan-Meier metastasis-free survival curve comparing 2 groups of high (greater than the mean; n = 22) and low (less than the mean; n = 43) miR-573 expression level in the tumors of 65 localized PCa patients; A total of 55 PCa patients were available for prognostic analysis. P value is based on a log-rank test. *p < 0.05. Data C is means of biological triplicates (±standard error) and are representative of triplicate (A–E) experiments. The quantification of protein bands in Western blot was done using LAS-3000 with MultiGauge software.

References

    1. Hudson BD, Kulp KS, Loots GG. Prostate cancer invasion and metastasis: insights from mining genomic data. Briefings in functional genomics. 2013;12:397–410. - PubMed
    1. Wen X, Deng FM, Wang J. MicroRNAs as predictive biomarkers and therapeutic targets in prostate cancer. American journal of clinical and experimental urology. 2014;2:219–230. - PMC - PubMed
    1. Bouyssou JM, Manier S, Huynh D, Issa S, Roccaro AM, Ghobrial IM. Regulation of microRNAs in cancer metastasis. Biochimica et biophysica acta. 2014;1845:255–265. - PMC - PubMed
    1. Guo F, Parker Kerrigan BC, Yang D, Hu L, Shmulevich I, Sood AK, Xue F, Zhang W. Post-transcriptional regulatory network of epithelial-to-mesenchymal and mesenchymal-to-epithelial transitions. Journal of hematology & oncology. 2014;7:19. - PMC - PubMed
    1. Saraon P, Jarvi K, Diamandis EP. Molecular alterations during progression of prostate cancer to androgen independence. Clinical chemistry. 2011;57:1366–1375. - PubMed

Publication types

MeSH terms