

Galectin-1 Prevents Infection and Damage Induced by Trypanosoma cruzi on Cardiac Cells
- PMID: 26451839
- PMCID: PMC4599936
- DOI: 10.1371/journal.pntd.0004148
Galectin-1 Prevents Infection and Damage Induced by Trypanosoma cruzi on Cardiac Cells
Abstract
Background: Chronic Chagas cardiomyopathy caused by Trypanosoma cruzi is the result of a pathologic process starting during the acute phase of parasite infection. Among different factors, the specific recognition of glycan structures by glycan-binding proteins from the parasite or from the mammalian host cells may play a critical role in the evolution of the infection.
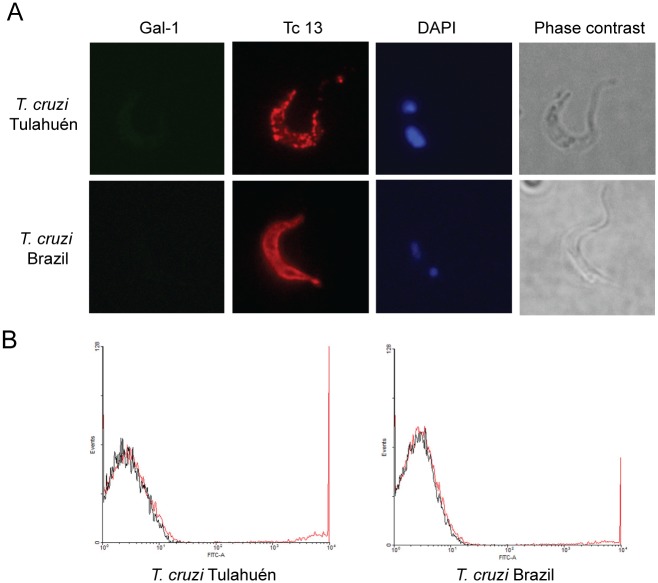
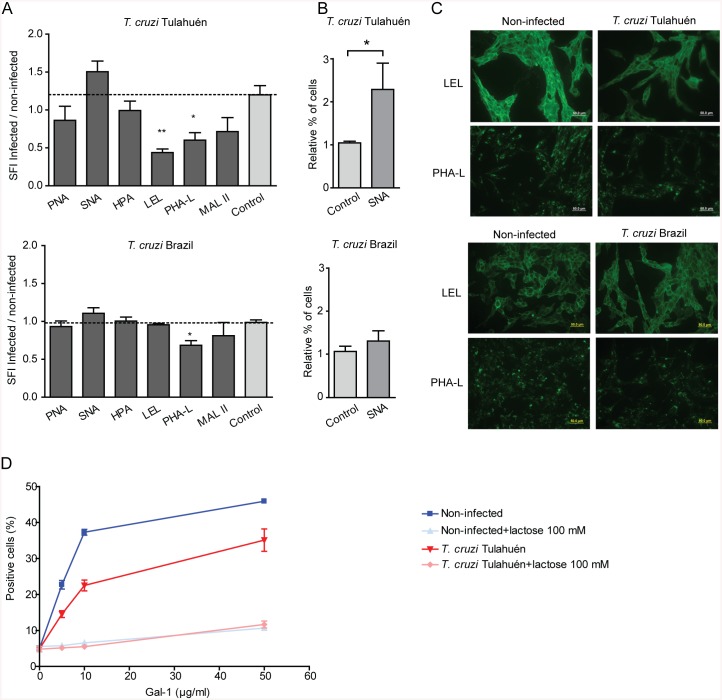
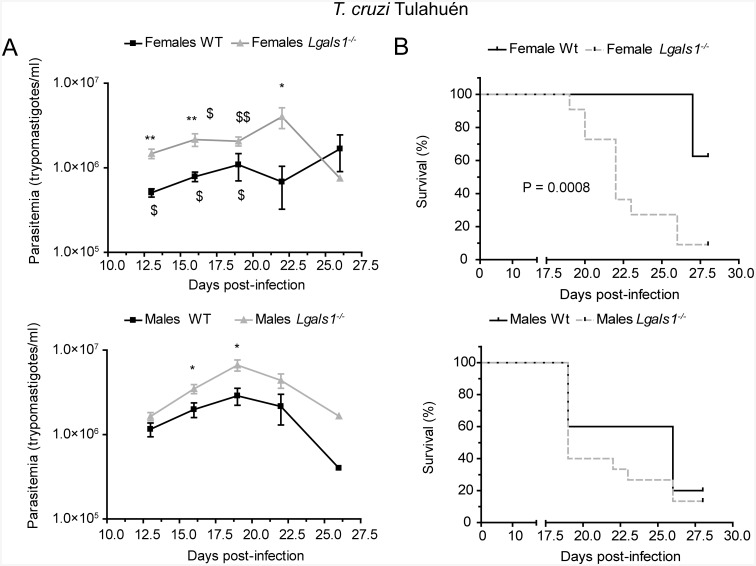
Methodology and principal findings: Here we investigated the contribution of galectin-1 (Gal-1), an endogenous glycan-binding protein abundantly expressed in human and mouse heart, to the pathophysiology of T. cruzi infection, particularly in the context of cardiac pathology. We found that exposure of HL-1 cardiac cells to Gal-1 reduced the percentage of infection by two different T. cruzi strains, Tulahuén (TcVI) and Brazil (TcI). In addition, Gal-1 prevented exposure of phosphatidylserine and early events in the apoptotic program by parasite infection on HL-1 cells. These effects were not mediated by direct interaction with the parasite surface, suggesting that Gal-1 may act through binding to host cells. Moreover, we also observed that T. cruzi infection altered the glycophenotype of cardiac cells, reducing binding of exogenous Gal-1 to the cell surface. Consistent with these data, Gal-1 deficient (Lgals1-/-) mice showed increased parasitemia, reduced signs of inflammation in heart and skeletal muscle tissues, and lower survival rates as compared to wild-type (WT) mice in response to intraperitoneal infection with T. cruzi Tulahuén strain.
Conclusion/significance: Our results indicate that Gal-1 modulates T. cruzi infection of cardiac cells, highlighting the relevance of galectins and their ligands as regulators of host-parasite interactions.
Conflict of interest statement
The authors have declared that no competing interests exist.
Figures


Similar articles
-
Trypanosoma cruzi Infection Imparts a Regulatory Program in Dendritic Cells and T Cells via Galectin-1-Dependent Mechanisms.J Immunol. 2015 Oct 1;195(7):3311-24. doi: 10.4049/jimmunol.1403019. Epub 2015 Aug 31. J Immunol. 2015. PMID: 26324777
-
Galectin-3: A Friend but Not a Foe during Trypanosoma cruzi Experimental Infection.Front Cell Infect Microbiol. 2017 Nov 3;7:463. doi: 10.3389/fcimb.2017.00463. eCollection 2017. Front Cell Infect Microbiol. 2017. PMID: 29164071 Free PMC article.
-
Lack of Galectin-3 Prevents Cardiac Fibrosis and Effective Immune Responses in a Murine Model of Trypanosoma cruzi Infection.J Infect Dis. 2015 Oct 1;212(7):1160-71. doi: 10.1093/infdis/jiv185. Epub 2015 Mar 24. J Infect Dis. 2015. PMID: 25805753
-
Trypanosoma cruzi recognition by macrophages and muscle cells: perspectives after a 15-year study.Mem Inst Oswaldo Cruz. 1992;87 Suppl 5:43-56. doi: 10.1590/s0074-02761992000900006. Mem Inst Oswaldo Cruz. 1992. PMID: 1342716 Review.
-
Infection by the Sylvio X10/4 clone of Trypanosoma cruzi: relevance of a low-virulence model of Chagas' disease.Microbes Infect. 2009 Nov;11(13):1037-45. doi: 10.1016/j.micinf.2009.07.011. Epub 2009 Aug 4. Microbes Infect. 2009. PMID: 19660570 Review.
Cited by
-
Haptoglobin is dispensable for haemoglobin uptake by Trypanosoma brucei.Front Immunol. 2024 Jul 18;15:1441131. doi: 10.3389/fimmu.2024.1441131. eCollection 2024. Front Immunol. 2024. PMID: 39114668 Free PMC article.
-
The interplay of galectins-1, -3, and -9 in the immune-inflammatory response underlying cardiovascular and metabolic disease.Cardiovasc Diabetol. 2022 Nov 19;21(1):253. doi: 10.1186/s12933-022-01690-7. Cardiovasc Diabetol. 2022. PMID: 36403025 Free PMC article. Review.
-
The Glycan Structure of T. cruzi mucins Depends on the Host. Insights on the Chameleonic Galactose.Molecules. 2020 Aug 27;25(17):3913. doi: 10.3390/molecules25173913. Molecules. 2020. PMID: 32867240 Free PMC article. Review.
-
Novel 3D human trophoblast culture to explore T. cruzi infection in the placenta.Front Cell Infect Microbiol. 2024 Aug 6;14:1433424. doi: 10.3389/fcimb.2024.1433424. eCollection 2024. Front Cell Infect Microbiol. 2024. PMID: 39165920 Free PMC article.
-
Disease Tolerance and Pathogen Resistance Genes May Underlie Trypanosoma cruzi Persistence and Differential Progression to Chagas Disease Cardiomyopathy.Front Immunol. 2018 Dec 3;9:2791. doi: 10.3389/fimmu.2018.02791. eCollection 2018. Front Immunol. 2018. PMID: 30559742 Free PMC article.
References
-
- Moncayo A, Silveira AC. Current epidemiological trends for Chagas disease in Latin America and future challenges in epidemiology, surveillance and health policy. Mem Inst Oswaldo Cruz. 2009; 104: 17–30. - PubMed
-
- World Health Organization. Chagas disease: control and elimination. UNDP/World Bank/WHO. http://apps.who.int/gb/ebwha/pdf_files/WHA63/A63_17-en.pdf. (Accessed 2011 Nov 9); 2010.
-
- Coura JR, Viñas PA. Chagas disease: a new worldwide challenge. Nature. 2010; 465: 56–57 - PubMed
-
- Alves MJ, Colli W. Trypanosoma cruzi: adhesion to the host cell and intracellular survival. IUBMB Life. 2007; 59: 274–279. - PubMed
Publication types
MeSH terms
Substances
LinkOut - more resources
Full Text Sources
Other Literature Sources
Medical
Research Materials
Miscellaneous
