

Probabilistic modeling of the evolution of gene synteny within reconciled phylogenies
- PMID: 26452018
- PMCID: PMC4603630
- DOI: 10.1186/1471-2105-16-S14-S5
Probabilistic modeling of the evolution of gene synteny within reconciled phylogenies
Abstract
Background: Most models of genome evolution concern either genetic sequences, gene content or gene order. They sometimes integrate two of the three levels, but rarely the three of them. Probabilistic models of gene order evolution usually have to assume constant gene content or adopt a presence/absence coding of gene neighborhoods which is blind to complex events modifying gene content.
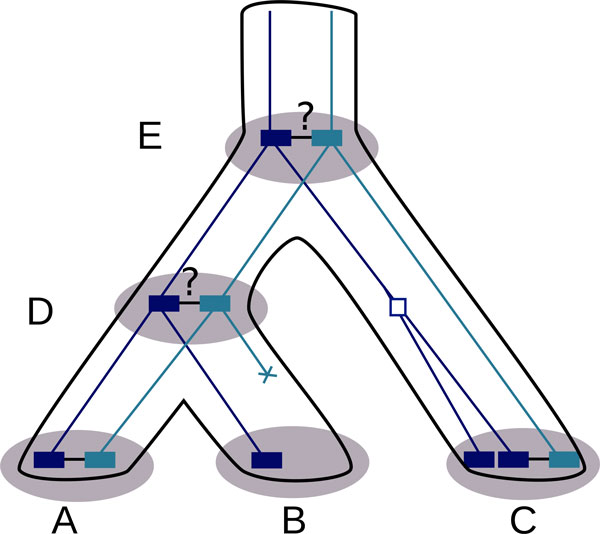
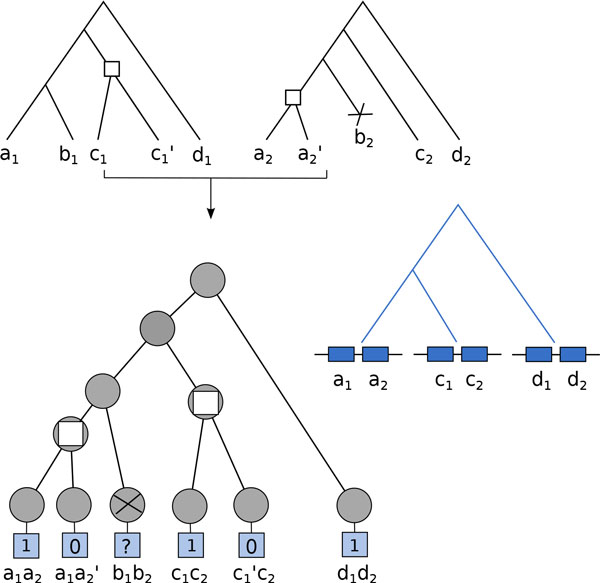
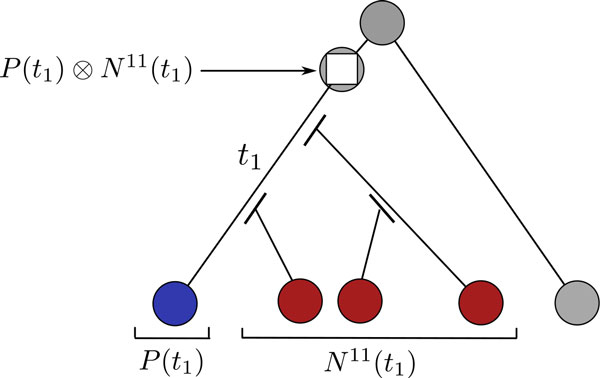
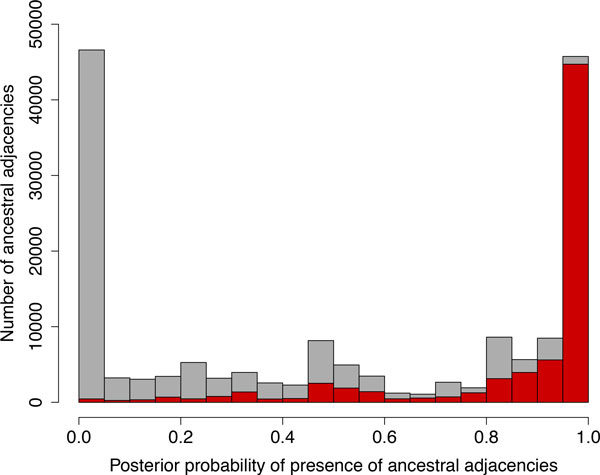
Results: We propose a probabilistic evolutionary model for gene neighborhoods, allowing genes to be inserted, duplicated or lost. It uses reconciled phylogenies, which integrate sequence and gene content evolution. We are then able to optimize parameters such as phylogeny branch lengths, or probabilistic laws depicting the diversity of susceptibility of syntenic regions to rearrangements. We reconstruct a structure for ancestral genomes by optimizing a likelihood, keeping track of all evolutionary events at the level of gene content and gene synteny. Ancestral syntenies are associated with a probability of presence.
Figures
Similar articles
-
Orthologs, turn-over, and remolding of tRNAs in primates and fruit flies.BMC Genomics. 2016 Aug 11;17(1):617. doi: 10.1186/s12864-016-2927-4. BMC Genomics. 2016. PMID: 27515907 Free PMC article.
-
GENESPACE tracks regions of interest and gene copy number variation across multiple genomes.Elife. 2022 Sep 9;11:e78526. doi: 10.7554/eLife.78526. Elife. 2022. PMID: 36083267 Free PMC article.
-
Techniques for multi-genome synteny analysis to overcome assembly limitations.Genome Inform. 2006;17(2):152-61. Genome Inform. 2006. PMID: 17503388
-
Analysis of gene order evolution beyond single-copy genes.Methods Mol Biol. 2012;855:397-429. doi: 10.1007/978-1-61779-582-4_15. Methods Mol Biol. 2012. PMID: 22407718 Review.
-
Evolutionary context can clarify gene names: Teleosts as a case study.Bioessays. 2021 Jun;43(6):e2000258. doi: 10.1002/bies.202000258. Epub 2021 Apr 7. Bioessays. 2021. PMID: 33829511 Review.
Cited by
-
Transcriptologs: A Transcriptome-Based Approach to Predict Orthology Relationships.Bioinform Biol Insights. 2017 Feb 23;11:1177932217690136. doi: 10.1177/1177932217690136. eCollection 2017. Bioinform Biol Insights. 2017. PMID: 28469416 Free PMC article.
References
-
- Felsenstein J. Inferring Phylogenies. Sinauer Associates, Incorporated, New York; 2004.
-
- Sjöstrand J, Tofigh A, Daubin V, Arvestad L, Sennblad B, Lagergren J. A bayesian method for analyzing lateral gene transfer. Syst Biol. 2014;63(3):409–420. - PubMed
-
- Boussau B, Daubin V. Genomes as documents of evolutionary history. Trends Ecol Evol. 2010;25(4):224–32. - PubMed
-
- Chauve C, El-Mabrouk N, Guéguen L, Semeria M, Tannier E. In: Model Algorithms Genome Evol. Chauve C, El-Mabrouk N, Tannier E, editor. Springer, London; 2013. Duplication, Rearrangement and Reconciliation: A Follow-Up 13 Years Later; pp. 47–62. Chap. 4.
Publication types
MeSH terms
LinkOut - more resources
Full Text Sources
Molecular Biology Databases
