

Transgenerational inheritance of enhanced susceptibility to radiation-induced medulloblastoma in newborn Ptch1⁺/⁻ mice after paternal irradiation
- PMID: 26452034
- PMCID: PMC4742164
- DOI: 10.18632/oncotarget.5553
Transgenerational inheritance of enhanced susceptibility to radiation-induced medulloblastoma in newborn Ptch1⁺/⁻ mice after paternal irradiation
Abstract
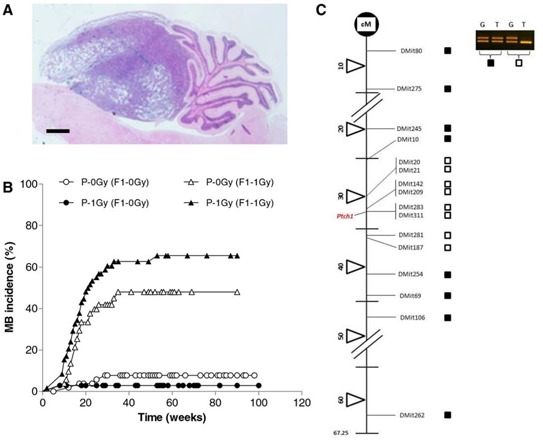
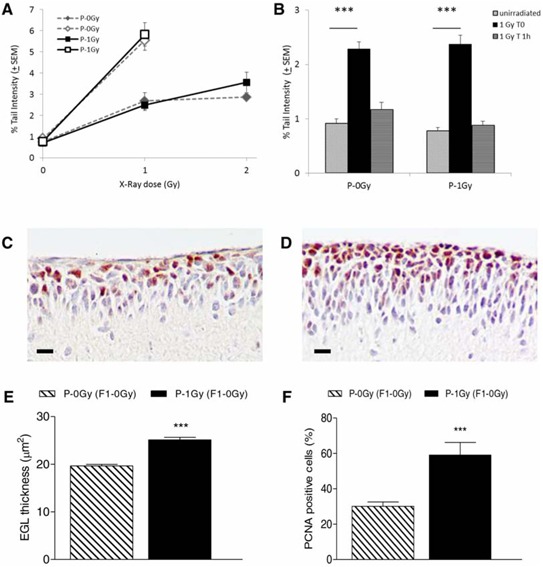
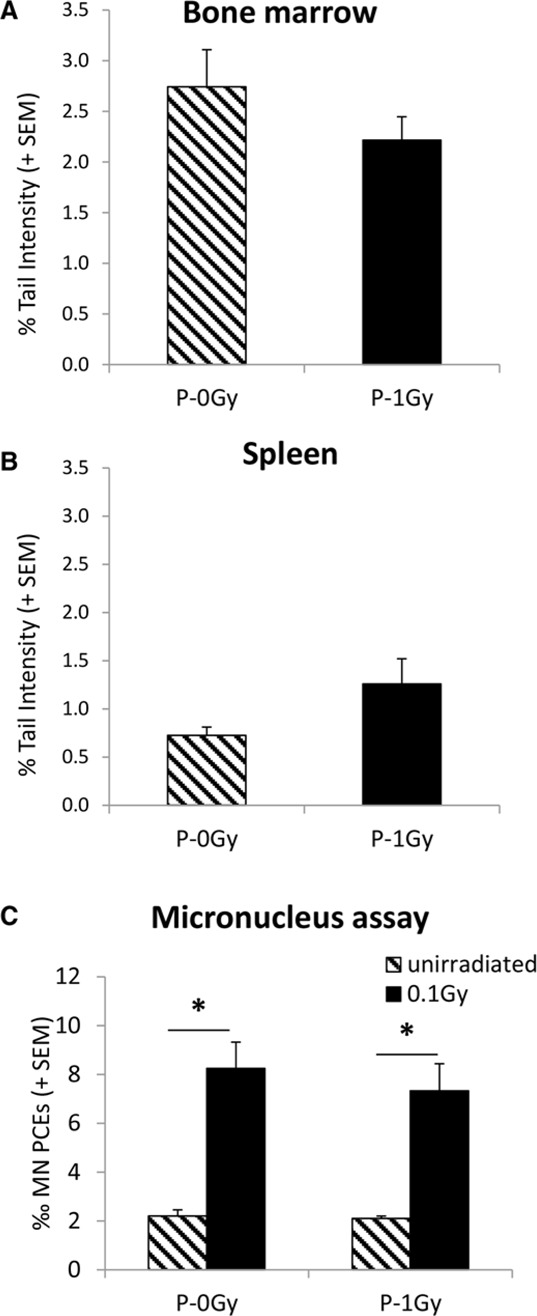
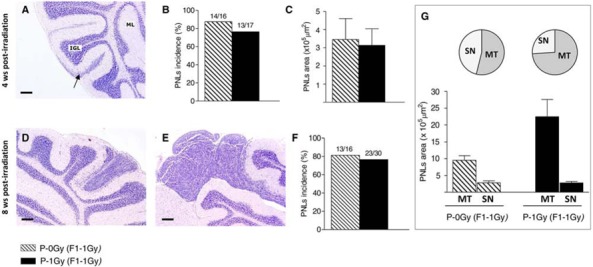
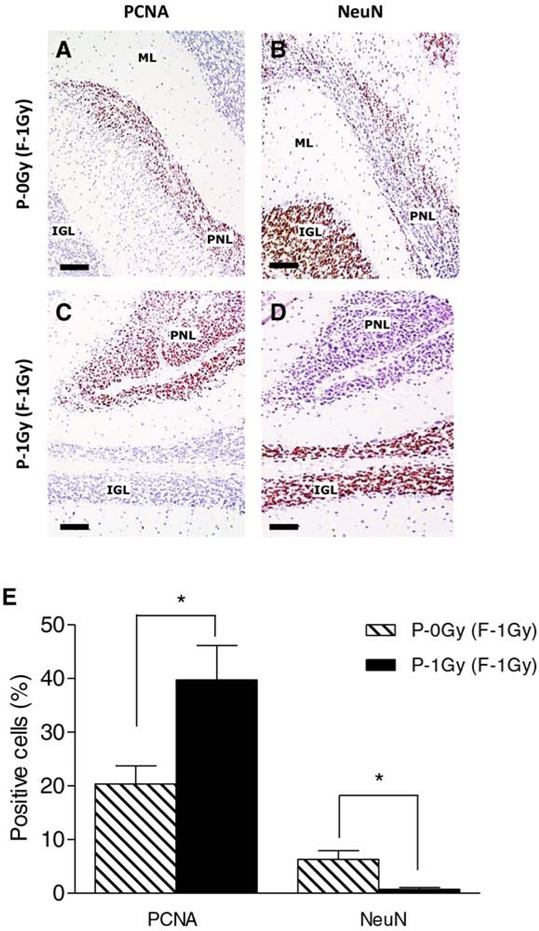
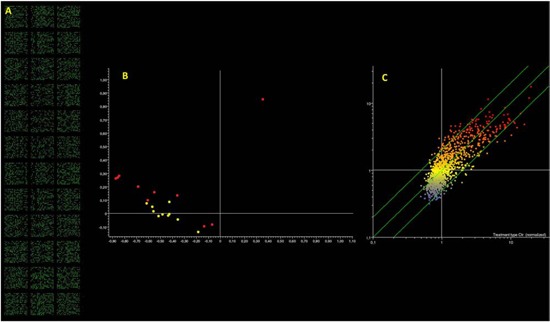
The hypothesis of transgenerational induction of increased cancer susceptibility after paternal radiation exposure has long been controversial because of inconsistent results and the lack of a mechanistic interpretation. Here, exploiting Ptch1 heterozygous knockout mice, susceptible to spontaneous and radiation-induced medulloblastoma, we show that exposure of paternal germ cells to 1 Gy X-rays, at the spermatogonial stage, increased by a considerable 1.4-fold the offspring susceptibility to medulloblastoma induced by neonatal irradiation. This effect gained further biological significance thanks to a number of supporting data on the immunohistochemical characterization of the target tissue and preneoplastic lesions (PNLs). These results altogether pointed to increased proliferation of cerebellar granule cell precursors and PNLs cells, which favoured the development of frank tumours. The LOH analysis of tumor DNA showed Ptch1 biallelic loss in all tumor samples, suggesting that mechanisms other than interstitial deletions, typical of radiation-induced medulloblastoma, did not account for the observed increased cancer risk. This data was supported by comet analysis showing no differences in DNA damage induction and repair in cerebellar cells as a function of paternal irradiation. Finally, we provide biological plausibility to our results offering evidence of a possible epigenetic mechanism of inheritance based on radiation-induced changes of the microRNA profile of paternal sperm.
Keywords: epigenetic inheritance; medulloblastoma; microRNA; patched1 knockout mice; transgenerational carcinogenesis.
Conflict of interest statement
The authors declare no conflict of interest.
Figures
Similar articles
-
Linking DNA damage to medulloblastoma tumorigenesis in patched heterozygous knockout mice.Oncogene. 2006 Feb 23;25(8):1165-73. doi: 10.1038/sj.onc.1209032. Oncogene. 2006. PMID: 16407852
-
Sensitive Detection of Radiation-Induced Medulloblastomas after Acute or Protracted Gamma-Ray Exposures in Ptch1 Heterozygous Mice Using a Radiation-Specific Molecular Signature.Radiat Res. 2016 Oct;186(4):407-414. doi: 10.1667/RR14499.1. Epub 2016 Sep 30. Radiat Res. 2016. PMID: 27690174
-
Genomic and gene expression signatures of radiation in medulloblastomas after low-dose irradiation in Ptch1 heterozygous mice.Carcinogenesis. 2010 Sep;31(9):1694-701. doi: 10.1093/carcin/bgq145. Epub 2010 Jul 8. Carcinogenesis. 2010. PMID: 20616149
-
Ptc1 heterozygous knockout mice as a model of multi-organ tumorigenesis.Cancer Lett. 2006 Mar 28;234(2):124-34. doi: 10.1016/j.canlet.2005.03.047. Epub 2005 May 31. Cancer Lett. 2006. PMID: 15925443 Review.
-
Epigenetic events in medulloblastoma development.Neurosurg Focus. 2005 Nov 15;19(5):E10. doi: 10.3171/foc.2005.19.5.11. Neurosurg Focus. 2005. PMID: 16398460 Review.
Cited by
-
A Brief Overview of Radiation-Induced Effects on Spermatogenesis and Oncofertility.Cancers (Basel). 2022 Feb 4;14(3):805. doi: 10.3390/cancers14030805. Cancers (Basel). 2022. PMID: 35159072 Free PMC article. Review.
-
Low-Dose Radiation Can Cause Epigenetic Alterations Associated With Impairments in Both Male and Female Reproductive Cells.Front Genet. 2021 Aug 2;12:710143. doi: 10.3389/fgene.2021.710143. eCollection 2021. Front Genet. 2021. PMID: 34408775 Free PMC article.
-
Molecular mechanisms of transgenerational epigenetic inheritance.Nat Rev Genet. 2022 Jun;23(6):325-341. doi: 10.1038/s41576-021-00438-5. Epub 2022 Jan 4. Nat Rev Genet. 2022. PMID: 34983971 Review.
-
Gorlin Syndrome: Recent Advances in Genetic Testing and Molecular and Cellular Biological Research.Int J Mol Sci. 2020 Oct 13;21(20):7559. doi: 10.3390/ijms21207559. Int J Mol Sci. 2020. PMID: 33066274 Free PMC article. Review.
-
The Non-coding Side of Medulloblastoma.Front Cell Dev Biol. 2020 May 27;8:275. doi: 10.3389/fcell.2020.00275. eCollection 2020. Front Cell Dev Biol. 2020. PMID: 32528946 Free PMC article. Review.
References
-
- Rassoulzadegan M, Grandjean V, Gounon P, Vincent S, Gillot I, Cuzin F. RNA-mediated non-mendelian inheritance of an epigenetic change in the mouse. Nature. 2006;441:469–474. - PubMed
-
- Wagner KD, Wagner N, Ghanbarian H, Grandjean V, Gounon P, Cuzin F, Rassoulzadegan M. RNA induction and inheritance of epigenetic cardiac hypertrophy in the mouse. Developmental Cell. 2008;14:962–969. - PubMed
-
- Grandjean V, Gounon P, Wagner N, Martin L, Wagner KD, Bernex F, Cuzin F, Rassoulzadegan M. The miR-124-Sox9 paramutation: RNA-mediated epigenetic control of embryonic and adult growth. Development. 2009;136:3647–3655. - PubMed
-
- Fullston T, Ohlsson Teague EM, Palmer NO, DeBlasio MJ, Mitchell M, Corbett M, Print CG, Owens JA, Lane M. Paternal obesity initiates metabolic disturbances in two generations of mice with incomplete penetrance to the F2 generation and alters the transcriptional profile of testis and sperm microRNA content. FASEB Journal. 2013;27:4226–4243. - PubMed
Publication types
MeSH terms
Substances
LinkOut - more resources
Full Text Sources
Other Literature Sources
Molecular Biology Databases
