Both IGF1R and INSR Knockdown Exert Antitumorigenic Effects in Prostate Cancer In Vitro and In Vivo
- PMID: 26452103
- PMCID: PMC4669362
- DOI: 10.1210/me.2015-1073
Both IGF1R and INSR Knockdown Exert Antitumorigenic Effects in Prostate Cancer In Vitro and In Vivo
Abstract
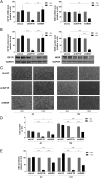
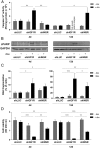
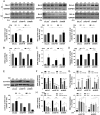
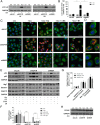
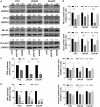
The IGF network with its main receptors IGF receptor 1 (IGF1R) and insulin receptor (INSR) is of major importance for cancer initiation and progression. To date, clinical studies targeting this network were disappointing and call for thorough analysis of the IGF network in cancer models. We highlight the oncogenic effects controlled by IGF1R and INSR in prostate cancer cells and show similarities as well as differences after receptor knockdown (KD). In PC3 prostate cancer cells stably transduced with inducible short hairpin RNAs, targeting IGF1R or INSR attenuated cell growth and proliferation ultimately driving cells into apoptosis. IGF1R KD triggered rapid and strong antiproliferative and proapoptotic responses, whereas these effects were less pronounced and delayed after INSR KD. Down-regulation of the antiapoptotic proteins myeloid cell leukemia-1 and survivin was observed in both KDs, whereas IGF1R KD also attenuated expression of prosurvival proteins B cell lymphoma-2 and B cell lymphoma-xL. Receptor KD induced cell death involved autophagy in particular upon IGF1R KD; however, no difference in mitochondrial energy metabolism was observed. In a mouse xenograft model, induction of IGF1R or INSR KD after tumor establishment eradicated most of the tumors. After 20 days of receptor KD, tumor cells were found only in 1/14 IGF1R and 3/14 INSR KD tumor remnants. Collectively, our data underline the oncogenic functions of IGF1R and INSR in prostate cancer namely growth, proliferation, and survival in vitro as well as in vivo and identify myeloid cell leukemia-1 and survivin as important mediators of inhibitory and apoptotic effects.
Figures

Similar articles
-
Oncogenic functions of IGF1R and INSR in prostate cancer include enhanced tumor growth, cell migration and angiogenesis.Oncotarget. 2014 May 15;5(9):2723-35. doi: 10.18632/oncotarget.1884. Oncotarget. 2014. PMID: 24809298 Free PMC article.
-
Systems Analysis of Insulin and IGF1 Receptors Networks in Breast Cancer Cells Identifies Commonalities and Divergences in Expression Patterns.Front Endocrinol (Lausanne). 2020 Jul 7;11:435. doi: 10.3389/fendo.2020.00435. eCollection 2020. Front Endocrinol (Lausanne). 2020. PMID: 32733384 Free PMC article.
-
Diverse functions of IGF/insulin signaling in malignant and noncancerous prostate cells: proliferation in cancer cells and differentiation in noncancerous cells.Endocrinology. 2012 Oct;153(10):4633-43. doi: 10.1210/en.2012-1348. Epub 2012 Aug 17. Endocrinology. 2012. PMID: 22903612
-
Minireview: nuclear insulin and insulin-like growth factor-1 receptors: a novel paradigm in signal transduction.Endocrinology. 2013 May;154(5):1672-9. doi: 10.1210/en.2012-2165. Epub 2013 Mar 18. Endocrinology. 2013. PMID: 23507573 Review.
-
Targeting the insulin-like growth factor 1 receptor (IGF1R) signaling pathway for cancer therapy.Expert Opin Ther Targets. 2012 Jan;16(1):33-48. doi: 10.1517/14728222.2011.638626. Epub 2012 Jan 12. Expert Opin Ther Targets. 2012. PMID: 22239439 Review.
Cited by
-
Periprostatic adipose tissue promotes prostate cancer resistance to docetaxel by paracrine IGF-1 upregulation of TUBB2B beta-tubulin isoform.Prostate. 2021 May;81(7):407-417. doi: 10.1002/pros.24117. Epub 2021 Mar 18. Prostate. 2021. PMID: 33734457 Free PMC article.
-
Inhibition of Janus Kinase 1 synergizes docetaxel sensitivity in prostate cancer cells.J Cell Mol Med. 2021 Sep;25(17):8187-8200. doi: 10.1111/jcmm.16684. Epub 2021 Jul 28. J Cell Mol Med. 2021. PMID: 34322995 Free PMC article.
-
Diagnostic and therapeutic biomarkers in colorectal cancer: a review.Am J Cancer Res. 2022 Feb 15;12(2):661-680. eCollection 2022. Am J Cancer Res. 2022. PMID: 35261794 Free PMC article. Review.
-
The signaling landscape of insulin-like growth factor 1.J Biol Chem. 2025 Jan;301(1):108047. doi: 10.1016/j.jbc.2024.108047. Epub 2024 Dec 3. J Biol Chem. 2025. PMID: 39638246 Free PMC article. Review.
-
Nanomedicine Approaches for Autophagy Modulation in Cancer Therapy.Small Sci. 2025 Apr 11;5(6):2400607. doi: 10.1002/smsc.202400607. eCollection 2025 Jun. Small Sci. 2025. PMID: 40529859 Free PMC article.
References
-
- Siegel R, Ma J, Zou Z, Jemal A. Cancer statistics, 2014. CA Cancer J Clin. 2014;64:9–29. - PubMed
-
- Aggarwal BB, Shishodia S, Sandur SK, Pandey MK, Sethi G. Inflammation and cancer: how hot is the link? Biochem Pharmacol. 2006;72:1605–1621. - PubMed
-
- Baserga R, Hongo A, Rubini M, Prisco M, Valentinis B. The IGF-I receptor in cell growth, transformation and apoptosis. Biochim Biophys Acta. 1997;1332:F105–F126. - PubMed
Publication types
MeSH terms
Substances
LinkOut - more resources
Full Text Sources
Other Literature Sources
Medical
Miscellaneous

