. 2015 Oct 9;11(10):e1005526.
doi: 10.1371/journal.pgen.1005526. eCollection 2015 Oct.

A Systems Approach Identifies Essential FOXO3 Functions at Key Steps of Terminal Erythropoiesis

Affiliations

A Systems Approach Identifies Essential FOXO3 Functions at Key Steps of Terminal Erythropoiesis

Raymond Liang et al. PLoS Genet. .

Abstract

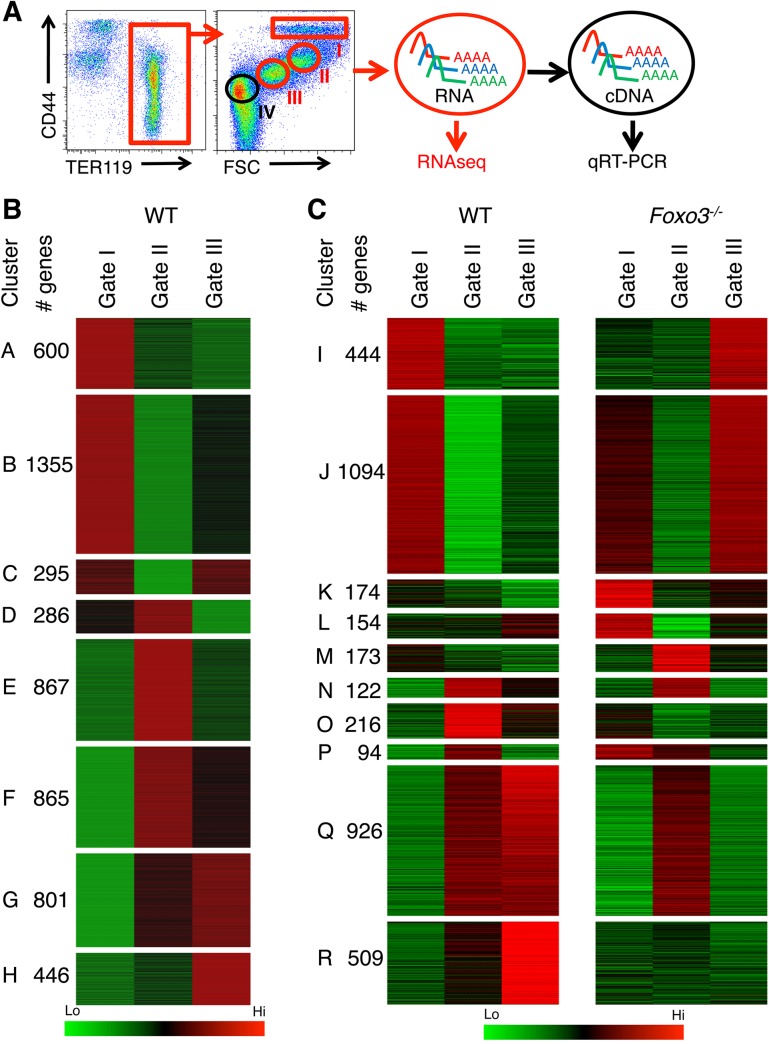
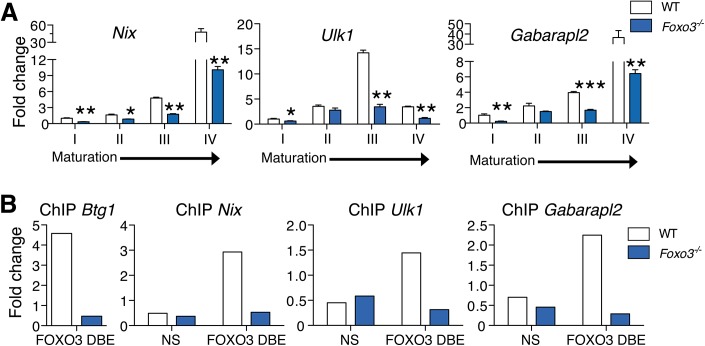
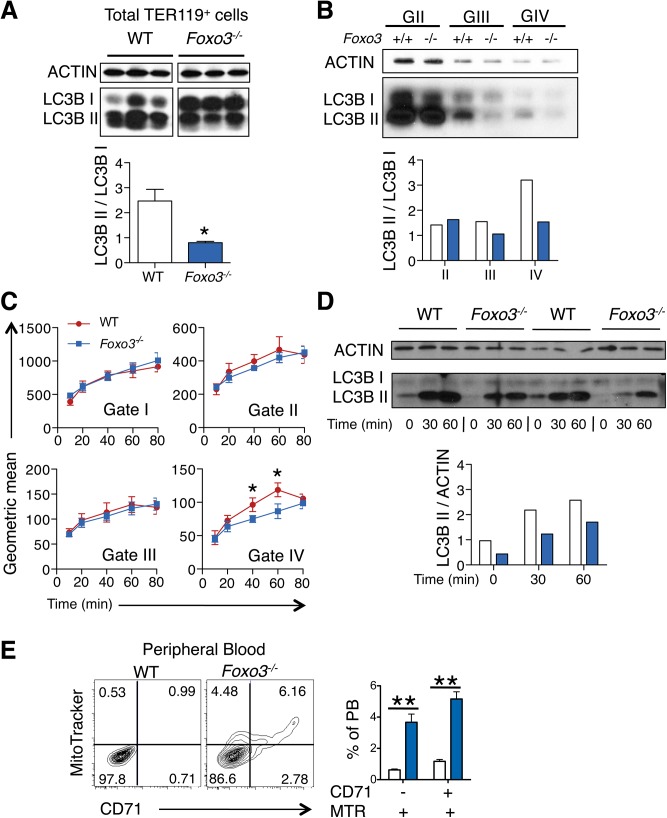
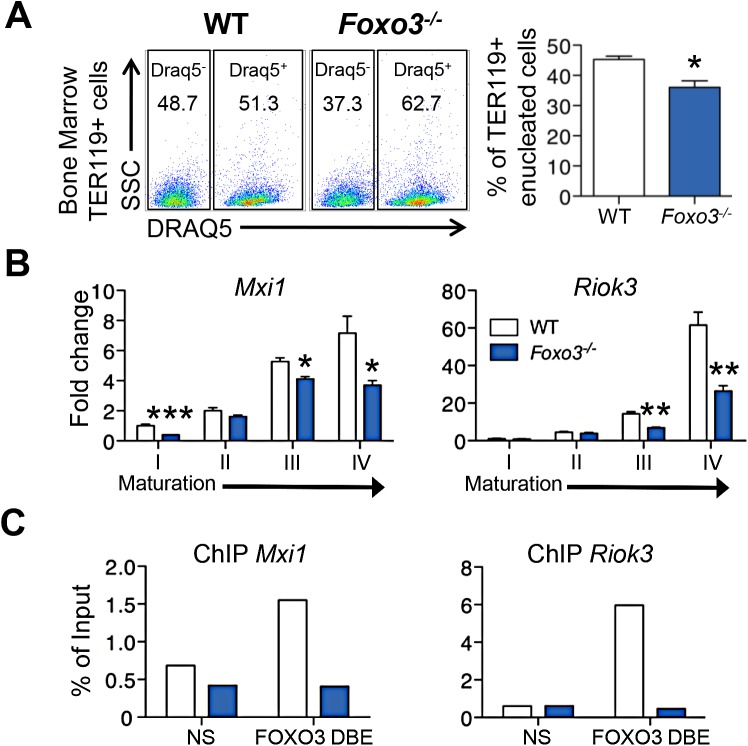
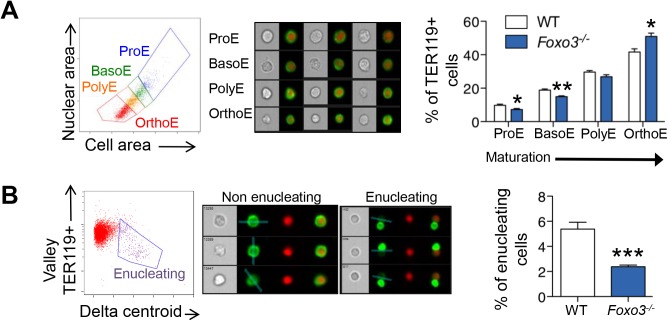
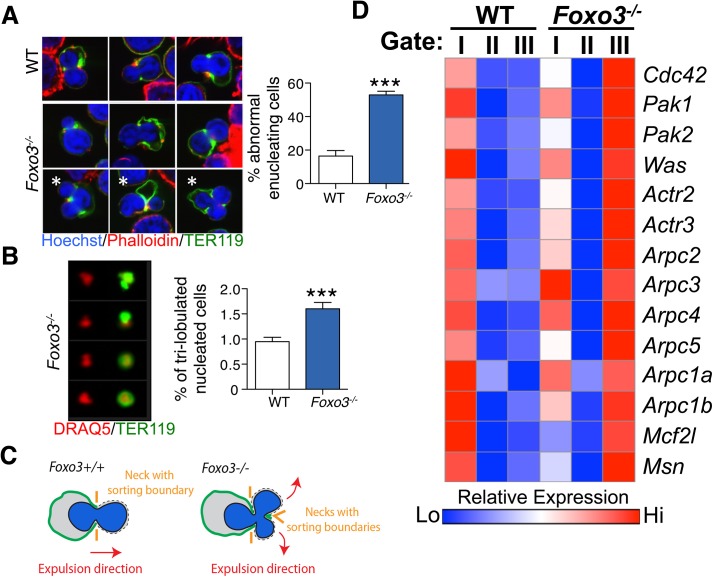
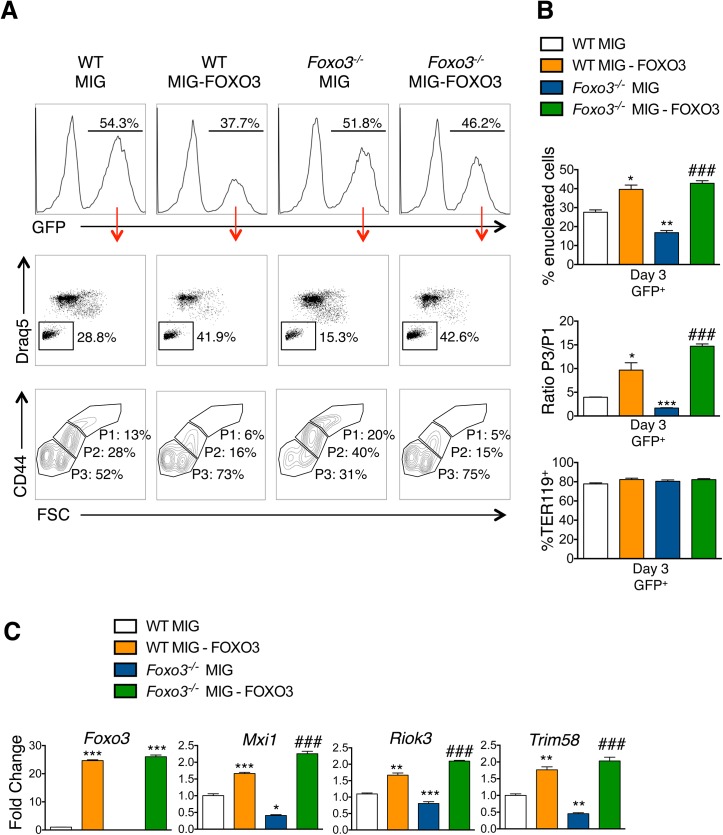
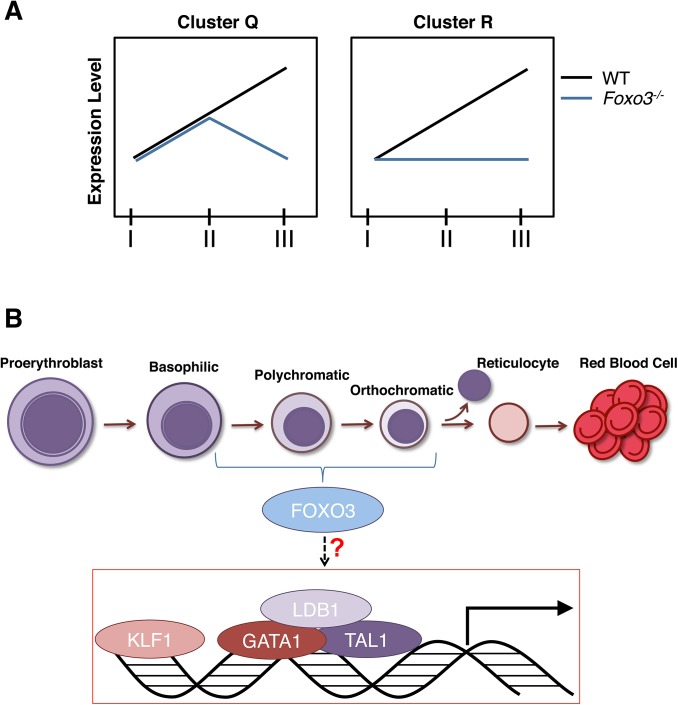
Circulating red blood cells (RBCs) are essential for tissue oxygenation and homeostasis. Defective terminal erythropoiesis contributes to decreased generation of RBCs in many disorders. Specifically, ineffective nuclear expulsion (enucleation) during terminal maturation is an obstacle to therapeutic RBC production in vitro. To obtain mechanistic insights into terminal erythropoiesis we focused on FOXO3, a transcription factor implicated in erythroid disorders. Using an integrated computational and experimental systems biology approach, we show that FOXO3 is essential for the correct temporal gene expression during terminal erythropoiesis. We demonstrate that the FOXO3-dependent genetic network has critical physiological functions at key steps of terminal erythropoiesis including enucleation and mitochondrial clearance processes. FOXO3 loss deregulated transcription of genes implicated in cell polarity, nucleosome assembly and DNA packaging-related processes and compromised erythroid enucleation. Using high-resolution confocal microscopy and imaging flow cytometry we show that cell polarization is impaired leading to multilobulated Foxo3-/- erythroblasts defective in nuclear expulsion. Ectopic FOXO3 expression rescued Foxo3-/- erythroblast enucleation-related gene transcription, enucleation defects and terminal maturation. Remarkably, FOXO3 ectopic expression increased wild type erythroblast maturation and enucleation suggesting that enhancing FOXO3 activity may improve RBCs production. Altogether these studies uncover FOXO3 as a novel regulator of erythroblast enucleation and terminal maturation suggesting FOXO3 modulation might be therapeutic in disorders with defective erythroid maturation.


Conflict of interest statement

The authors have declared that no competing interests exist.

Figures

Fig 1
Fig 1. Deregulated gene expression in maturing Foxo3 -/- erythroblasts.
(A) Flow cytometry strategy used to FACS sort pro-, basophilic and polychromatic erythroblasts (Gates I to III respectively, in red) from wild type and Foxo3 -/- bone marrow according to their TER119 and CD44 cell surface expression and forward scatter properties for RNA-Seq. Gate IV cells (depicted in black) are purified in subsequent experiments for experimental validation purposes. (B) Heatmap of differentially expressed genes in WT erythroblasts (low in green to high in red). Clustering of genes was performed according to their expression level in WT pro-, basophilic and polychromatic erythroblasts. Only the 5514 genes that varied at least 2 fold from pro- to polychromatic erythroblasts were used for clustering. (C) Heatmap of differentially expressed genes in WT versus Foxo3 -/- erythroblasts at each gate (low in green to high in red). Clustering of the 3904 differentially expressed genes between WT and Foxo3 -/- samples (amplitude ≥ 2) is shown. Amplitude was calculated as the difference between the same gates of WT and Foxo3 -/- erythroblasts.
Fig 2
Fig 2. FOXO3 regulates expression of autophagy and mitochondrial removal related genes in erythroblasts.
(A) Fluidigm microfluidic qRT-PCR expression analysis of autophagy genes in WT and Foxo3 -/- Gates I to IV bone marrow erythroblasts. Quantification of target genes is relative to β actin. Results are mean ± SEM of 3 cDNAs, each generated from one mouse. *P < 0.05 **P < 0.01 ***P < 0.001, Student’s t test. (B) FOXO3 binding to Btg1, Nix, Ulk1 and Gabarapl2 regulatory regions as determined by ChIP in total TER119+ cells. Enrichment of putative FOXO3 DNA binding regions in Btg1 (positive control), Nix, Ulk1 and Gabarapl2 promoters was analyzed by qPCR and compared to regions with no known FOXO3 binding sites in wild type versus Foxo3 -/- erythroid cells used as negative controls. Values were normalized to Ct values from total input. One representative of two experiments is shown. NS Not specific; DBE DNA binding element.
Fig 3
Fig 3. Autophagy and mitochondrial removal are impaired in Foxo3 -/- erythroblasts
(A) Western blot analysis of LC3B protein of WT and Foxo3 -/- bone marrow TER119+ cells (n = 3 mice for each genotype). Quantification of the LC3BII/ LC3B-I ratio in one representative of two independent experiments is shown (bottom panel). (B) Western blot analysis of LC3B protein extracted from WT and Foxo3 -/- bone marrow erythroblasts Gates II to IV (insufficient Gate I cell numbers for Western blot). Quantification of the LC3B-II/LC3B-I ratio is shown (panel below). (C) Autophagic flux in WT and Foxo3 -/- bone marrow cells was analyzed by flow cytometry. Cells were cultured with chloroquine (50 μM) for the indicated time points and autophagosomes were detected by Cyto-ID in specific gates according to TER119, CD44 and FSC properties. Flux was calculated by subtracting the value obtained from the untreated sample to the value obtained at each of the different time points. Results are mean ± SEM of n = 3. One representative of three independent experiments is shown. (D) Aliquots of cell lysates from (C) at the indicated time points were subjected to Western blot analysis of LC3B showing two replicates. Quantification of the LC3B-II protein is normalized to total actin, and the relative accumulation of LC3B-II is quantified (bottom panel). (E) Flow cytometry analysis (left panels) and quantification (right panel, n = 4 in each genotype) of Mitotracker Red CMXRos in combination with CD71 surface expression of WT and Foxo3 -/- peripheral blood. *P < 0.05 **P < 0.01 ***P < 0.001, Student’s t test.
Fig 4
Fig 4. Impaired enucleation-related gene transcription in Foxo3 -/- bone marrow erythroblasts.
(A) WT and Foxo3 -/- bone marrow TER119+ erythroblasts were analyzed for DRAQ5 staining by flow cytometry. The percentage of enucleated TER119+ cells is shown (lower panel). Results are mean ± SEM of n = 3; one representative of four different experiments is shown. (B) QRT-PCR expression analysis by Fluidigm microfluidics technology of enucleation-related genes in WT and Foxo3 -/- Gates I to IV bone marrow erythroblasts. Quantification of target genes is normalized to β actin. Results are mean ± SEM of 3 cDNAs. (C) FOXO3 occupation of Mxi1 (left) and Riok3 (right) regulatory regions as determined by ChIP. Enrichment of putative FOXO3 DNA binding regions in Mxi1 and Riok3 promoters was analyzed by qPCR and compared to regions with no known FOXO3 binding sites. Values were normalized to Ct values from total input. One representative of two different experiments is shown. NS Not specific; DBE DNA binding element. *P < 0.05 **P < 0.01 ***P < 0.001, Student’s t test.
Fig 5
Fig 5. Defective Foxo3 -/- terminal erythroblast maturation.
(A) Delineation of erythroblasts by imaging flow analysis based on decreasing cell and nuclear size (left). Images of typical cells (middle panel) in bright-field (gray) and composite image of TER119 (green) and DRAQ5 DNA stain (red). Results are mean ± SEM of n = 4. (B) Gating of enucleating cells from the orthochromatic erythroblasts (in A) based on difference between the center of the nuclear stain and TER119 stain (Delta centroid on X) and a decreasing TER119 signal in the valley mask (highlighted in blue on TER119 image) which goes through the lowest signal point and thus marks the boundary between the reticulocyte and pyrenocyte. Cells with no signal in this mask are eliminated as close doublets. Results are mean ± SEM of n = 4. *P < 0.05 **P < 0.01 ***P < 0.001, Student’s t test.
Fig 6
Fig 6. Defective enucleation in Foxo3 -/- bone marrow erythroblasts.
(A) Enucleation was analyzed by immunofluorescence of freshly isolated bone marrow cells from WT (n = 5) and Foxo3 -/- (n = 3) mice using anti-TER119 antibody (green), Rhodamine Phalloidin (red) and Hoechst (blue). Images were obtained by confocal microscopy and abnormal enucleating cells counted. Representative images of enucleating cells are shown, with white asterisks denoting abnormally enucleating cells. At least 10 enucleating cells were counted per bone marrow and the results indicate the percentage of abnormal enucleating cells in each bone marrow as mean ± SEM. (B) Quantification of abnormal nuclei within the orthochromatic faction of WT and Foxo3 -/- erythroblasts by imaging flow cytometry. Abnormal nuclei were defined as having high 3-fold symmetry of the nucleus [64]. Representative images of normal and abnormal nuclei from Foxo3 mutants are shown are shown. Results are mean ± SEM of n = 4. *P < 0.05 **P < 0.01 ***P < 0.001, Student’s t test. (C) Model for the impact of loss of FOXO3 on the enucleation process. (D) Heatmap of RNA-Seq data of CDC42-related gene cluster (both upstream and downstream of CDC42) implicated in polarity and actin polymerization in Gates I-II and III of Foxo3 wild type and mutant erythroblasts.
Fig 7
Fig 7. Ectopic expression of FOXO3 rescues terminal maturation and enucleation in Foxo3 -/- erythroblasts.
(A) WT and Foxo3 -/- bone marrow erythroid progenitors were expanded and transduced with either the MIG vector overexpressing FOXO3 (MIG-FOXO3) or the MIG vector alone, transferred to erythroid differentiation medium and incubated for additional three days of maturation after which cells were analyzed by flow cytometry. Upper panels show the percentage of transduced cells within each culture condition after maturation. Middle panels show representative FACS plots for each condition indicating the percentage of enucleated cells within transduced (GFP+) cells. Bottom panels show representative FACS plots of maturing erythroblasts. P1 represents the most immature and P3 the most mature erythroid populations. (B) Quantification of enucleation in GFP+ cells shown as mean of percent enucleated ± SEM of n = 3 (Upper panel). Quantification of overall maturation kinetics is based on CD44 and FSC parameters as a ratio between the most mature population (P3) over the least mature population (P1) (middle panel). TER119+ cells (%) is shown (bottom panel). (C) qRT-PCR expression analysis of enucleation-related genes in WT and Foxo3 -/- GFP+ FACS sorted cells after 3 days of maturation. Quantification of genes is normalized to β actin and relative to WT cells transduced with MIG. Results are mean ± SEM of duplicates of 3 cDNAs. *P < 0.05 **P < 0.01 ***P < 0.001 compared to WT MIG, ### P < 0.001 compared to Foxo3 -/- MIG; Students t test.
Fig 8
Fig 8. Model.
(A) Depiction of expression of clusters Q and R genes in Foxo3 -/- versus wild type erythroblasts. Cluster Q is enriched for nucleosome assembly, heme biosynthesis, and DNA packaging-related processes while cluster R is enriched for autophagy and catabolic processes. (B) Model for gene expression in terminally maturing erythroblasts. Complexes of core erythroid transcription factors regulate the genetic programs required for maturation of the initial erythroblast stages. These transcription factor complexes may also induce Foxo3 expression in immature erythroblasts. In turn, FOXO3 cooperates with these factors to sustain and/or enhance the erythroid transcriptional program during the later stages of terminal maturation.

Similar articles

Cited by

References

    1. Lapillonne H, Kobari L, Mazurier C, Tropel P, Giarratana MC, et al. (2010) Red blood cell generation from human induced pluripotent stem cells: perspectives for transfusion medicine. Haematologica 95: 1651–1659. 10.3324/haematol.2010.023556 - DOI - PMC - PubMed
    1. Ji P, Murata-Hori M, Lodish HF (2011) Formation of mammalian erythrocytes: chromatin condensation and enucleation. Trends Cell Biol 21: 409–415. 10.1016/j.tcb.2011.04.003 - DOI - PMC - PubMed
    1. Kerenyi MA, Orkin SH (2010) Networking erythropoiesis. J Exp Med 207: 2537–2541. 10.1084/jem.20102260 - DOI - PMC - PubMed
    1. Kang YA, Sanalkumar R, O'Geen H, Linnemann AK, Chang CJ, et al. (2012) Autophagy driven by a master regulator of hematopoiesis. Mol Cell Biol 32: 226–239. 10.1128/MCB.06166-11 - DOI - PMC - PubMed
    1. McIver SC, Kang YA, DeVilbiss AW, O'Driscoll CA, Ouellette JN, et al. (2014) The exosome complex establishes a barricade to erythroid maturation. Blood 124: 2285–2297. 10.1182/blood-2014-04-571083 - DOI - PMC - PubMed

Publication types

MeSH terms

Substances