. 2015 Nov 10;6(35):37367-84.
doi: 10.18632/oncotarget.5424.

Role of cystathionine beta synthase in lipid metabolism in ovarian cancer

Affiliations

Role of cystathionine beta synthase in lipid metabolism in ovarian cancer

Prabir K Chakraborty et al. Oncotarget. .

Abstract

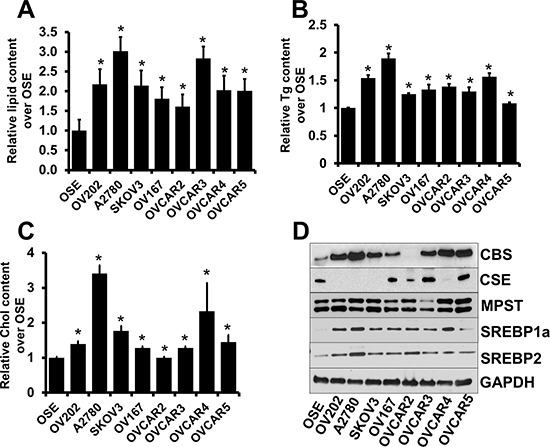
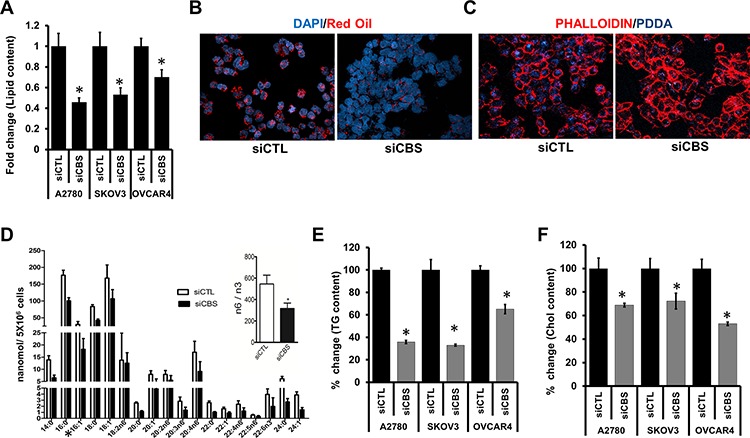
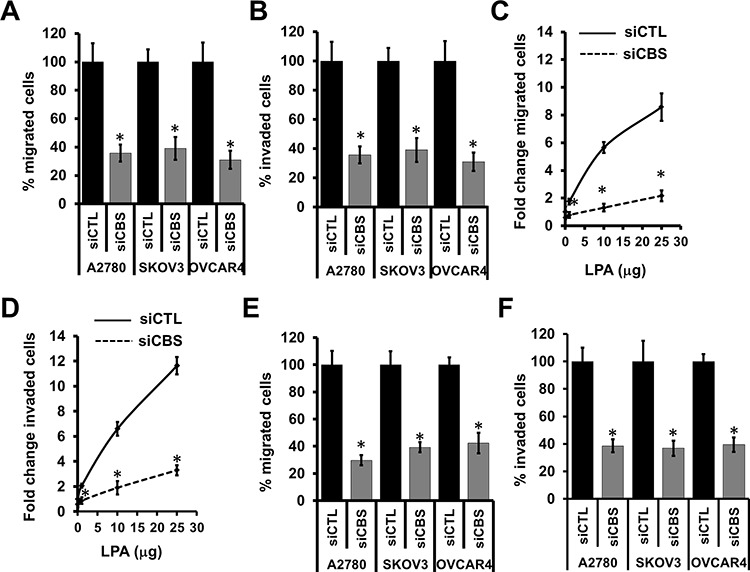
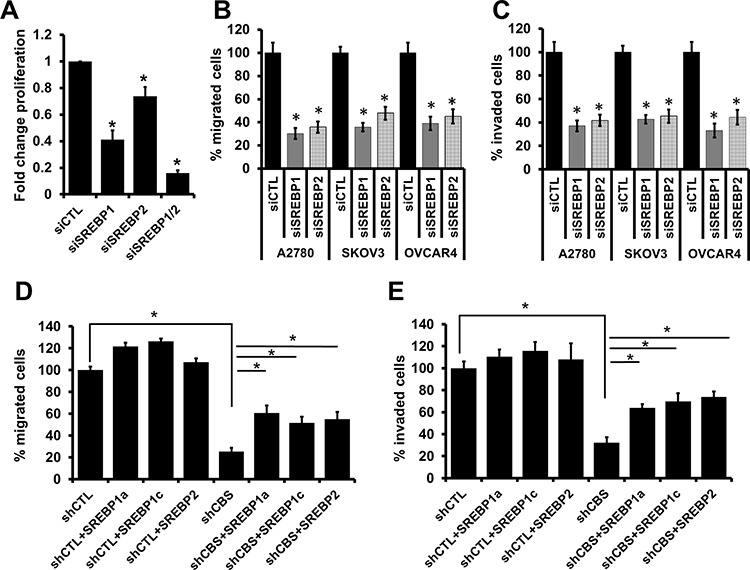
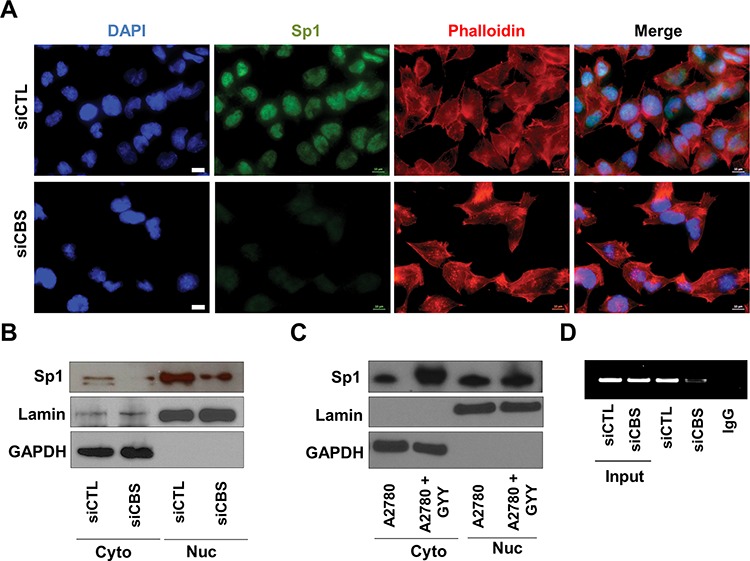
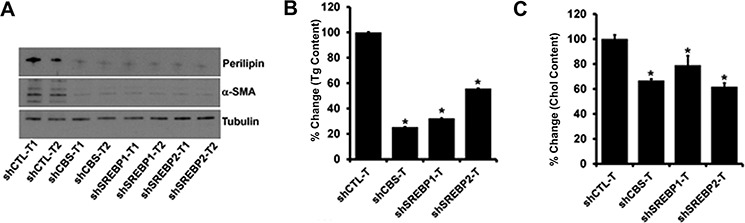
Elevated lipid metabolism is implicated in poor survival in ovarian cancer (OC) and other cancers; however, current lipogenesis-targeting strategies lack cancer cell specificity. Here, we identify a novel role of cystathionine beta-synthase (CBS), a sulphur amino acid metabolizing enzyme highly expressed in several ovarian cancer cell lines, in driving deregulated lipid metabolism in OC. We examined the role of CBS in regulation of triglycerides, cholesterol and lipogenic enzymes via the lipogenic transcription factors SREBP1 and SREBP2. CBS silencing attenuated the expression of number of key enzymes involved in lipid synthesis (FASN and ACC1). Additionally CBS abrogates lipid uptake in OC cells. Gene silencing of CBS or SREBPs abrogated cellular migration and invasion in OC, while ectopic expression of SREBPs can rescue phenotypic effects of CBS silencing by restoring cell migration and invasion. Mechanistically, CBS represses SREBP1 and SREBP2 at the transcription levels by modulating the transcription factor Sp1. We further established the roles of both CBS and SREBPs in regulating ovarian tumor growth in vivo. In orthotopic tumor models, CBS or SREBP silencing resulted in reduced tumor cells proliferation, blood vessels formation and lipid content. Hence, cancer-selective disruption of the lipid metabolism pathway is possible by targeting CBS and, at least for OC, promises a profound benefit.

Keywords: CBS; SREBP; lipid metabolism; ovarian cancer.


Conflict of interest statement

CONFLICTS OF INTEREST

No potential conflicts of interest.

Figures

Figure 1
Figure 1. Aberrant lipid content in ovarian cancer cells
A. Comparison of fold differences in lipid droplet content by Oil O Red staining between OSE and a panel of ovarian cancer cell lines per 30,000 cells. Values are means ± SD. N = 3. B. Comparison of fold differences of total triglyceride (Tg) content between OSE and a panel of ovarian cancer cell lines, as determined using Triglyceride Colorimetric Assay Kit (Cayman). Values are means ± SD. N = 3. C. Comparison of fold differences of total cholesterol (Chol) content between OSE and a panel of ovarian cancer cell lines, as determined using Cholesterol Fluorometric Assay Kit (Cayman). Values are means ± SD. N = 3. D. Expression of CBS, CSE, MPST, SREBP1a and SREBP2 in various ovarian cell lines as determined by immunoblotting. GAPDH is used as the loading control. For A–C, *P < 0.05 versus corresponding control.
Figure 2
Figure 2. CBS affects lipid content and uptake in ovarian cancer cells
A. Effect of CBS silencing (72 h post-transfection) on lipid droplet level in three different ovarian cancer cell line (A2780, SKOV3 and OVCAR4) determined by Oil O Red staining and absorbance quantified by spectrophotometer. Values are means ± SD. N = 3. B. Representative micrograph captured by confocal microscopy of siCTL- and siCBS- A2780 cells showing lipid droplets stained with Oil O Red. C. Effect of CBS silencing (72 h post-transfection) on lipid uptake. Representative micrograph of siCTL- and siCBS- A2780 cells showing fluorescent lipid (PDDA) uptake as captured by confocal microscopy. The cells are counter stained with Alexa Fluor 568-Phalloidin (red). D. Change in fatty acid levels in the cell lysates of scrambled siRNA (siCTL) and CBS siRNA (siCBS) treated A2780 cells measured by TLC/GC-FID. Ratiometric analysis of change in total fatty acid (n6/n3) in siCTL and siCBS cells (Inset). Values are means ± SD. N = 3. E. Effect of CBS silencing (72 h post-transfection) on the total triglyceride content of three cell lines (A2780, SKOV3 and OVCAR4). Comparison of fold differences of total triglyceride (Tg) content between siCTL and siCBS cancer cell lines. Values are means ± SD. N = 3. F. Effect of CBS silencing (72 h post-transfection) on the total cholesterol content of three cell lines (A2780, SKOV3 and OVCAR4). Comparison of fold differences of total cholesterol (Chol) content between siCTL and siCBS cancer cell lines. Values are means ± SD. N = 3. For A and D–F, *P < 0.05 versus corresponding control.
Figure 3
Figure 3. CBS regulates migration and invasion of ovarian cancer cells
A. Silencing of CBS inhibits cell migration in ovarian cancer cells (A2780, SKOV3 and OVCAR4). Migration of siCTL and siCBS cells was examined using Boyden chamber. Cells were fixed and stained with crystal violet and counted under microscope. Percentage change values are means ± SD. N = 3. B. Silencing of CBS inhibits cell invasion of fibronectin matrix by ovarian cancer cells (A2780, SKOV3 and OVCAR4). Invasion of siCTL and siCBS cells through fibronectin-coated filters was examined using Boyden chamber. Cells were fixed and stained with crystal violet and counted under microscope. Percentage change values are means ± SD. N = 3. C. Silencing of CBS inhibits cell migration towards lipid (LPA) rich gradient. Migration of siCTL- and siCBS- A2780 cells towards increasing concentrations of LPA was examined using Boyden chamber. Cells were fixed and stained with crystal violet and counted under microscope. Percentage change values are means ± SD. N = 3. D. Silencing of CBS inhibits cell invasion of fibronectin matrix towards lipid (LPA) rich gradient. Invasion of siCTL- and siCBS- A2780 cells through fibronectin-coated filters towards increasing concentrations of LPA was examined using Boyden chamber. Cells were fixed and stained with crystal violet and counted under microscope. Percentage change values are means ± SD. N = 3. E. CBS silencing prevents the migration of ovarian cancer cells (A2780, SKOV3 and OVCAR4) towards LPA. Migration of siCTL and siCBS cells was examined using Boyden chamber. Cells were fixed and stained with crystal violet and counted under microscope. Percentage change values are means ± SD. N = 3. F. CBS silencing prevents the invasion of ovarian cancer cells (A2780, SKOV3 and OVCAR4) towards LPA. Invasion of siCTL and siCBS cells through fibronectin-coated filters towards increasing concentrations of LPA was examined using Boyden chamber. Cells were fixed and stained with crystal violet and counted under microscope. Percentage change values are means ± SD. N = 3. For A-F, *P < 0.05 versus corresponding control.
Figure 4
Figure 4. CBS silencing reduces expression of lipogenic genes and SREBPs in ovarian cancer cells
A. Expression profile (qRT-PCR) of fatty acid and triglyceride biosynthesis genes in ovarian cancer cell lines (A2780, SKOV3 and OVCAR4) post CBS silencing, relative to cells transfected with, relative to cells with siCTL. B. Western blot analysis of the CBS and SREBP proteins in siCTL cells or cells with silencing of CBS (siCBS). GAPDH is used as the loading control. C. CBS silencing prevents nuclear translocation of SREBP. The fixed siCTL- and siCBS- A2780 cells were stained using Anti-SREBP antibody (1:100) followed by Alexa Fluor 488-conjugated secondary antibody. Then the localization of SREBP was visualized by confocal microscopy. D. Immunoblot for SREBP showing recovered expression in CBS silenced cells upon GYY4137 treatment (1 mM, 24 h). GAPDH is used as the loading control. For A, *P < 0.05 versus corresponding control.
Figure 5
Figure 5. SREBPs regulate ovarian cancer cell proliferation, migration and invasion
A. Effect of gene silencing of SREBP1, SREBP2 or both on A2780 cell proliferation. Fold change proliferation values are means ± SD. N = 3. B. Silencing of SREBP1 and SREBP2 inhibits cell migration in ovarian cancer cells (A2780, SKOV3 and OVCAR4). Migration of siCTL and siCBS cells was examined using Boyden chamber. Cells were fixed and stained with crystal violet and counted under microscope. Percentage change values are means ± SD. N = 3. C. Silencing of SREBP1 and SREBP2 inhibits cell invasion of fibronectin matrix by ovarian cancer cells (A2780, SKOV3 and OVCAR4). Invasion of siCTL and siCBS cells through fibronectin-coated filters was examined using Boyden chamber. Cells were fixed and stained with crystal violet and counted under microscope. Percentage change values are means ± SD. N = 3. D. Overexpression of SREBP1 or SREBP2 can restore migration phenotype in CBS silenced cells. Transient transfection of Flag tagged -SREBP1a, -SREBP1c and -SREBP2 induces cell migration in CBS knockdown A2780 cells (shCBS). Migration of cells was examined using Boyden chamber. Cells were fixed and stained with crystal violet and counted under microscope. Percentage change values are means ± SD. N = 3. E. Overexpression of SREBP1 or SREBP2 can restore invasive properties in CBS silenced cells. Transient transfection of Flag tagged -SREBP1a, -SREBP1c and -SREBP2 induces cell invasion through fibronectin-coated filters in CBS knockdown A2780 cells (shCBS). Invasion of cells was examined using Boyden chamber. Cells were fixed and stained with crystal violet and counted under microscope. Percentage change values are means ± SD. N = 3. For A-F, *P < 0.05 versus corresponding control.
Figure 6
Figure 6. Regulation of SREBPs by CBS
A. CBS silencing prevents nuclear translocation of Sp1. The fixed siCTL- and siCBS- A2780 cells were stained using Anti-Sp1 antibody (1:500) followed by Alexa Fluor 488-conjugated secondary antibody and Alexa Fluor 568-Phalloidin incubation. Then the localization of Sp1 was visualized by immunofluorescence. B. Immunoblotting data exemplifying the effect of CBS silencing on the translocation of Sp1 in A2780 cells. Lamin and GAPDH were used for loading controls for nuclear and cytosolic fractions respectively. C. Immunoblotting data exemplifying the effect of GYY4137 on the translocation of Sp1 in A2780 cells. Lamin and GAPDH were used for loading controls for nuclear and cytosolic fractions respectively. D. ChIP assay reveals CBS silencing abrogates Sp1 binding on the promoter of SREBP.
Figure 7
Figure 7. Effect of CBS and SREBPs knockdown on orthotopic ovarian cancer growth
A. Knockdown of CBS, SREBP1 and SREBP2 inhibits tumor growth. The shCTL-, shCBS-, shSREBP1 and shSREBP2-A2780 cells (1.5 × 10⁶) were orthotopically implanted in both the ovaries of athymic nude mice. Animals were sacrificed 3 weeks after implantation and ovaries were removed, weighed, measured and photographed. Scatter plot shows the tumor weights from individual animals in each group. B. Knockdown of CBS, SREBP1 and SREBP2 decreases tumor volume. C. Representative histology of tumors from mice xenografts of A2780-shCTL, -shCBS, -shSREBP1 and shSREBP2 cells with Ki67. D. Quantification of Ki67 staining shows a notable reduction in tumors from shCBS, -shSREBP1 and -shSREBP2 compared to the shCTL group. E. Representative histology of tumors from mice xenografts of A2780-shCTL, -shCBS, -shSREBP1 and -shSREBP2 cells with CD31. F. Quantification of CD31 staining analysis showed a remarkable reduction in vessel formation in tumors from shCBS, shSREBP1 and shSREBP2 compared to the shCTL group. Each group contains 9~10 mice. For A, B, D and F *P < 0.05 versus corresponding control.
Figure 8
Figure 8. A. Immunoblot analysis of a-SMA and Perilipin in protein lysates isolated from tumors
B. Effect of CBS, SREBP1 and SREBP2 knockdown on the total triglyceride content of tumors. Comparison of fold differences of total triglyceride (Tg) content between shCTL and shCBS, shSREBP1 and shSREBP2 tumors. Values are means ± SD. N = 2. C. Effect of CBS, SREBP1 and SREBP2 knockdown on the total Cholesterol content of tumors. Comparison of fold differences of total triglyceride (Tg) content between shCTL and shCBS, shSREBP1 and shSREBP2 tumors. Values are means ± SD. N = 2. For B and C *P < 0.05 versus corresponding control.

Similar articles

Cited by

References

    1. Siegel RL, Miller KD, Jemal A. Vol. 65. CA: a cancer journal for clinicians; 2015. Cancer statistics 2015; pp. 5–29. - PubMed
    1. Pinato DJ, Graham J, Gabra H, Sharma R. Evolving concepts in the management of drug resistant ovarian cancer: dose dense chemotherapy and the reversal of clinical platinum resistance. Cancer treatment reviews. 2013;39:153–160. - PubMed
    1. Agarwal R, Kaye SB. Ovarian cancer: strategies for overcoming resistance to chemotherapy. Nature reviews Cancer. 2003;3:502–516. - PubMed
    1. Diamandis EP. Cancer biomarkers: can we turn recent failures into success? Journal of the National Cancer Institute. 2010;102:1462–1467. - PMC - PubMed
    1. Kim YW, Bae SM, Lim H, Kim YJ, Ahn WS. Development of Multiplexed Bead-Based Immunoassays for the Detection of Early Stage Ovarian Cancer Using a Combination of Serum Biomarkers. PloS one. 2012;7:e44960. - PMC - PubMed

Publication types

MeSH terms