. 2016 Jan;33(1):162-73.
doi: 10.1093/molbev/msv208. Epub 2015 Oct 8.

Parallelism and Epistasis in Skeletal Evolution Identified through Use of Phylogenomic Mapping Strategies

Affiliations

Parallelism and Epistasis in Skeletal Evolution Identified through Use of Phylogenomic Mapping Strategies

Jacob M Daane et al. Mol Biol Evol. 2016 Jan.

Abstract

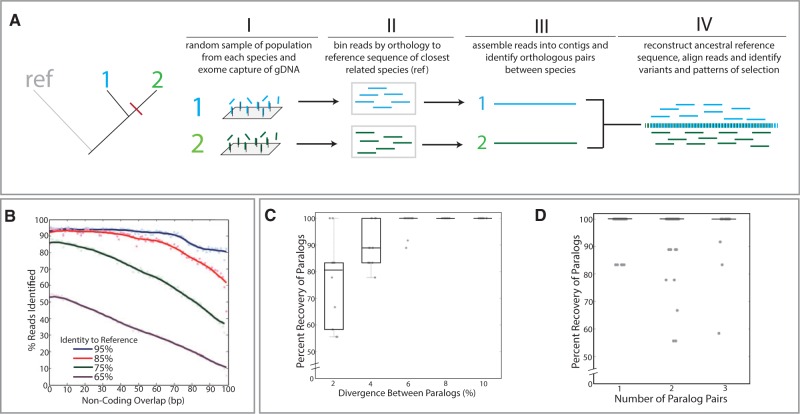
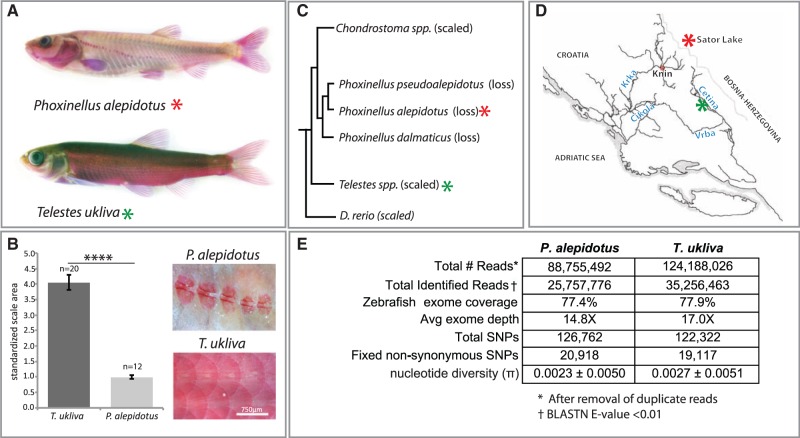
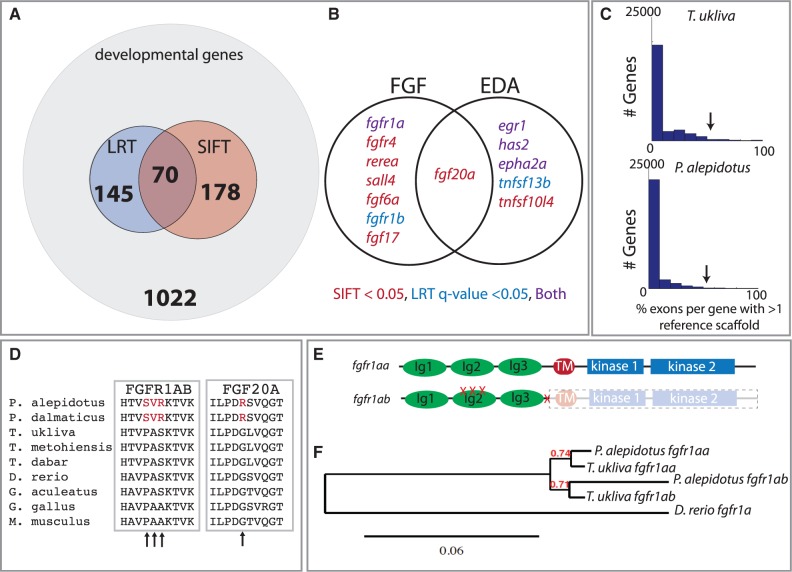
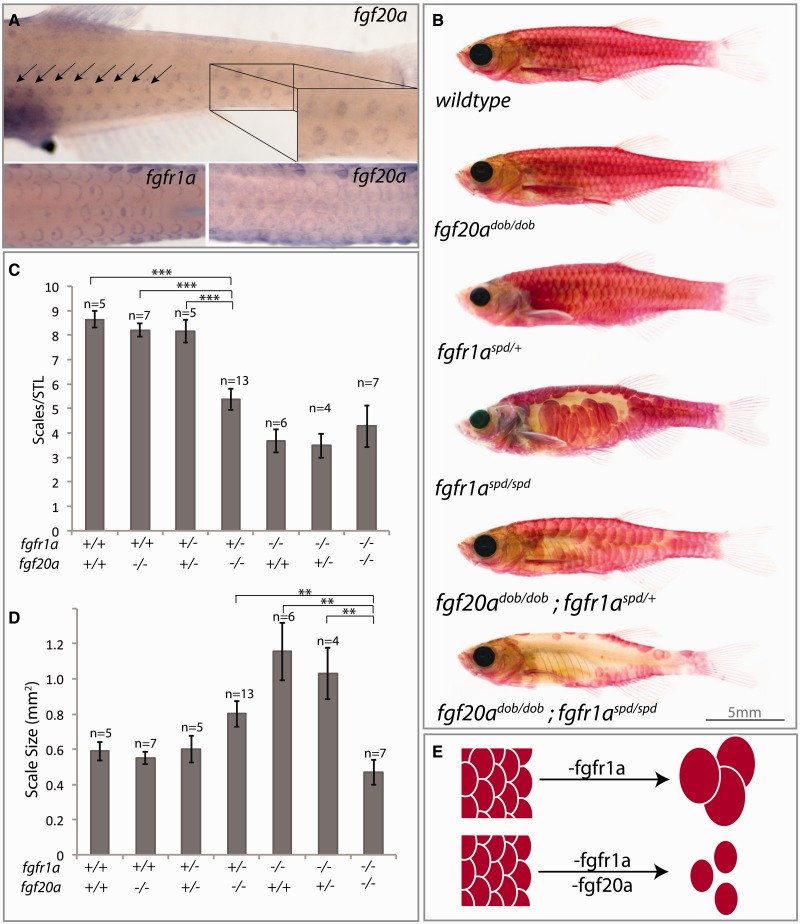
The identification of genetic mechanisms underlying evolutionary change is critical to our understanding of natural diversity, but is presently limited by the lack of genetic and genomic resources for most species. Here, we present a new comparative genomic approach that can be applied to a broad taxonomic sampling of nonmodel species to investigate the genetic basis of evolutionary change. Using our analysis pipeline, we show that duplication and divergence of fgfr1a is correlated with the reduction of scales within fishes of the genus Phoxinellus. As a parallel genetic mechanism is observed in scale-reduction within independent lineages of cypriniforms, our finding exposes significant developmental constraint guiding morphological evolution. In addition, we identified fixed variation in fgf20a within Phoxinellus and demonstrated that combinatorial loss-of-function of fgfr1a and fgf20a within zebrafish phenocopies the evolved scalation pattern. Together, these findings reveal epistatic interactions between fgfr1a and fgf20a as a developmental mechanism regulating skeletal variation among fishes.

Keywords: comparative genomics; epistasis; fgf signaling; nonmodel organisms; parallelism; zebrafish.


Figures

F<sc>ig</sc>. 1.
Fig. 1.
Phylomapping approach for analysis of character change in species lacking prior genetic resources. (A) Overview of approach. In this example, there are two species, “1” and “2,” with a common outgroup, “ref,” that has existing genetic resources from which to design the targeted capture array (I) and guide identification of reads (II). Reads are binned by orthology and assembled into contigs (III). Pairwise analysis between orthologous contigs enables reconstruction of a shared ancestral sequence that is then used to align and compare sequence variance (IV). (B–D) Test limits of approach through simulated assembly and annotation of reads from divergent genomes. (B) In silico 100-bp reads were generated at varying levels of divergence from the zebrafish reference genome and put into the phylomapping pipeline, utilizing the zebrafish reference genome to scaffold the analysis. Alignment and identification of reads from varying levels of divergence relative to the reference genome showing read recovery with high levels of variation and extending into noncoding sequence flanking the exons. Lines represent kernel regression. Simulated reconstruction of paralogs from mixed read data (supplementary fig. S1, Supplementary Material online) as a function of the divergence between paralogous sequences (C) and the number of paralogs present within the mixed read pools (D). Each dot represents an individual simulation.
F<sc>ig</sc>. 2.
Fig. 2.
Comparative genomic analysis of scale reduction in natural populations. (A) Alizarin red stain of Phoxinellus alepidotus and Telestes ukliva highlighting loss of scales within Phoxinellus. (B) Average scale area relative to fish standard length. Data from three individuals of each species, with a total of n = 20 scales in T. ukliva and n = 12 scales in P. alepidotus. ****Two-tailed t-test P value < 0.0001. Error bars represent ±SEM. (C) Phylogenetic relationship between Phoxinellus and Telestes, with Danio rerio as the referenced outgroup used for analysis. Modified from (Perea et al. 2010) with addition of D. rerio. (D) Collection sites of P. alepidotus (red asterisk) and T. ukliva (green asterisk) used in this study. (E) Exome sequencing statistics from cross-species exome capture using zebrafish-targeted capture array. Single-end 100-bp Illumina HiSeq2000 reads were assembled using the Phylomapping pipeline.
F<sc>ig</sc>. 3.
Fig. 3.
Selection on an FGF ligand-receptor pair within Phoxinellus underlying scale reduction. (A) Analysis of a subset of developmental genes as defined by select gene ontology terms (supplementary table S1, Supplementary Material online) with exons showing signatures of nonsense or deleterious SNPs (SIFT) and accelerated sequence evolution relative to neutral drift (LRT) (supplementary table S1, Supplementary Material online). (B) Genes within the EDA and FGF signaling pathways showing either LRT q value < 0.05 or SIFT < 0.05 (supplementary table S1, Supplementary Material online). (C) Histogram of the percentage of exons per gene showing a signature of duplication (supplementary table S3, Supplementary Material online); arrow indicates location of fgfr1a. (D) Multiple protein alignment of Fgfr1ab and Fgf20a. Arrows indicate amino acid changes within the Phoxinellus genus. (E) Location of Phoxinellus fgfr1ab nonsynonymous mutations and premature truncation mapped onto Fgfr1a protein (supplementary fig. S2, Supplementary Material online). (F) Reconstructed gene tree from cDNA of fgfr1aa and fgfr1ab transcripts isolated from Phoxinellus alepidotus skin and Telestes ukliva exome sequencing data.
F<sc>ig</sc>. 4.
Fig. 4.
Epistatic interaction between Fgf20a and Fgfr1a regulates scale development and is sufficient to phenocopy Phoxinellus scale reduced phenotype. (A) Expression of fgfr1a and fgf20a by whole-mount in situ hybridization in 30-day-old zebrafish. (B) Representative alizarin red-stained zebrafish with loss-of-function mutations in fgf20a (dob) and/or fgfr1a (spd). (C) Average number of scales on lateral flank normalized to the standard length of each fish. ***P value < 0.001. (D) Average area of scales (mm2) in different genetic backgrounds. **P value < 0.01. Error bars represent ±SEM. (E) Model of epistatic interaction between fgfr1a and fgf20a regulating scale number and size.
F<sc>ig</sc>. 5.
Fig. 5.
Coordinated changes in Phoxinellus alepidotus point to multifactorial role of Fgfr1 signaling in trait evolution. (A) Proportion of genes within individual GO-terms with LRT q value < 0.05. Each dot represents a GO-term with a minimum of 20 genes. Mean represented by black line. Red-dashed lines represent ± 2 SD from the mean. (B) Enrichment for genes showing signature of accelerated sequence evolution relative to neutral drift (LRT q value < 0.05) within aggregate gene ontologies (supplementary table S4, Supplementary Material online).

References

    1. Altschul S, Gish W, Miller W. 1990. Basic Local Alignment Search Tool. J Mol Biol. 215:403–410. - PubMed
    1. Andersson LS, Larhammar M, Memic F, Wootz H, Schwochow D, Rubin C-J, Patra K, Arnason T, Wellbring L, Hjälm G, et al. 2012. Mutations in DMRT3 affect locomotion in horses and spinal circuit function in mice. Nature 488:642–646. - PMC - PubMed
    1. Baldwin MW, Toda Y, Nakagita T, O’Connell MJ, Klasing KC, Misaka T, Edwards SV, Liberles SD. 2014. Evolution of sweet taste perception in hummingbirds by transformation of the ancestral umami receptor. Science 345:929–933. - PMC - PubMed
    1. Barrett RDH, Rogers SM, Schluter D. 2008. Natural selection on a major armor gene in threespine stickleback. Science 322:255–257. - PubMed
    1. Bell MA, Orti G, Walker JA, Koenings JP. 1993. Evolution of pelvic reduction in threespine stickleback fish: a test of competing hypotheses. Evolution 47:906–914. - PubMed

Publication types