. 2016 Mar;75(3):511-8.
doi: 10.1136/annrheumdis-2015-207315. Epub 2015 Oct 9.

Assessment of disease activity in patients with rheumatoid arthritis using optical spectral transmission measurements, a non-invasive imaging technique

Affiliations

Assessment of disease activity in patients with rheumatoid arthritis using optical spectral transmission measurements, a non-invasive imaging technique

M van Onna et al. Ann Rheum Dis. 2016 Mar.

Abstract

Objectives: In rheumatoid arthritis (RA), treat-to-target strategies require instruments for valid detection of joint inflammation. Therefore, imaging modalities are increasingly used in clinical practice. Optical spectral transmission (OST) measurements are non-invasive and fast and may therefore have benefits over existing imaging modalities. We tested whether OST could measure disease activity validly in patients with RA.

Methods: In 59 patients with RA and 10 patients with arthralgia, OST, joint counts, Disease Activity Score (DAS) 28 and ultrasonography (US) were performed. Additionally, MRI was performed in patients with DAS28<2.6. We developed and validated within the same cohort an algorithm for detection of joint inflammation by OST with US as reference.

Results: At the joint level, OST and US performed similarly inproximal interphalangeal-joints (area under the receiver-operating curve (AUC) of 0.79, p<0.0001) andmetacarpophalangeal joints (AUC 0.78, p<0.0001). Performance was less similar in wrists (AUC 0.62, p=0.006). On the patient level, OST correlated moderately with clinical examination (DAS28 r=0.42, p=0.001), and US scores (r=0.64, p<0.0001). Furthermore, in patients with subclinical and low disease activity, there was a correlation between OST and MRI synovitis score (RAMRIS (Rheumatoid Arthritis MRI Scoring) synovitis), r=0.52, p=0.005.

Conclusions: In this pilot study, OST performed moderately in the detection of joint inflammation in patients with RA. Further studies are needed to determine the diagnostic performance in a new cohort of patients with RA.

Keywords: Disease Activity; Magnetic Resonance Imaging; Rheumatoid Arthritis; Synovitis; Ultrasonography.


Figures

Figure 1
Figure 1
Subclinical inflammation in a patient with rheumatoid arthritis in clinical remission. Representative images of a patient without clinically detectable arthritis. All imaging techniques show synovitis of both wrists and metacarpophalangeal (MCP)3 of the right hand. Both hands with (A) Full Hand Proto, (B) grey-scale and power Doppler ultrasonography of joints of left (a) and right wrist (b) and left and right MCP3 (c and d) (C) MRI of right wrist T2 short-tau inversion recovery (STIR) (a) and MCP joints of the right MCP (b, T1 with gadolinium enhancement).
Figure 2
Figure 2
Patient level: relationship between optical spectral transmission (OST) and clinical examination, ultrasonography (US) and MRI. (A) Correlation between OST and clinical examination (DAS28, swollen joint count of 28 joints and tender joint count of 28 joints). (B) Correlation between OST and US, upper three panels with count of number of joints with grey-scale US (GSUS) synovitis (left panel), count of number of joints with power Doppler US (PDUS) synovitis (middle panel) and count of joints with inflammation with US (right panel). US inflammation was defined as (GSUS synovitis >1 or PDUS synovitis >0 and/or GSUS/PDUS tenosynovitis >0). Lower three panels show correlation of OST with joint indexes (sum of semi-quantitative US scores) of GSUS synovitis (left panel), PDUS synovitis (middle panel) and US inflammation (right panel). (C) Correlation between OST and MRI. Rheumatoid Arthritis MRI Scoring (RAMRIS) (left panel) and its components (RAMRIS synovitis (middle panel) and RAMRIS bone marrow oedema (right panel)).
Figure 2
Figure 2
Patient level: relationship between optical spectral transmission (OST) and clinical examination, ultrasonography (US) and MRI. (A) Correlation between OST and clinical examination (DAS28, swollen joint count of 28 joints and tender joint count of 28 joints). (B) Correlation between OST and US, upper three panels with count of number of joints with grey-scale US (GSUS) synovitis (left panel), count of number of joints with power Doppler US (PDUS) synovitis (middle panel) and count of joints with inflammation with US (right panel). US inflammation was defined as (GSUS synovitis >1 or PDUS synovitis >0 and/or GSUS/PDUS tenosynovitis >0). Lower three panels show correlation of OST with joint indexes (sum of semi-quantitative US scores) of GSUS synovitis (left panel), PDUS synovitis (middle panel) and US inflammation (right panel). (C) Correlation between OST and MRI. Rheumatoid Arthritis MRI Scoring (RAMRIS) (left panel) and its components (RAMRIS synovitis (middle panel) and RAMRIS bone marrow oedema (right panel)).
Figure 3
Figure 3
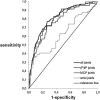
Area under the curve (AUC) between optical spectral transmission (OST) and ultrasonography (US) at the joint level. Area under ROC of the OST in all joints (AUC 0.81, 0.77 to 0.84, p<0.0001), (P)IP joints (AUC 0.79, 0.72 to 0.86, p<0.0001), metacarpophalangeal (MCP) joints (AUC 0.78, 0.71 to 0.83, p<0.0001) and wrists (0.62, 0.52 to 0.72, p=0.018) (US as reference).
Figure 4
Figure 4
Example of diagnostic performance of optical spectral transmission (OST) versus ultrasonography (US) and clinical examination at a chosen cut-off. Since OST generates quantitative results, values for sensitivity and specificity of OST depend on the chosen cut-off value. The values for inflammation as defined by OST with maximum sensitivity and specificity were 0.26 for the metacarpophalangeal (MCP) joints (sensitivity of 70%, specificity of 74%), 0.11 for the proximal interphalangeal ((P)IP) joints (sensitivity of 83%, specificity of 64%) and 1.0 for the wrists (sensitivity of 39%, specificity of 87%). This figure shows the number of correctly classified joints with and without inflammation (US as reference) by OST (using the above-mentioned cut-off values) as the overlapping parts of the red and the blue circles per joint type. Similarly, the number of correctly classified joints by clinical examination (swollen joints) are shown as the overlapping parts of the blue and the green circles. Numbers denote the number of patients in a category.

References

    1. Schoels M, Knevel R, Aletaha D, et al. . Evidence for treating rheumatoid arthritis to target: results of a systematic literature search. Ann Rheum Dis 2010;69:638–43. 10.1136/ard.2009.123976 - DOI - PMC - PubMed
    1. Uhlig T, Kvien TK, Pincus T. Test-retest reliability of disease activity core set measures and indices in rheumatoid arthritis. Ann Rheum Dis 2009;68:972–5. 10.1136/ard.2008.097345 - DOI - PubMed
    1. van Gestel AM, Prevoo ML, van ‘t Hof MA, et al. . Development and validation of the European League Against Rheumatism response criteria for rheumatoid arthritis. Comparison with the preliminary American College of Rheumatology and the World Health Organization/International League Against Rheumatism Criteria. Arthritis Rheum 1996;39:34–40. 10.1002/art.1780390105 - DOI - PubMed
    1. Ton E, Bakker MF, Verstappen SM, et al. . Look beyond the disease activity score of 28 joints (DAS28): tender points influence the DAS28 in patients with rheumatoid arthritis. J Rheumatol 2012;39:22–7. 10.3899/jrheum.110072 - DOI - PubMed
    1. Jacobs JW, Ten Cate DF, van Laar JM. Monitoring of rheumatoid arthritis disease activity in individual patients: still a hurdle when implementing the treat-to-target principle in daily clinical practice. Rheumatology (Oxford) 2015;54:959–61. 10.1093/rheumatology/keu334 - DOI - PubMed

Publication types