

Longitudinal analysis reveals characteristically high proportions of bacterial vaginosis-associated bacteria and temporal variability of vaginal microbiota in northern pig-tailed macaques (Macaca leonina)
- PMID: 26452693
- PMCID: PMC4771959
- DOI: 10.13918/j.issn.2095-8137.2015.5.285
Longitudinal analysis reveals characteristically high proportions of bacterial vaginosis-associated bacteria and temporal variability of vaginal microbiota in northern pig-tailed macaques (Macaca leonina)
Abstract
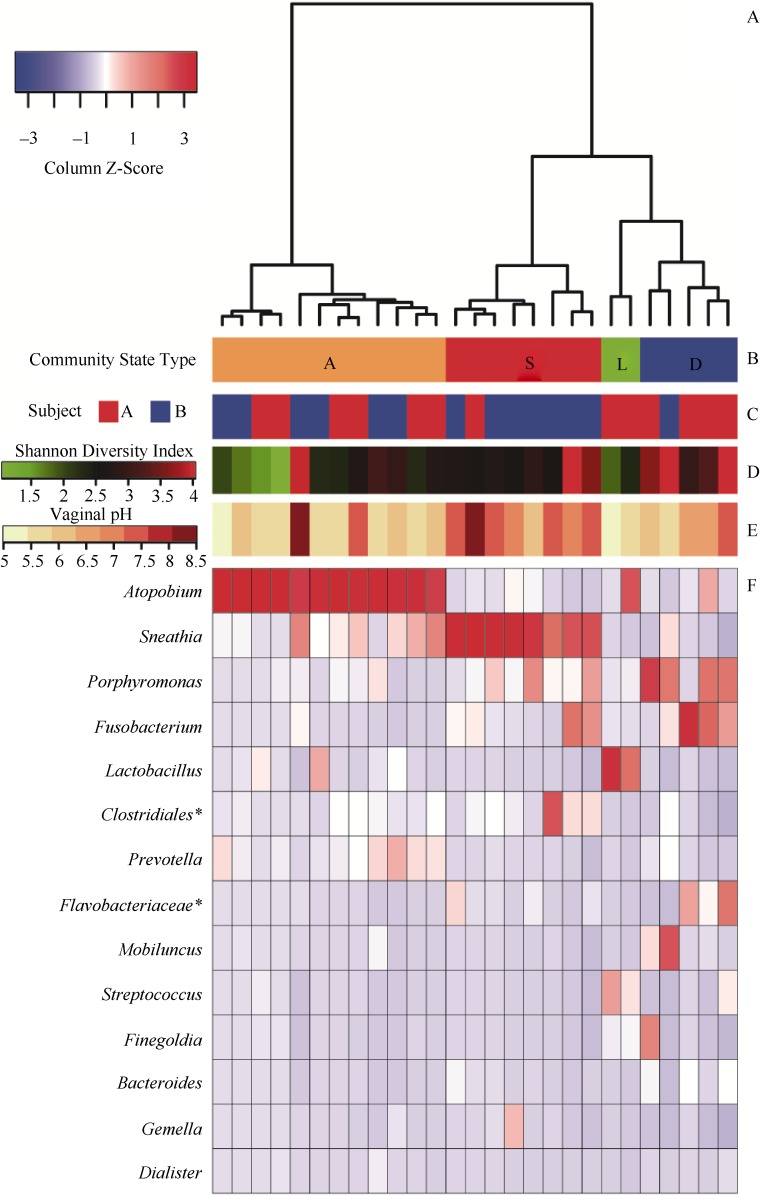
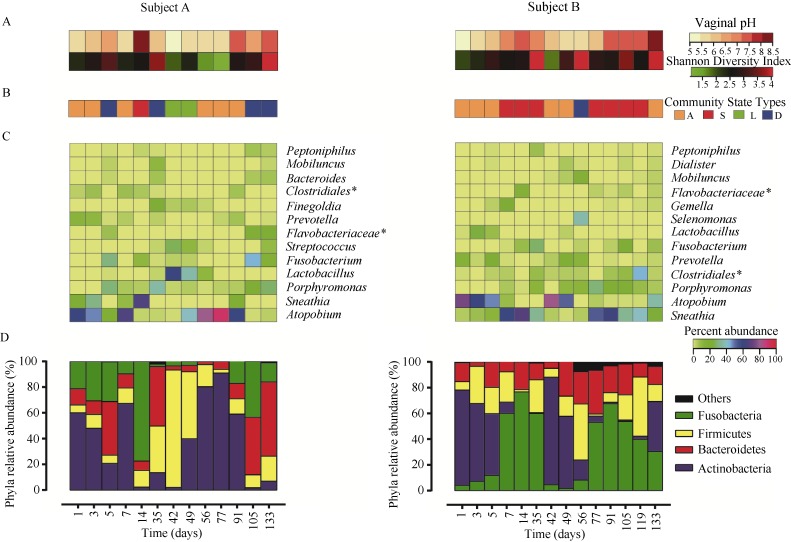
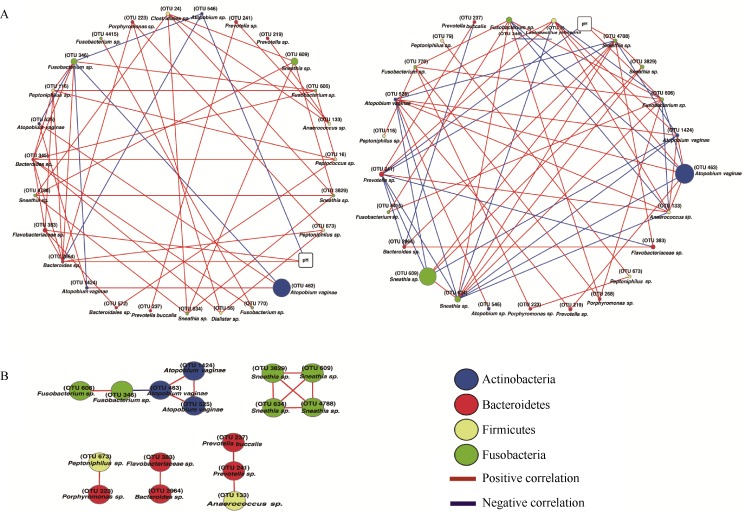
The complex and dynamic vaginal microbial ecosystem is critical to both health and disease of the host. Studies focusing on how vaginal microbiota influences HIV-1 infection may face limitations in selecting proper animal models. Given that northern pig-tailed macaques (Macaca leonina) are susceptible to HIV-1 infection, they may be an optimal animal model for elucidating the mechanisms by which vaginal microbiota contributes to resistance and susceptibility to HIV-1 infection. However, little is known about the composition and temporal variability of vaginal microbiota of the northern pig-tailed macaque. Here, we present a comprehensive catalog of the composition and temporal dynamics of vaginal microbiota of two healthy northern pig-tailed macaques over 19 weeks using 454-pyrosequencing of 16S rRNA genes. We found remarkably high proportions of a diverse array of anaerobic bacteria associated with bacterial vaginosis. Atopobium and Sneathia were dominant genera, and interestingly, we demonstrated the presence of Lactobacillus-dominated vaginal microbiota. Moreover, longitudinal analysis demonstrated that the temporal dynamics of the vaginal microbiota were considerably individualized. Finally, network analysis revealed that vaginal pH may influence the temporal dynamics of the vaginal microbiota, suggesting that inter-subject variability of vaginal bacterial communities could be mirrored in inter-subject variation in correlation profiles of species with each other and with vaginal pH over time. Our results suggest that the northern pig-tailed macaque could be an ideal animal model for prospective investigation of the mechanisms by which vaginal microbiota influence susceptibility and resistance to HIV-1 infection in the context of highly polymicrobial and Lactobacillus-dominated states.
Keywords: Bacterial vaginosis; Macaque; Networks; Temporal dynamics; Vaginal microbiome.
Figures
Similar articles
-
Identification of rhesus macaque genital microbiota by 16S pyrosequencing shows similarities to human bacterial vaginosis: implications for use as an animal model for HIV vaginal infection.AIDS Res Hum Retroviruses. 2010 Feb;26(2):193-200. doi: 10.1089/aid.2009.0166. AIDS Res Hum Retroviruses. 2010. PMID: 20156101 Free PMC article.
-
Associations of the vaginal microbiota with HIV infection, bacterial vaginosis, and demographic factors.AIDS. 2017 Apr 24;31(7):895-904. doi: 10.1097/QAD.0000000000001421. AIDS. 2017. PMID: 28121709 Free PMC article.
-
Directed shift of vaginal microbiota induced by vaginal application of sucrose gel in rhesus macaques.Int J Infect Dis. 2015 Apr;33:32-6. doi: 10.1016/j.ijid.2014.12.040. Epub 2014 Dec 26. Int J Infect Dis. 2015. PMID: 25546169
-
Vaginal microbiome.Ceska Gynekol. 2018 Winter;83(5):371-379. Ceska Gynekol. 2018. PMID: 30848142 Review. English.
-
The Human Microbiome during Bacterial Vaginosis.Clin Microbiol Rev. 2016 Apr;29(2):223-38. doi: 10.1128/CMR.00075-15. Clin Microbiol Rev. 2016. PMID: 26864580 Free PMC article. Review.
Cited by
-
Superior intestinal integrity and limited microbial translocation are associated with lower immune activation in SIVmac239-infected northern pig-tailed macaques (Macaca leonina).Zool Res. 2019 Nov 18;40(6):522-531. doi: 10.24272/j.issn.2095-8137.2019.047. Zool Res. 2019. PMID: 31033262 Free PMC article.
-
Meeting report: the 4th symposium on animal models of non-human primates in Kunming, Yunnan, China.Zool Res. 2016 Nov 18;37(6):361-365. doi: 10.13918/j.issn.2095-8137.2016.6.361. Zool Res. 2016. PMID: 28105801 Free PMC article. No abstract available.
-
Gardnerella vaginalis as a Cause of Bacterial Vaginosis: Appraisal of the Evidence From in vivo Models.Front Cell Infect Microbiol. 2020 Apr 24;10:168. doi: 10.3389/fcimb.2020.00168. eCollection 2020. Front Cell Infect Microbiol. 2020. PMID: 32391287 Free PMC article. Review.
-
Molecular cloning and anti-HIV-1 activities of APOBEC3s from northern pig-tailed macaques (Macaca leonina).Dongwuxue Yanjiu. 2016 Jul 18;37(4):246-51. doi: 10.13918/j.issn.2095-8137.2016.4.246. Dongwuxue Yanjiu. 2016. PMID: 27469256 Free PMC article.
-
Viral seroprevalence in northern pig-tailed macaques (Macaca leonina) derived from Ho Chi Minh City, Vietnam.Primates. 2016 Jul;57(3):413-9. doi: 10.1007/s10329-016-0531-5. Epub 2016 Mar 18. Primates. 2016. PMID: 26993123
References
-
- Agy MB, Frumkin LR, Corey L, Coombs RW, Wolinsky SM, Koehler J, Morton WR, Katze MG. 1992. Infection of Macaca nemestrina by human immunodeficiency virus type-1. Science, 257(5066): 103-106. - PubMed
-
- Assenov Y, Ramírez F, Schelhorn SE, Lengauer T, Albrecht M. 2008. Computing topological parameters of biological networks. Bioinformatics, 24(2): 282-284. - PubMed
-
- Baroncelli S, Negri DRM, Michelini Z, Cara A. 2008. Macaca mulatta, fascicularis and nemestrina in AIDS vaccine development. Expert Review of Vaccines, 7(9): 1419-1434. - PubMed
-
- Benjamini Y, Hochberg Y. 1995. Controlling the false discovery rate: a practical and powerful approach to multiple testing. Journal of the Royal Statistical Society: Series B (Statistical Methodology), 57(1): 289-300.
MeSH terms
Substances
LinkOut - more resources
Full Text Sources
