. 2015 Nov 30;589(23):3624-30.
doi: 10.1016/j.febslet.2015.09.029. Epub 2015 Oct 9.

SMIM1 is a type II transmembrane phosphoprotein and displays the Vel blood group antigen at its carboxyl-terminus

Affiliations

SMIM1 is a type II transmembrane phosphoprotein and displays the Vel blood group antigen at its carboxyl-terminus

Lionel Arnaud et al. FEBS Lett. .

Abstract

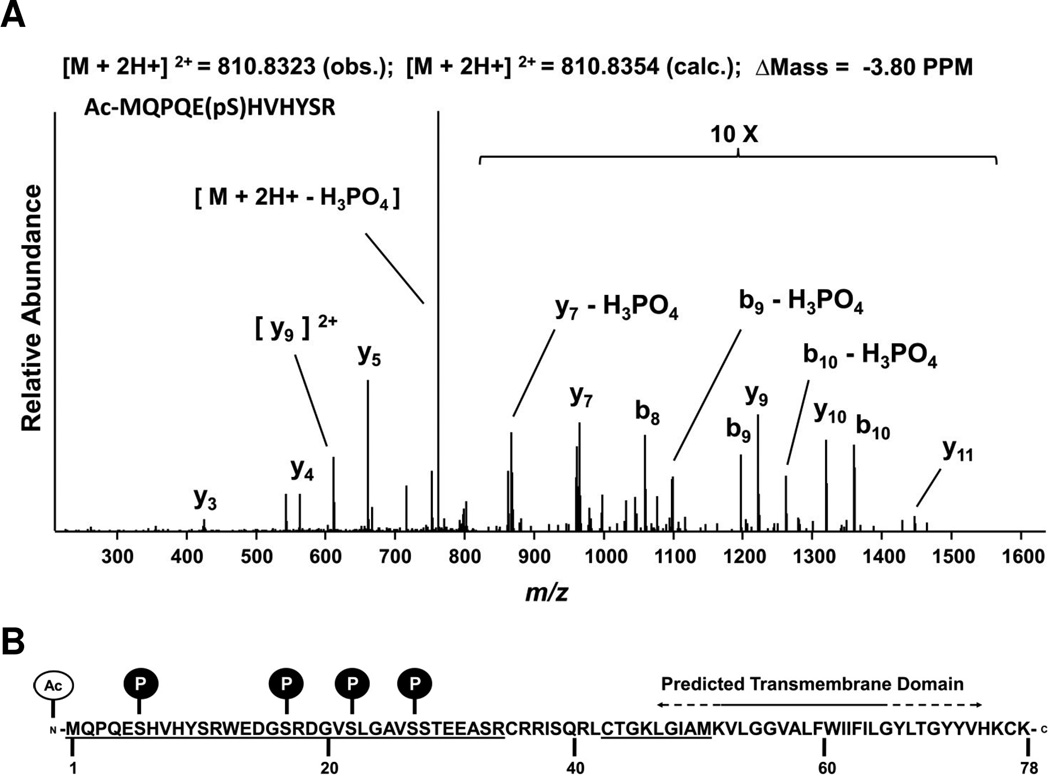
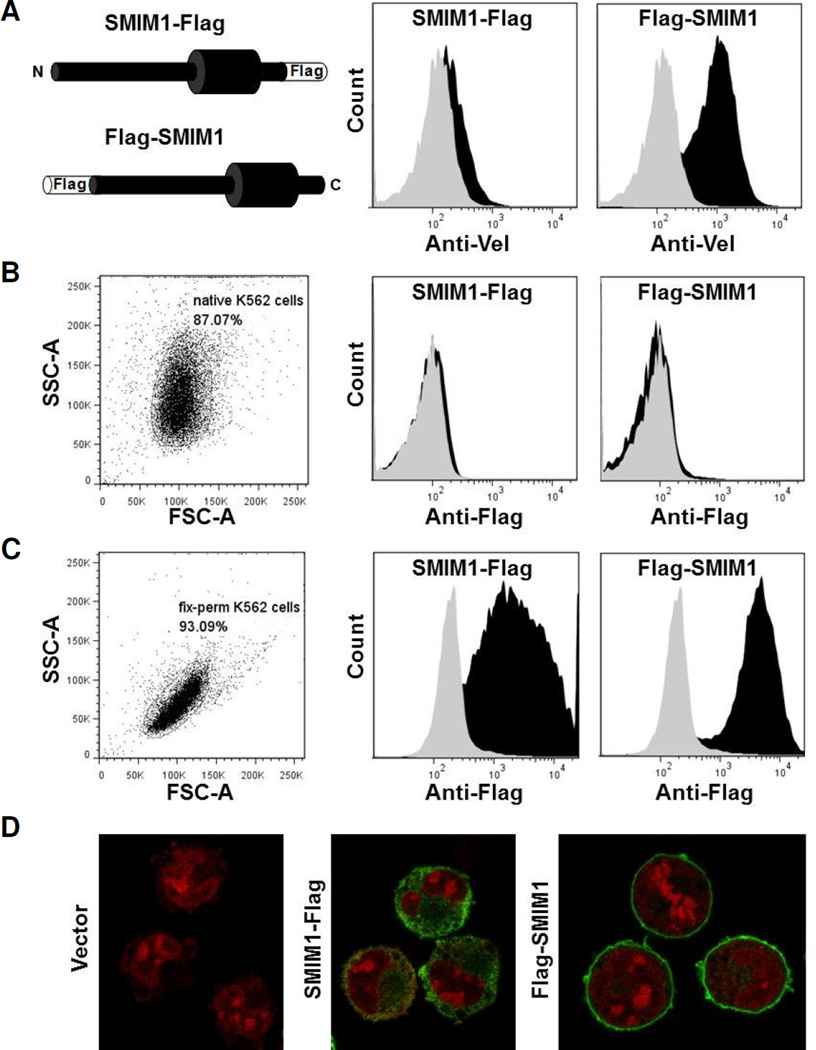
Disruption of SMIM1, encoding small integral membrane protein 1, is responsible for the Vel-negative blood type, a rare but clinically-important blood type. However, the exact nature of the Vel antigen and how it is presented by SMIM1 are poorly understood. Using mass spectrometry we found several sites of phosphorylation in the N-terminal region of SMIM1 and we found the initiating methionine of SMIM1 to be acetylated. Flow cytometry analyses of human erythroleukemia cells expressing N- or C-terminally Flag-tagged SMIM1, several point mutants of SMIM1, and a chimeric molecule between Kell and SMIM1 demonstrated that SMIM1 carries the Vel antigen as a type II membrane protein with a predicted C-terminal extracellular domain of only 3-12 amino acids.

Keywords: Blood group; Mass spectrometry; Phosphorylation; Small integral membrane protein; Type II membrane protein.


Conflict of interest statement

The authors declare that they have no conflicts of interest, financial or otherwise, regarding the publication of this manuscript.

Figures

Figure 1
Figure 1. Mass spectrometry-based identification of posttranslation modifications in the N-terminal region of SMIM1
(A) Low energy CID tandem mass spectrum of a tryptic SMIM1 peptide harboring an acetylated N-terminus (Ac-M) as well as phosphorylation of serine (pS) at position 6. Metrics for the MS analysis include the observed and calculated precursor m/z of the doubly charged ion and the difference in PPM. Intensities of ion in the m/z range of 800–1,600 were raised ten-fold for better visualization. Several ions, including the precursor, show losses of phosphoric acid (H3PO4) characteristic CID spectra of phosphoserine/threonine peptide ion precursors. (B) Visual summary of the SMIM1 posttranslational modifications identified by MS. Underlined are the peptide regions covered by the MS analysis. The predicted transmembrane domain is indicated with a solid line when predicted by all tested bioinformatics sources and with a dashed line when predicted by at least one but not all tested bioinformatics programs. See Supplementary Table 1 and Supplementary Figs. 1–4 for additional information.
Figure 2
Figure 2. Phosphorylation of SMIM1 leads to differential motility in SDS-PAGE but does not affect subcellular localization
(A) Immunofluorescence-based imaging of Flag-SMIM1 WT shows a tendency for localization to the plasma membrane. Panels show SMIM1 localization (anti-Flag, green channel) with DAPI-stained (blue) nuclei (left panel), SMIM1 localization alone (center panel), or SMIM1 localization with edge detection from ImageJ (right panel). Edge detection (right panel) suggests potential subcellular localization at the membrane as well as in membrane-bound vesicles. Immunofluorescence of Flag-SMIM1 S4A (B) shows that subcellular localization is not dependent on phosphorylation at the four mutated serines. (C) Flag-SMIM1 WT shows distinct banding in SDS-PAGE that increases in motility upon treatment with calf intestinal phosphatase (CIP), while Flag-SMIM1 S4A produces a single band that does not change upon CIP treatment. (D) A time course of CIP treatment shows a progressive shift of higher bands toward the lowest molecular band in WT, while no change is observed in the S4A.
Figure 3
Figure 3. Flow cytometry and microscopy analysis of N- and C-terminal Flag-tagged SMIM1 stably expressed in K-562 cells
(A) Expression constructs for SMIM1 with a Flag tag either at the N- or C-terminus were made as illustrated by the left panel and stably transfected in K-562 cells. Flow cytometry profiles of native cells expressing Flag-SMIM1 or SMIM1-Flag (both in black) and cells stably transfected with the empty vector (grey) that were labeled with anti-Vel (right and middle panels). (B) Flow cytometry profiles of native cells expressing Flag- SMIM1 or SMIM1-Flag (both in black) and cells stably transfected with the empty vector (grey) that were labeled with anti-Flag (right and middle panels). The left panel displays the SSCA/ FSC-A scatter plot of native K-562 cells. (C) Flow cytometry profiles of fixed and permeablized cells expressing Flag-SMIM1 or SMIM1-Flag (both in black) and cells stably transfected with the empty vector (grey) that were labeled with anti-Flag (right and middle panels). The left panel displays the SSC-A/FSC-A scatter plot of fixed and permeabilized K-562 cells. (D) Immunofluorescence microscopy of fixed and permabilized cells expressing Flag-SMIM1 (right), cells expressing SMIM1-Flag (middle) and cells stably transfected with the empty vector (left) that were labeled with anti-Flag (green) and propidium iodide (red).
Figure 4
Figure 4. Flow cytometry analysis of the Vel antigen in native K-562 cells stably expressing variants of SMIM1
The variants used are described on the left, and the flow cytometry profiles of native cells expressing those variants and labeled with anti-Vel are shown on the right. (A) KELVEL chimera corresponding to a fusion between the 47 N-terminal residues of Kell and the 35 C-terminal residues of SMIM1. (B) Wild type SMIM1. (C) ΔKCK mutant of SMIM1. (D) S4A mutant of SMIM1. (E) C2S mutant of SMIM1.
Figure 5
Figure 5. Analysis of the effect of the SNP rs373895822 (p.Val74Met) in SMIM1 on the expression of Vel in K-562 cells
(A) Flow cytometry profiles of native cells expressing SMIM1 with Val at position 74 (black) and cells stably transfected with the empty vector (grey) that were labeled with anti-Vel. (B) Flow cytometry profiles of native cells expressing SMIM1 with Met at position 74 (black) and cells stably transfected with the empty vector (grey) that were labeled with anti-Vel.

References

    1. Ballif BA, et al. Disruption of SMIM1 causes the Vel- blood type. EMBO Mol Med. 2013;5:751–761. - PMC - PubMed
    1. Storry JR, Joud M, Christophersen MK, Thuresson B, Akerstrom B, Sojka BN, Nilsson B, Olsson ML. Homozygosity for a null allele of SMIM1 defines the Vel-negative blood group phenotype. Nat Genet. 2013;45:537–541. - PubMed
    1. Cvejic A, et al. SMIM1 underlies the Vel blood group and influences red blood cell traits. Nat Genet. 2013;45:542–545. - PMC - PubMed
    1. Sussman LN, Miller EB. New blood factor: Vel. Rev Hematol. 1952;7:368–371. - PubMed
    1. Senes A, Gerstein M, Engelman DM. Statistical analysis of amino acid patterns in transmembrane helices: the GxxxG motif occurs frequently and in association with beta-branched residues at neighboring positions. J Mol Biol. 2000;296:921–936. - PubMed

Publication types