

The Organophosphate Degradation (opd) Island-borne Esterase-induced Metabolic Diversion in Escherichia coli and Its Influence on p-Nitrophenol Degradation
- PMID: 26453310
- PMCID: PMC4705976
- DOI: 10.1074/jbc.M115.661249
The Organophosphate Degradation (opd) Island-borne Esterase-induced Metabolic Diversion in Escherichia coli and Its Influence on p-Nitrophenol Degradation
Abstract
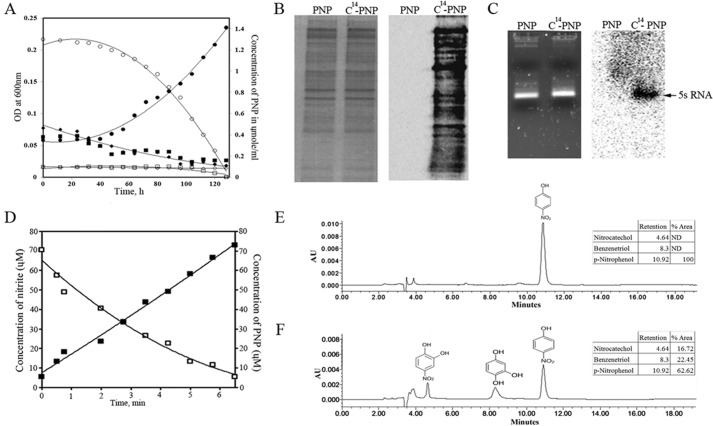
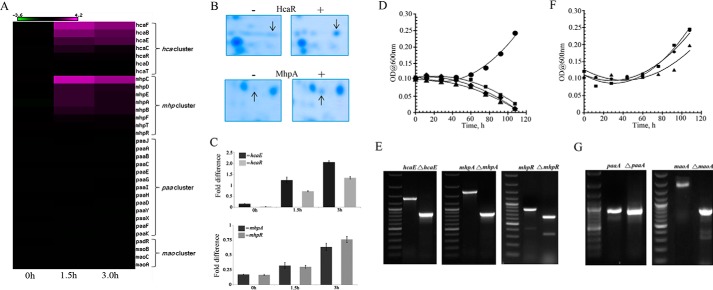
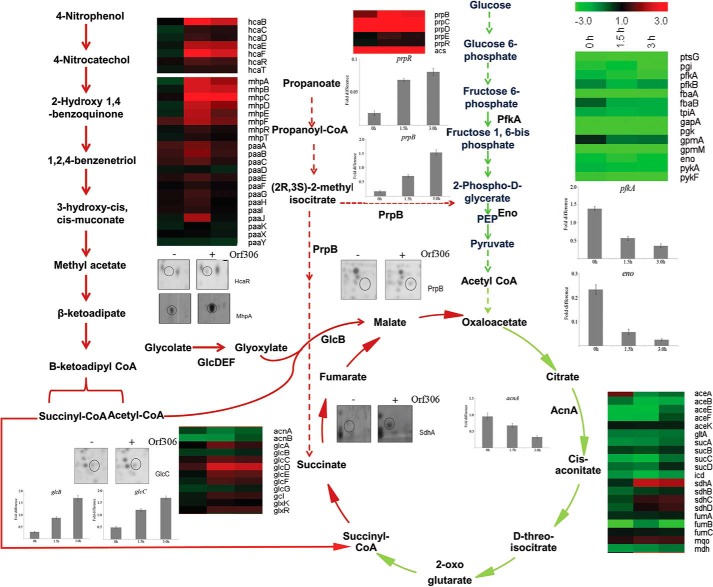
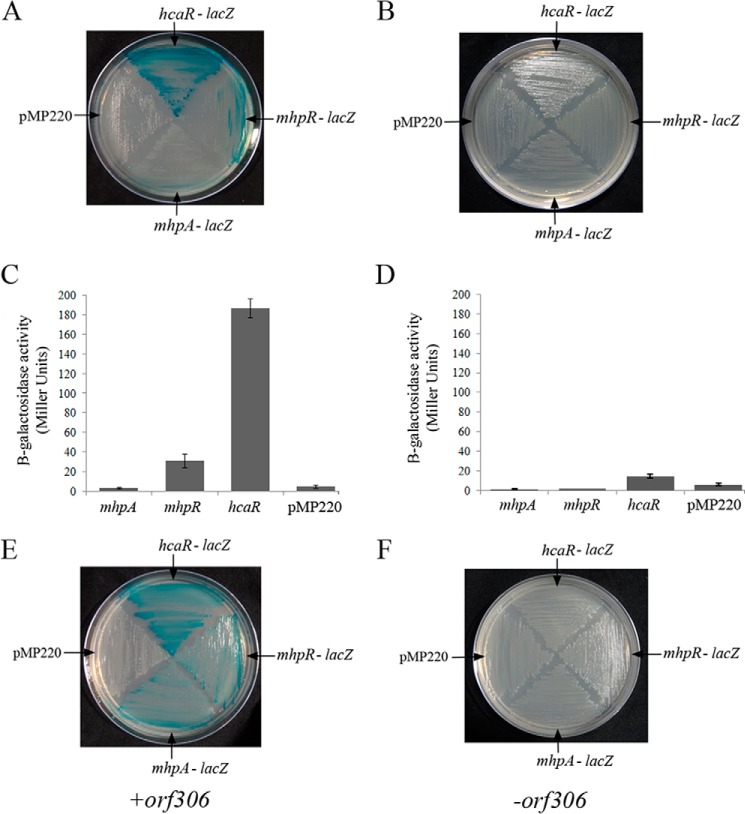
In previous studies of the organophosphate degradation gene cluster, we showed that expression of an open reading frame (orf306) present within the cluster in Escherichia coli allowed growth on p-nitrophenol (PNP) as sole carbon source. We have now shown that expression of orf306 in E. coli causes a dramatic up-regulation in genes coding for alternative carbon catabolism. The propionate, glyoxylate, and methylcitrate cycle pathway-specific enzymes are up-regulated along with hca (phenylpropionate) and mhp (hydroxyphenylpropionate) degradation operons. These hca and mhp operons play a key role in degradation of PNP, enabling E. coli to grow using it as sole carbon source. Supporting growth experiments, PNP degradation products entered central metabolic pathways and were incorporated into the carbon backbone. The protein and RNA samples isolated from E. coli (pSDP10) cells grown in (14)C-labeled PNP indicated incorporation of (14)C carbon, suggesting Orf306-dependent assimilation of PNP in E. coli cells.
Keywords: Escherichia coli (E. coli); biodegradation; gene expression; gene knock-out; metabolic regulation; microarray.
© 2015 by The American Society for Biochemistry and Molecular Biology, Inc.
Figures
Similar articles
-
Metabolic remodeling in Escherichia coli MG1655. A prophage e14-encoded small RNA, co293, post-transcriptionally regulates transcription factors HcaR and FadR.FEBS J. 2020 Nov;287(21):4767-4782. doi: 10.1111/febs.15247. Epub 2020 Feb 28. FEBS J. 2020. PMID: 32061118
-
Rationally engineered biotransformation of p-nitrophenol.Biotechnol Prog. 2010 May-Jun;26(3):616-21. doi: 10.1002/btpr.382. Biotechnol Prog. 2010. PMID: 20196144
-
Characterization of the hca cluster encoding the dioxygenolytic pathway for initial catabolism of 3-phenylpropionic acid in Escherichia coli K-12.J Bacteriol. 1998 Jun;180(11):2915-23. doi: 10.1128/JB.180.11.2915-2923.1998. J Bacteriol. 1998. PMID: 9603882 Free PMC article.
-
Development of an autofluorescent whole-cell biocatalyst by displaying dual functional moieties on Escherichia coli cell surfaces and construction of a coculture with organophosphate-mineralizing activity.Appl Environ Microbiol. 2008 Dec;74(24):7733-9. doi: 10.1128/AEM.01936-08. Epub 2008 Oct 24. Appl Environ Microbiol. 2008. PMID: 18952884 Free PMC article.
-
Metabolic engineering of Pseudomonas putida for the utilization of parathion as a carbon and energy source.Biotechnol Bioeng. 2002 Jun 30;78(7):715-21. doi: 10.1002/bit.10251. Biotechnol Bioeng. 2002. PMID: 12001163
Cited by
-
Omics Approaches to Pesticide Biodegradation.Curr Microbiol. 2020 Apr;77(4):545-563. doi: 10.1007/s00284-020-01916-5. Epub 2020 Feb 20. Curr Microbiol. 2020. PMID: 32078006 Review.
-
Novel mutation in Cul7 gene in a family diagnosed with 3M syndrome.J Genet. 2019 Mar;98:21. J Genet. 2019. PMID: 30945686
-
Transcriptional analysis reveals the metabolic state of Burkholderia zhejiangensis CEIB S4-3 during methyl parathion degradation.PeerJ. 2019 Apr 24;7:e6822. doi: 10.7717/peerj.6822. eCollection 2019. PeerJ. 2019. PMID: 31086743 Free PMC article.
-
A leucine responsive small RNA AbcR200 regulates expression of the lactate utilization (lut) operon in Acinetobacter baumannii DS002.J Biol Chem. 2025 Feb;301(2):108160. doi: 10.1016/j.jbc.2025.108160. Epub 2025 Jan 10. J Biol Chem. 2025. PMID: 39800307 Free PMC article.
-
A prophage-encoded sRNA limits lytic phage infection of adherent-invasive E. coli.bioRxiv [Preprint]. 2025 May 6:2025.05.06.652453. doi: 10.1101/2025.05.06.652453. bioRxiv. 2025. PMID: 40654919 Free PMC article. Preprint.
References
-
- Singh B. K., and Walker A. (2006) Microbial degradation of organophosphorus compounds. FEMS Microbiol. Rev. 30, 428–471 - PubMed
-
- Singh B. K. (2009) Organophosphorus-degrading bacteria: ecology and industrial applications. Nat. Rev. Microbiol. 7, 156–164 - PubMed
-
- Štěpánková A., Dušková J., Skálová T., Hašek J., Koval' T., Østergaard L. H., and Dohnálek J. (2013) Organophosphorus acid anhydrolase from Alteromonas macleodii: structural study and functional relationship to prolidases. Acta Crystallogr. Sect. F Struct. Biol. Cryst. Commun. 69, 346–354 - PMC - PubMed
-
- Roodveldt C., and Tawfik D. S. (2005) Shared promiscuous activities and evolutionary features in various members of the amidohydrolase superfamily. Biochemistry 44, 12728–12736 - PubMed
Publication types
MeSH terms
Substances
LinkOut - more resources
Full Text Sources
Molecular Biology Databases
Miscellaneous
