

The pro-fibrotic properties of transforming growth factor on human fibroblasts are counteracted by caffeic acid by inhibiting myofibroblast formation and collagen synthesis
- PMID: 26453399
- PMCID: PMC4761014
- DOI: 10.1007/s00441-015-2285-6
The pro-fibrotic properties of transforming growth factor on human fibroblasts are counteracted by caffeic acid by inhibiting myofibroblast formation and collagen synthesis
Abstract
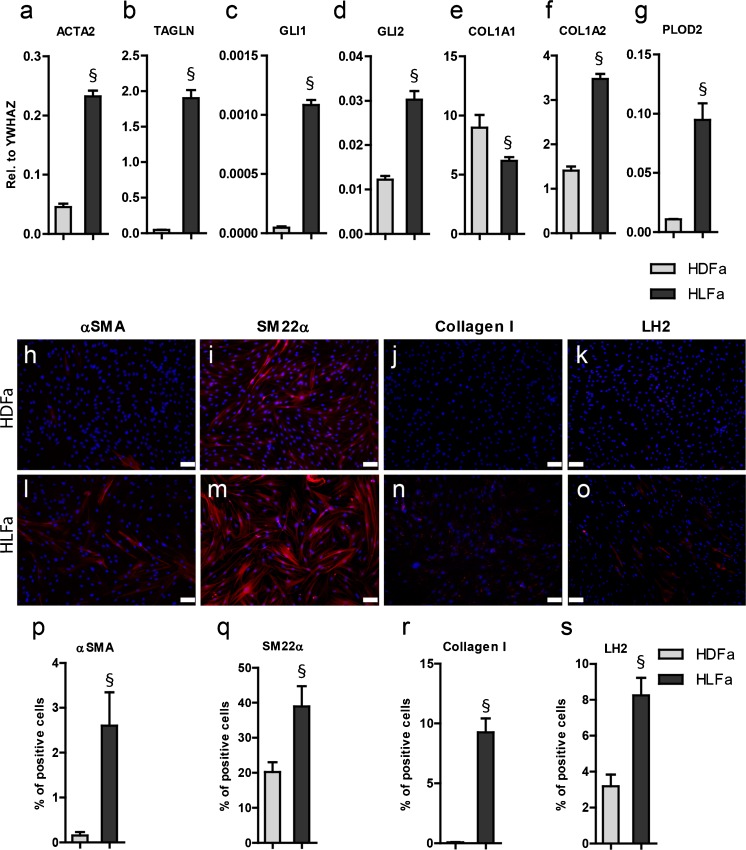
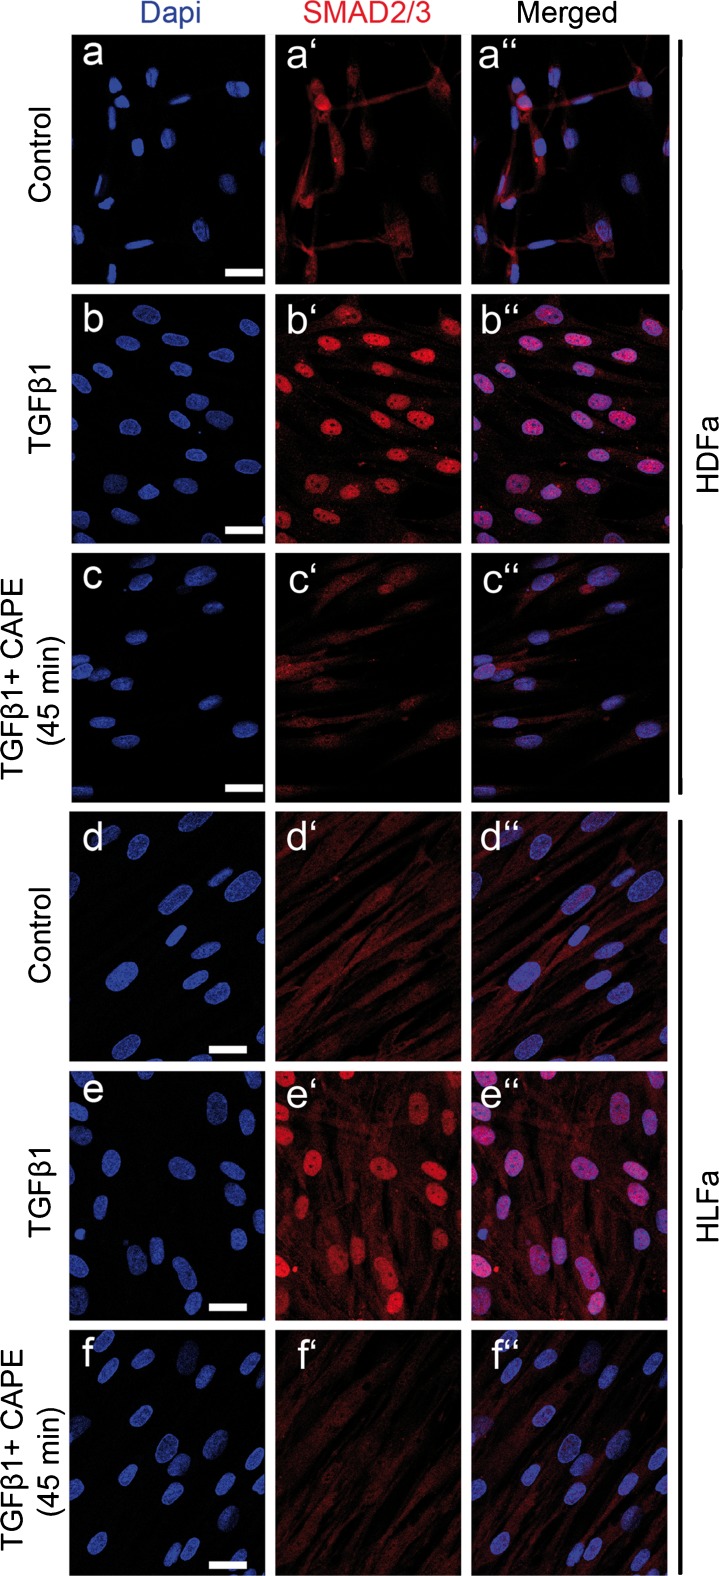
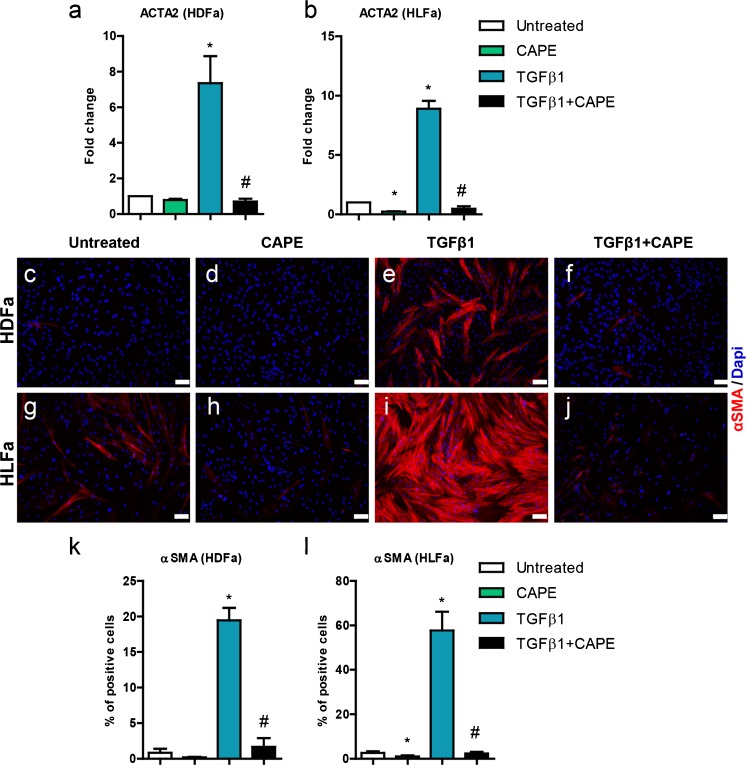
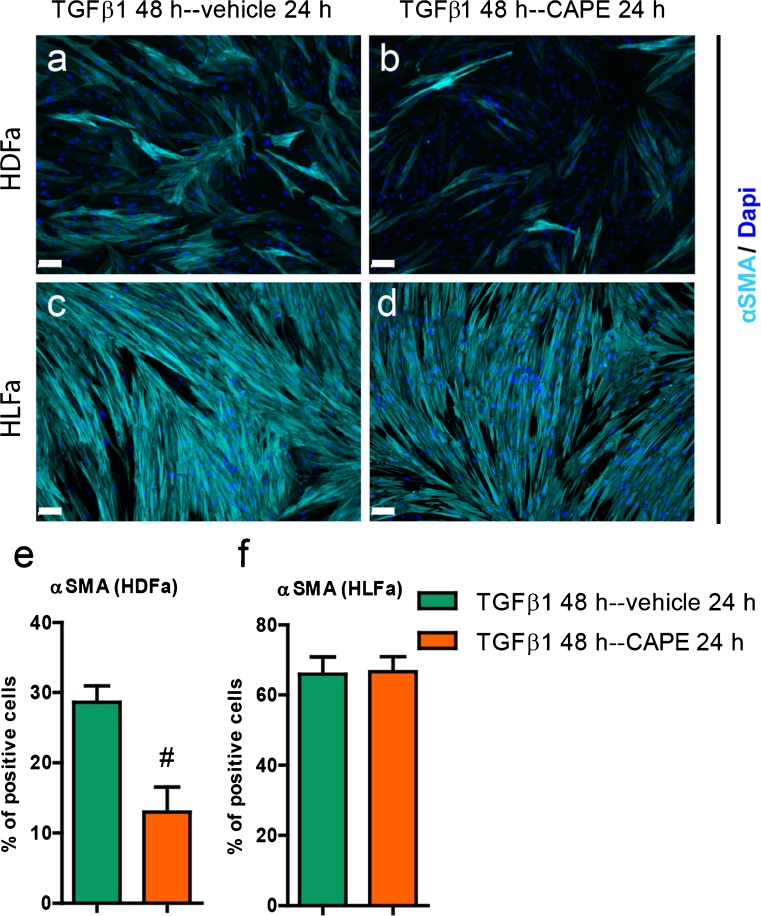
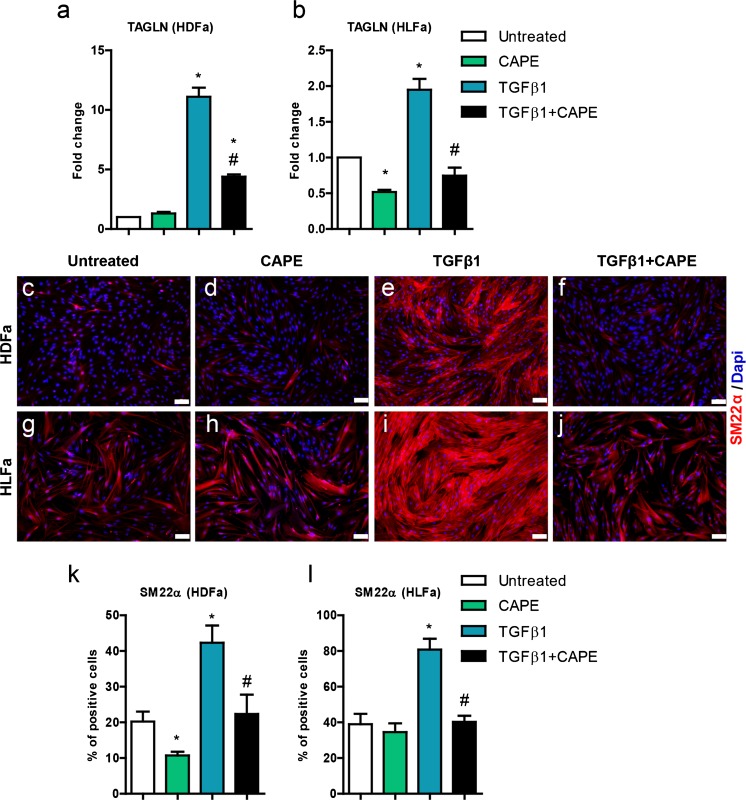
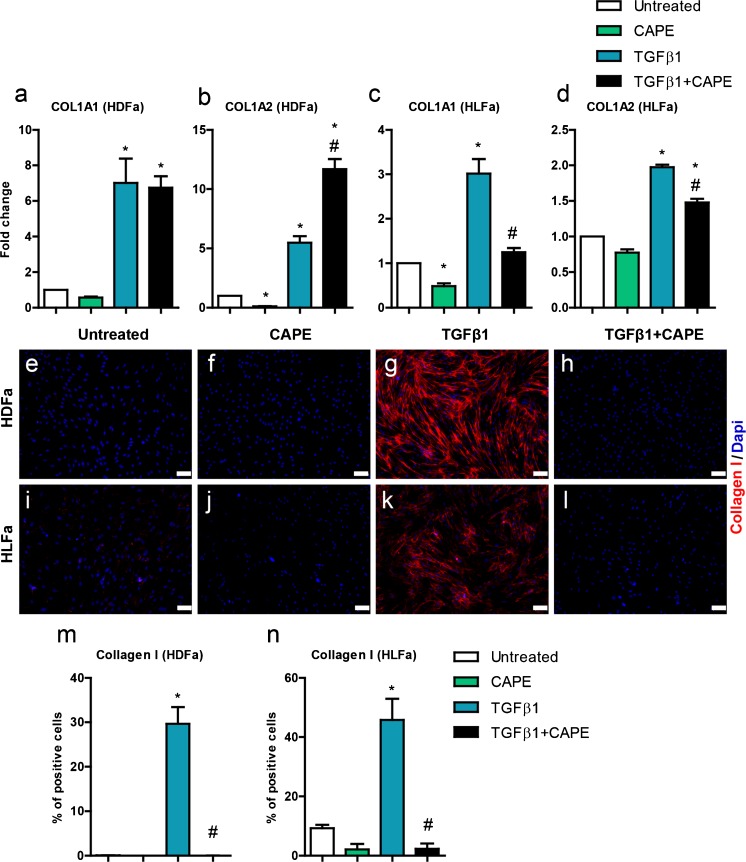
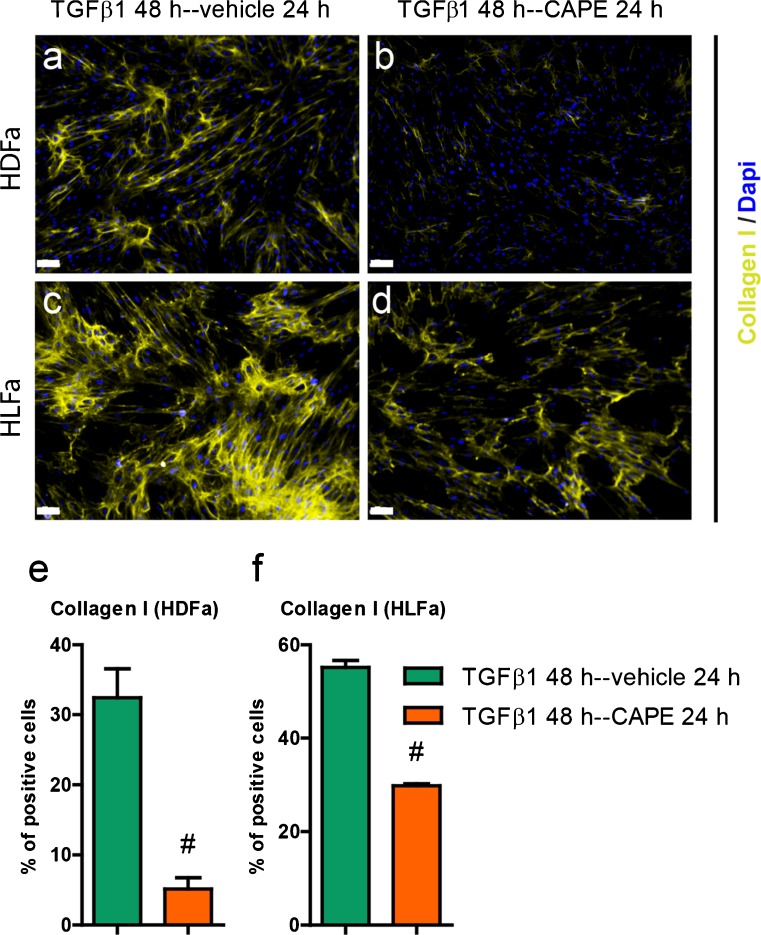
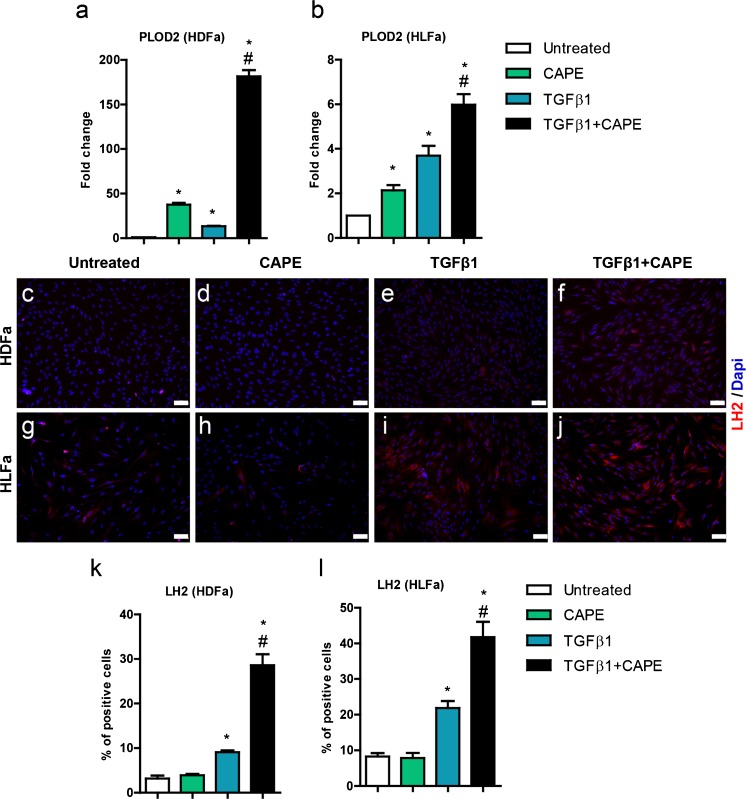
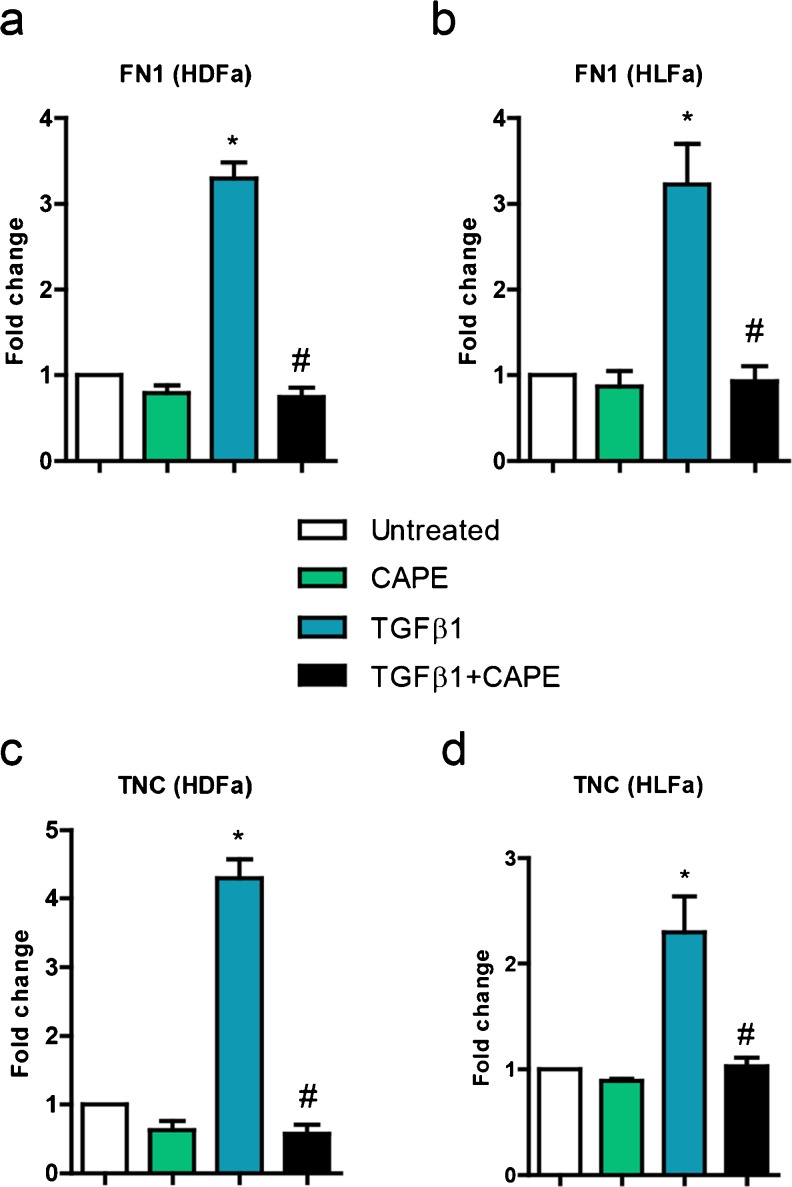
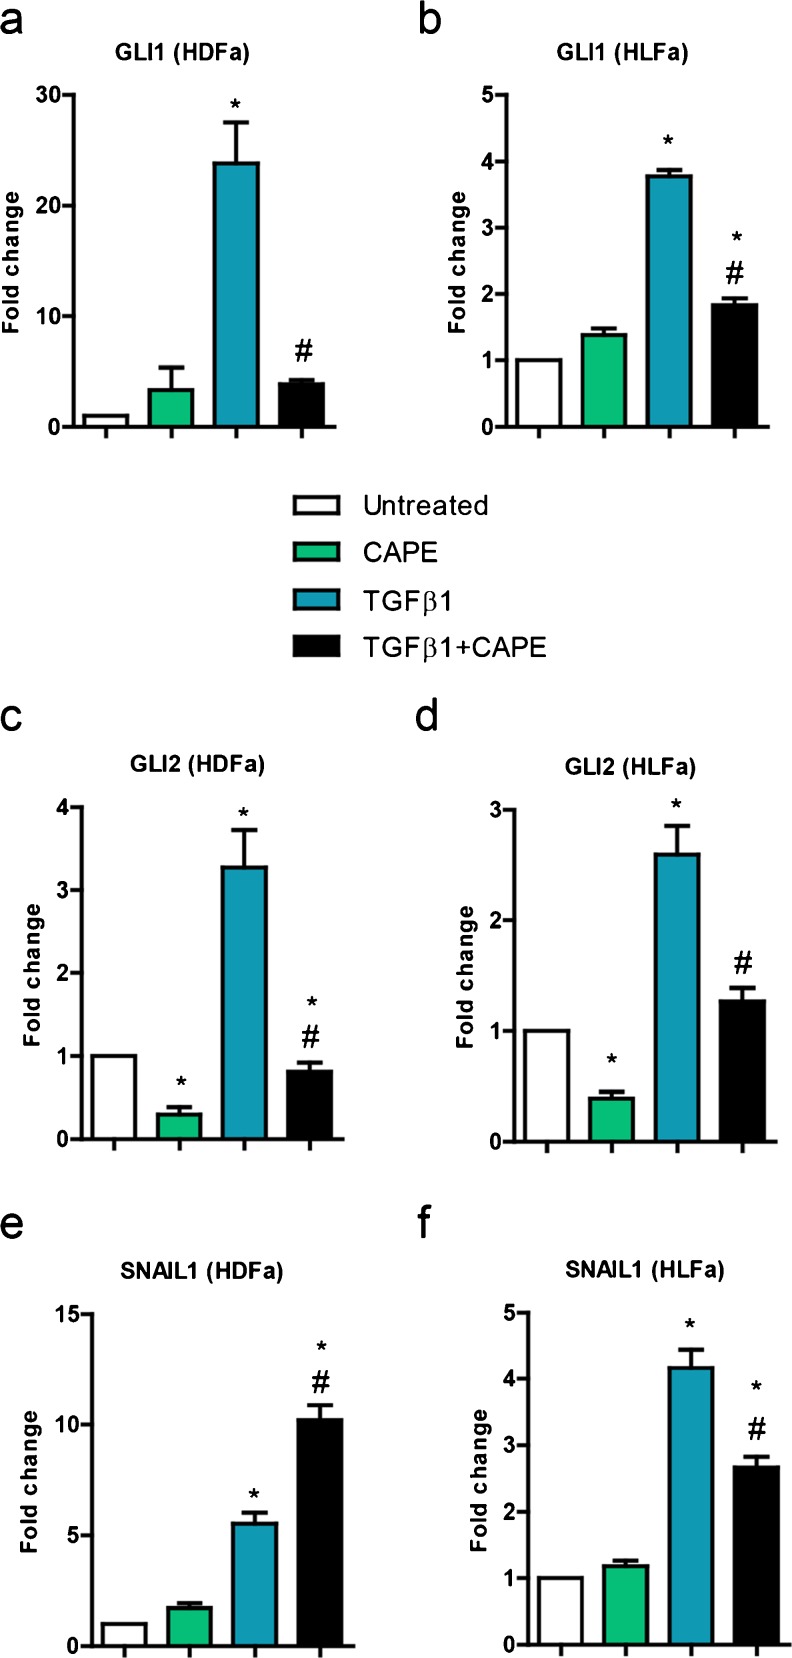
Fibrosis is a chronic disorder affecting many organs. A universal process in fibrosis is the formation of myofibroblasts and the subsequent collagen deposition by these cells. Transforming growth factor beta1 (TGFβ1) plays a major role in the formation of myofibroblasts, e.g. by activating fibroblasts. Currently, no treatments are available to circumvent fibrosis. Caffeic acid phenethyl ester (CAPE) shows a broad spectrum of biological activities, including anti-fibrotic properties in vivo in mice and rats. However, little is known about the direct effects of CAPE on fibroblasts. We have tested whether CAPE is able to suppress myofibroblast formation and collagen formation of human dermal and lung fibroblasts exposed to TGFβ1, and found that this was indeed the case. In fact, the formation of myofibroblasts by TGFβ1 and subsequent collagen formation was completely abolished by CAPE. The same was observed for fibronectin and tenascin C. The lack of myofibroblast formation is likely due to the suppression of GLI1 and GLI2 expression by CAPE because of diminished nuclear SMAD2/3 levels. Post-treatment with CAPE after myofibroblast formation even resulted in a partial reversal of myofibroblasts into fibroblasts and/or reduction in collagen formation. Major discrepancies were seen between mRNA levels of collagen type I and cells stained positive for collagen, underlining the need for protein data in fibrosis studies to make reliable conclusions.
Keywords: Caffeic acid; Collagen; Fibrosis; Lysyl hydroxylase; Myofibroblasts.
Figures
Similar articles
-
The IκB kinase inhibitor ACHP strongly attenuates TGFβ1-induced myofibroblast formation and collagen synthesis.J Cell Mol Med. 2015 Dec;19(12):2780-92. doi: 10.1111/jcmm.12661. Epub 2015 Sep 4. J Cell Mol Med. 2015. PMID: 26337045 Free PMC article.
-
Sequential analysis of myofibroblast differentiation and transforming growth factor-β1/Smad pathway activation in murine pulmonary fibrosis.J Nippon Med Sch. 2012;79(1):46-59. doi: 10.1272/jnms.79.46. J Nippon Med Sch. 2012. PMID: 22398790
-
Interleukin-1β attenuates myofibroblast formation and extracellular matrix production in dermal and lung fibroblasts exposed to transforming growth factor-β1.PLoS One. 2014 Mar 12;9(3):e91559. doi: 10.1371/journal.pone.0091559. eCollection 2014. PLoS One. 2014. PMID: 24622053 Free PMC article.
-
Hyaluronan's Role in Fibrosis: A Pathogenic Factor or a Passive Player?Biomed Res Int. 2015;2015:790203. doi: 10.1155/2015/790203. Epub 2015 Oct 25. Biomed Res Int. 2015. PMID: 26583132 Free PMC article. Review.
-
Cardiac Fibrosis and Fibroblasts.Cells. 2021 Jul 6;10(7):1716. doi: 10.3390/cells10071716. Cells. 2021. PMID: 34359886 Free PMC article. Review.
Cited by
-
TNF-α stimulates colonic myofibroblast migration via COX-2 and Hsp27.J Surg Res. 2016 Jul;204(1):145-52. doi: 10.1016/j.jss.2016.04.034. Epub 2016 Apr 25. J Surg Res. 2016. PMID: 27451881 Free PMC article.
-
Development of a biodegradable antifibrotic local drug delivery system for glaucoma microstents.Biosci Rep. 2018 Aug 31;38(4):BSR20180628. doi: 10.1042/BSR20180628. Print 2018 Aug 31. Biosci Rep. 2018. PMID: 30061178 Free PMC article.
-
Combination of natural antivirals and potent immune invigorators: A natural remedy to combat COVID-19.Phytother Res. 2021 Dec;35(12):6530-6551. doi: 10.1002/ptr.7228. Epub 2021 Aug 15. Phytother Res. 2021. PMID: 34396612 Free PMC article. Review.
-
Human trabecular meshwork cell behavior is influenced by collagen scaffold pore architecture and glycosaminoglycan composition.Biotechnol Bioeng. 2020 Oct;117(10):3150-3159. doi: 10.1002/bit.27477. Epub 2020 Jul 9. Biotechnol Bioeng. 2020. PMID: 32589791 Free PMC article.
-
Role of Oxidative Stress in Peyronie's Disease: Biochemical Evidence and Experiences of Treatment with Antioxidants.Int J Mol Sci. 2022 Dec 15;23(24):15969. doi: 10.3390/ijms232415969. Int J Mol Sci. 2022. PMID: 36555611 Free PMC article. Review.
References
-
- Brinckmann J, Kim S, Wu J, Reinhardt DP, Batmunkh C, Metzen E, Notbohm H, Bank RA, Krieg T, Hunzelmann N. Interleukin 4 and prolonged hypoxia induce a higher gene expression of lysyl hydroxylase 2 and an altered cross-link pattern: important pathogenetic steps in early and late stage of systemic scleroderma? Matrix Biol. 2005;24:459–468. doi: 10.1016/j.matbio.2005.07.002. - DOI - PubMed
Publication types
MeSH terms
Substances
LinkOut - more resources
Full Text Sources
Other Literature Sources
Miscellaneous
