

Burkitt lymphoma beyond MYC translocation: N-MYC and DNA methyltransferases dysregulation
- PMID: 26453442
- PMCID: PMC4600215
- DOI: 10.1186/s12885-015-1661-7
Burkitt lymphoma beyond MYC translocation: N-MYC and DNA methyltransferases dysregulation
Abstract
Background: The oncogenic transcription factor MYC is pathologically activated in many human malignancies. A paradigm for MYC dysregulation is offered by Burkitt lymphoma, where chromosomal translocations leading to Immunoglobulin gene-MYC fusion are the crucial initiating oncogenic events. However, Burkitt lymphoma cases with no detectable MYC rearrangement but maintaining MYC expression have been identified and alternative mechanisms can be involved in MYC dysregulation in these cases.
Methods: We studied the microRNA profile of MYC translocation-positive and MYC translocation-negative Burkitt lymphoma cases in order to uncover possible differences at the molecular level. Data was validated at the mRNA and protein level by quantitative Real-Time polymerase chain reaction and immunohistochemistry, respectively.
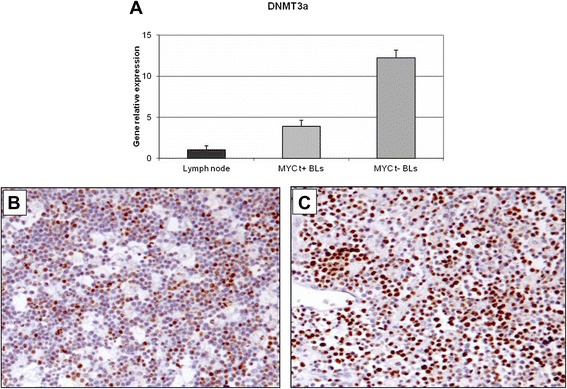
Results: We identified four microRNAs differentially expressed between the two groups. The impact of these microRNAs on the expression of selected genes was then investigated. Interestingly, in MYC translocation-negative cases we found over-expression of DNA-methyl transferase family members, consistent to hypo-expression of the hsa-miR-29 family. This finding suggests an alternative way for the activation of lymphomagenesis in these cases, based on global changes in methylation landscape, aberrant DNA hypermethylation, lack of epigenetic control on transcription of targeted genes, and increase of genomic instability. In addition, we observed an over-expression of another MYC family gene member, MYCN that may therefore represent a cooperating mechanism of MYC in driving the malignant transformation in those cases lacking an identifiable MYC translocation but expressing the gene at the mRNA and protein levels.
Conclusions: Collectively, our results showed that MYC translocation-positive and MYC translocation-negative Burkitt lymphoma cases are slightly different in terms of microRNA and gene expression. MYC translocation-negative Burkitt lymphoma, similarly to other aggressive B-cell non Hodgkin's lymphomas, may represent a model to understand the intricate molecular pathway responsible for MYC dysregulation in cancer.
Figures


Similar articles
-
MYC translocation-negative classical Burkitt lymphoma cases: an alternative pathogenetic mechanism involving miRNA deregulation.J Pathol. 2008 Dec;216(4):440-50. doi: 10.1002/path.2410. J Pathol. 2008. PMID: 18802929
-
Integrative microRNA and mRNA deep-sequencing expression profiling in endemic Burkitt lymphoma.BMC Cancer. 2017 Nov 13;17(1):761. doi: 10.1186/s12885-017-3711-9. BMC Cancer. 2017. PMID: 29132323 Free PMC article.
-
Biological characterization of adult MYC-translocation-positive mature B-cell lymphomas other than molecular Burkitt lymphoma.Haematologica. 2014 Apr;99(4):726-35. doi: 10.3324/haematol.2013.091827. Epub 2013 Oct 31. Haematologica. 2014. PMID: 24179151 Free PMC article.
-
New clues to the molecular pathogenesis of Burkitt lymphoma revealed through next-generation sequencing.Curr Opin Hematol. 2014 Jul;21(4):326-32. doi: 10.1097/MOH.0000000000000059. Curr Opin Hematol. 2014. PMID: 24867287 Review.
-
Translocations involving 8q24 in Burkitt lymphoma and other malignant lymphomas: a historical review of cytogenetics in the light of todays knowledge.Leukemia. 2009 Feb;23(2):225-34. doi: 10.1038/leu.2008.281. Epub 2008 Oct 16. Leukemia. 2009. PMID: 18923440 Review.
Cited by
-
Multiple Defects Impair the HLA Class II Antigen Presentation Capacity of Burkitt Lymphoma.J Clin Cell Immunol. 2016 Aug;7(4):e119. doi: 10.4172/2155-9899.1000e119. Epub 2016 Aug 5. J Clin Cell Immunol. 2016. PMID: 27747135 Free PMC article. No abstract available.
-
Renal Infiltration as a Primary Presentation of Burkitt Lymphoma Secondary to Systemic Lupus Erythematosus: A Rarity Unto a Rarity.Cureus. 2020 Sep 17;12(9):e10512. doi: 10.7759/cureus.10512. Cureus. 2020. PMID: 33094053 Free PMC article.
-
Epstein-Barr Virus Nuclear Antigen 1 Increases the Expression of Viral Oncogenes and Cellular Genes in the HeLa Cell Line.Int J Mol Cell Med. 2022;11(4):346-356. doi: 10.22088/IJMCM.BUMS.11.4.346. Int J Mol Cell Med. 2022. PMID: 37727642 Free PMC article.
-
MicroRNAs as Biomarkers of B-cell Lymphoma.Biomark Insights. 2018 Oct 16;13:1177271918806840. doi: 10.1177/1177271918806840. eCollection 2018. Biomark Insights. 2018. PMID: 30349178 Free PMC article. Review.
-
MiR-29 silencing modulates the expression of target genes related to proliferation, apoptosis and methylation in Burkitt lymphoma cells.J Cancer Res Clin Oncol. 2018 Mar;144(3):483-497. doi: 10.1007/s00432-017-2575-3. Epub 2018 Jan 9. J Cancer Res Clin Oncol. 2018. PMID: 29318382 Free PMC article.
References
-
- Swerdlow SH, Campo E, Harris NL, Jaffe E, Pileri S, Stein H. WHO classification of tumors of haematopoietic and lymphoid tissues. Lyon, France: IARC; 2008.
-
- Evans PA, Pott C, Groenen PJ, Salles G, Davi F, Berger F, et al. Significantly improved PCR-based clonality testing in B-cell malignancies by use of multiple immunoglobulin gene targets. Report of the BIOMED-2 Concerted Action BHM4-CT98-3936. Leukemia. 2007;21(2):207–14. doi: 10.1038/sj.leu.2404479. - DOI - PubMed
-
- Elaine S. Jaffe NLH, James W. Vardiman, Campo E. and Daniel A. Arber. Hematopathology. Edited by Elsevier. London, UK. 2011.
Publication types
MeSH terms
Substances
LinkOut - more resources
Full Text Sources
Other Literature Sources
Molecular Biology Databases
