. 2015 Nov 15;195(10):4781-91.
doi: 10.4049/jimmunol.1501191. Epub 2015 Oct 9.

Phenotypic and Morphological Properties of Germinal Center Dark Zone Cxcl12-Expressing Reticular Cells

Affiliations

Phenotypic and Morphological Properties of Germinal Center Dark Zone Cxcl12-Expressing Reticular Cells

Lauren B Rodda et al. J Immunol. .

Abstract

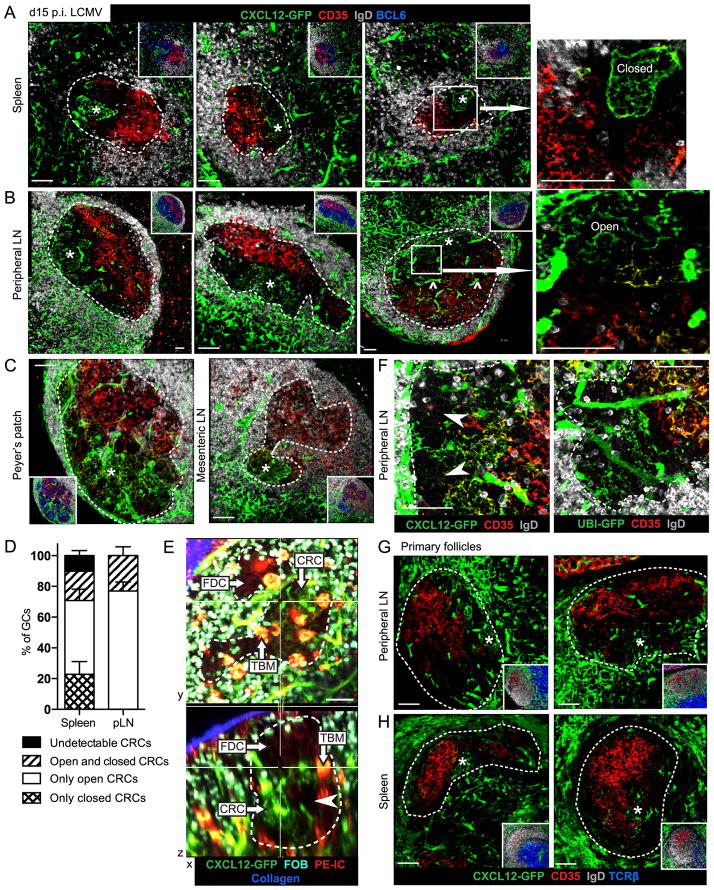
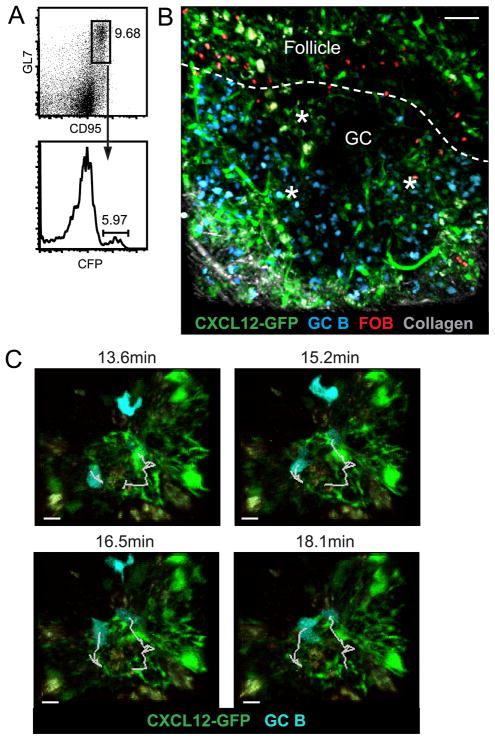
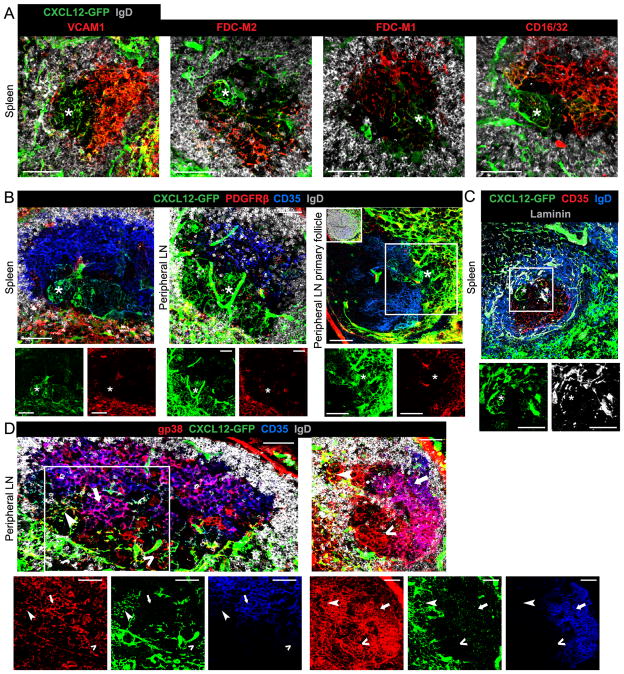
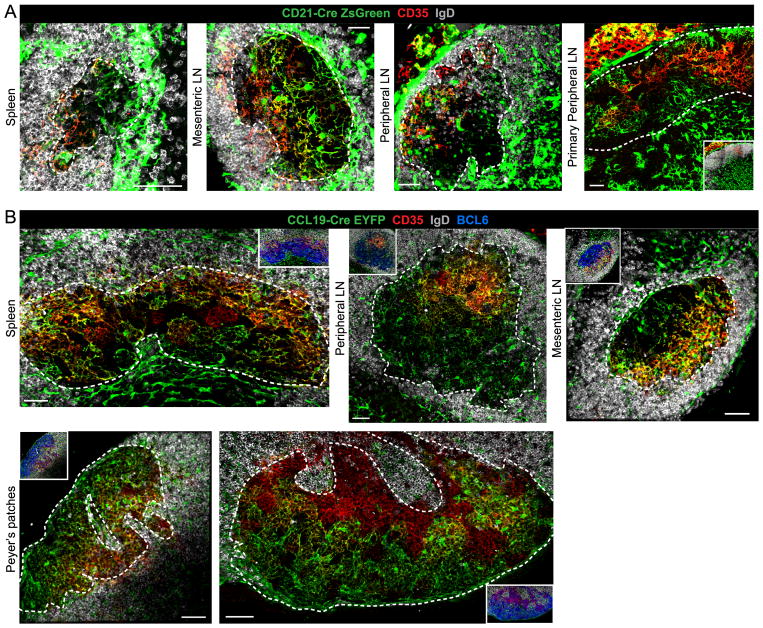
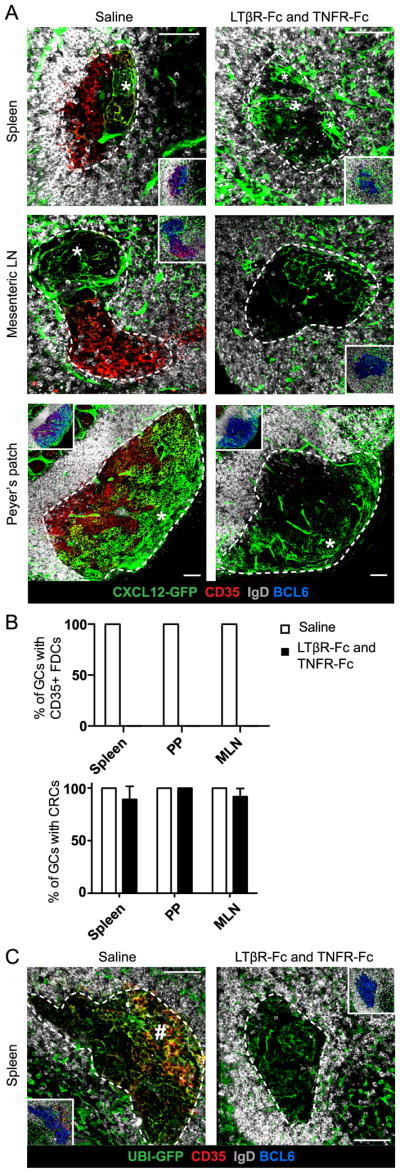
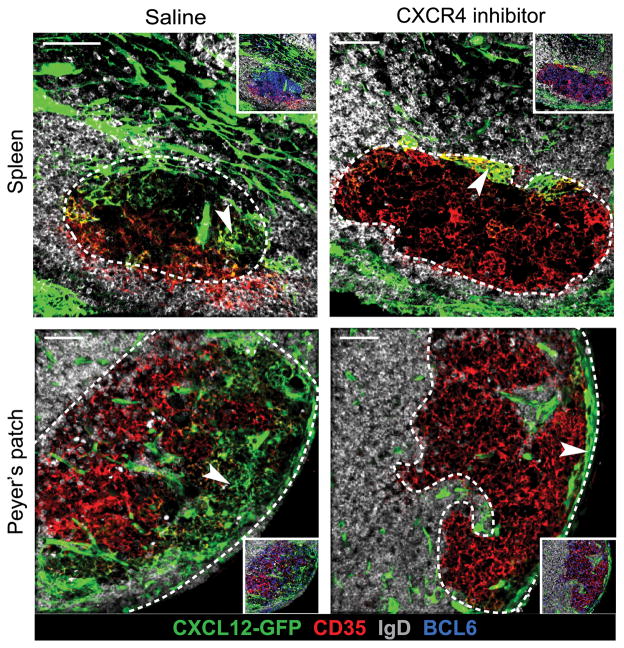
The germinal center (GC) is divided into a dark zone (DZ) and a light zone (LZ). GC B cells must cycle between these zones to achieve efficient Ab affinity maturation. Follicular dendritic cells (FDCs) are well characterized for their role in supporting B cell Ag encounter in primary follicles and in the GC LZ. However, the properties of stromal cells supporting B cells in the DZ are relatively unexplored. Recent work identified a novel stromal population of Cxcl12-expressing reticular cells (CRCs) in murine GC DZs. In this article, we report that CRCs have diverse morphologies, appearing in open and closed networks, with variable distribution in lymphoid tissue GCs. CRCs are also present in splenic and peripheral lymph node primary follicles. Real-time two-photon microscopy of Peyer's patch GCs demonstrates B cells moving in close association with CRC processes. CRCs are gp38(+) with low to undetectable expression of FDC markers, but CRC-like cells in the DZ are lineage marked, along with FDCs and fibroblastic reticular cells, by CD21-Cre- and Ccl19-Cre-directed fluorescent reporters. In contrast to FDCs, CRCs do not demonstrate dependence on lymphotoxin or TNF for chemokine expression or network morphology. CRC distribution in the DZ does require CXCR4 signaling, which is necessary for GC B cells to access the DZ and likely to interact with CRC processes. Our findings establish CRCs as a major stromal cell type in the GC DZ and suggest that CRCs support critical activities of GC B cells in the DZ niche through Cxcl12 expression and direct cell-cell interactions.


Figures

FIGURE 1
FIGURE 1. Cxcl12-expressing Reticular Cells (CRCs) populate the DZ niche with fine, irregular networks
(A–C) Thick section (30μm) confocal microscopy of Cxcl12-GFP+ DZ CRCs (*) and CD35+ FDCs in tissues from Cxcl12-GFP mice analyzed at day 15 post-infection (p.i) with LCMV. (^) Blood vessel passing through GC. White box and arrow indicate increased magnification of CRCs in ‘closed’ formation in spleen (A) and in ‘open’ formation in pLN (B). White, dotted line indicates the GC boundary based on BCL6 staining only shown in insets. Data (A–C) are representative of 3 mice and 3–15 GC views per tissue per mouse. (D) Average frequency of DZ CRC network morphologies observed in thick sections from 3 LCMV-infected mice with 6–15 GC views per tissue, error bars represent SEM. (E) TPLSM of intact Cxcl12-GFP MLN GC on day 10 post-immunization with SRBCs and 1 day after transfer of CFP+ naïve B cells (follicular B cells, FOB) to mark the GC edge (white, dotted line) and treatment with PE-IC to label FDCs and TBMs. CRCs, FDCs and TBMs are labeled and areas of undetectable DZ stroma indicated (arrowhead) in XY and XZ sections of the 193μm z-stack shown as maximum intensity projections (x=5.54μm, y=6.09μm, z=30.0μm). Images correspond to Movie S1. Representative of 2 mice and 4 GCs per MLN. (F) Regions of undetectable stroma (arrowhead) in pLN GC DZs from Cxcl12-GFP mice (3 mice, 3–15 GCs views per mouse) and UBI-GFP mice previously reconstituted with WT BM (2 mice, 1–7 GCs views per mouse) imaged on day 15 p.i. with LCMV. White dotted line indicates the GC boundary based on IgD stain. (G and H) Confocal microscopy of CRCs (*) in primary follicles from (G) pLN (2 mice, 6–26 follicle views per mouse) and (H) spleen (3 mice, 20–90 follicle views per mouse) from unimmunized Cxcl12-GFP mice. White, dotted line indicates the boundary of the primary follicle based on TCRβ and IgD stain only shown in insets. Scale bar is 50μm.
FIGURE 2
FIGURE 2. Movement dynamics of GC B cells in association with DZ CRCs
TPLSM of Cxcl12-GFP MD4 PPs 2 weeks after transfer of WT and CFP+ B cells and 1 day after transfer of CMTMR-labeled WT B cells to label a portion of the FOB cells and outline the GC (white, dotted line). (A) Representative flow cytometry plots showing percent of CFP+ GC B cells (B220+ IgD GL7+ CD95+) in PPs on day of imaging. Pre-gated for B220+ IgD cells, numbers indicate percent of parent gate. (B) CRC networks (*) in explant PP GC DZ (60μm z-stack) surrounded by CFP+ GC B cells. Collagen marks the serosal edge of the PP. Images correspond to Movie S3 and S4. Scale bar is 50μm. (C) Time lapse images of CFP+ GC B cells moving through GFP+ CRC networks in an explant PP (69μm z-stack). Tracks of GC B cells indicated in white. Images correspond to Movie S5. Scale bar is 10μm. Images representative of 6 movies from 3 mice in 3 experiments.
FIGURE 3
FIGURE 3. CRCs are phenotypically distinct from FDCs and FRCs across tissues
Confocal microscopy of CRCs (*) in GCs from SRBC-immunized Cxcl12-GFP mice stained for (A) VCAM1, FDC-M2, FDC-M1 and CD16/32 (each image representative of 1–3 mice, 2–20 GC views per spleen), (B) GCs and primary follicles stained for PDGFRβ (1–3 mice, 14 GC views per spleen, 2–3 GC views per pLN, 4 follicle views per pLN). In primary pLN panel, IgD is only shown in inset and white box indicates area shown in single channels. (C) GC stained for laminin (3 mice, 1–3 GC views per spleen). (D) PLN GCs from Cxcl12-GFP mice on day 15 p.i. with LCMV stained for gp38 (2 mice, 1–18 GC views per mouse). Examples of CRCs (arrowhead), FDCs (arrow) and gp38+ CD35 Cxcl12-GFP stroma (^) are indicated. (C and D) Individual channels shown below merged image and if enlarged, area indicated by white box. Scale bar is 50μm.
FIGURE 4
FIGURE 4. CRCs are likely lineage related to FDCs and FRCs
Confocal microscopy of CRCs (*) in GCs from SRBC-immunized (A) CD21-Cre R26-ZsGreen lineage reporter mice (1–4 mice, 3–14 GC views per spleen, 2–5 GC views per MLN, 3–10 GC views per pLN and 2 follicle views per primary pLN) and (B) Ccl19-Cre R26-EYFP lineage reporter mice (3 mice, 6–7 GC views per spleen, 2–6 GC views per pLN, 1–7 GC views per MLN and 1–3 GC views per PP). White, dotted line outlines GCs (A and B) based on BCL6+ GC B cell stain (inset only) and pLN primary follicle (A) based on IgD+ FOB cell stain (inset only). Scale bar is 50μm.
FIGURE 5
FIGURE 5. CRCs do not require LT or TNF signaling for maintenance of Cxcl12 expression or network morphology
(A) Confocal microscopy images of GC CRC networks (*) in Cxcl12-GFP mice immunized with SRBC and, on day 10, treated with 1mg/ml LTβR-Fc and 1mg/ml TNFR-Fc or saline. Mice were analyzed on day 14. (B) Percent of GCs containing CD35+ FDCs (top) or CRC networks (bottom). Data from 3 mice treated with saline (6–23 GC views per spleen, 5–14 GC views per MLN, 5–6 GC views per PP) and 4 mice treated with LTβR-Fc + TNFR-Fc (8–26 GC views per spleen, 2–13 GC views per MLN, 2–9 GC views per PP) represented as mean and error bars represent SEM. (C) Splenic GCs from UBI-GFP mice reconstituted with WT BM and treated as in (A). Dense, mesh structure of CD35+ FDCs indicated (#). Data are representative of 3 mice treated with saline (9–13 GC views per spleen) and 3 mice treated with LTβR-Fc + TNFR-Fc (10–17 GC views per spleen). (A and C) GCs outlined with white, dotted line based on BCL6+ GC B cell stain (inset only). Scale bar is 50μm.
FIGURE 6
FIGURE 6. CXCR4 blockade disrupts CRC distribution in the GC DZ
Confocal microscopy of CRC networks (arrowheads) in splenic and PP GCs of Cxcl12-GFP mice after treatment with a CXCR4 inhibitor for 12 hours. GCs outlined with white, dotted line based on BCL6+ GC B cells (inset only). Images are representative of 1 mouse treated with saline (6–39 GC views per tissue) and 1–2 mice treated with CXCR4 inhibitor (4–27 GC views per tissue). Similar results found with treatment for 24 hours (1 mouse treated with saline and 1 mouse treated with CXCR4 inhibitor). Scale bar is 50μm.

References

    1. Cyster JG, Ansel KM, Reif K, Ekland EH, Hyman PL, Tang HL, Luther SA, Ngo VN. Follicular stromal cells and lymphocyte homing to follicles. Immunological Reviews. 2000;176:181–193. - PubMed
    1. Allen CDC, Cyster JG. Follicular dendritic cell networks of primary follicles and germinal centers: phenotype and function. Seminars in Immunology. 2008;20:14–25. - PMC - PubMed
    1. El Shikh MEM, Pitzalis C. Follicular dendritic cells in health and disease. Front Immun. 2012;3:292. - PMC - PubMed
    1. Ngo VN, Korner H, Gunn MD, Schmidt KN, Riminton DS, Cooper MD, Browning JL, Sedgwick JD, Cyster JG. Lymphotoxin alpha/beta and tumor necrosis factor are required for stromal cell expression of homing chemokines in B and T cell areas of the spleen. J Exp Med. 1999;189:403–412. - PMC - PubMed
    1. Fu YX, Chaplin DD. Development and maturation of secondary lymphoid tissues. Annu Rev Immunol. 1999;17:399–433. - PubMed

Publication types

MeSH terms