. 2015 Nov 15;195(10):4973-85.
doi: 10.4049/jimmunol.1500651. Epub 2015 Oct 9.

Tissue-Resident NK Cells Mediate Ischemic Kidney Injury and Are Not Depleted by Anti-Asialo-GM1 Antibody

Affiliations

Tissue-Resident NK Cells Mediate Ischemic Kidney Injury and Are Not Depleted by Anti-Asialo-GM1 Antibody

Francisco Victorino et al. J Immunol. .

Abstract

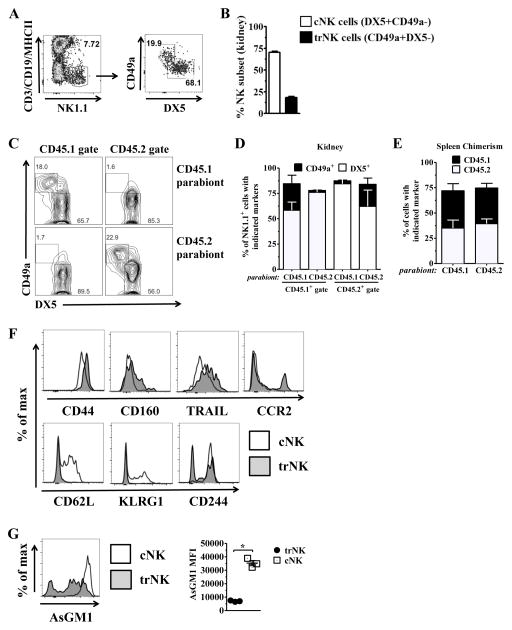
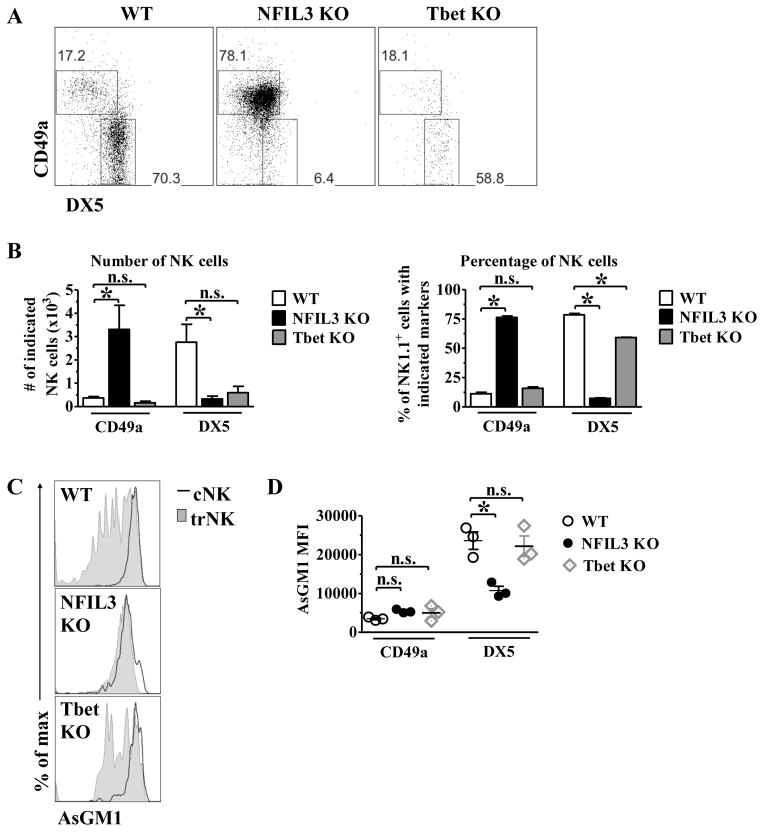
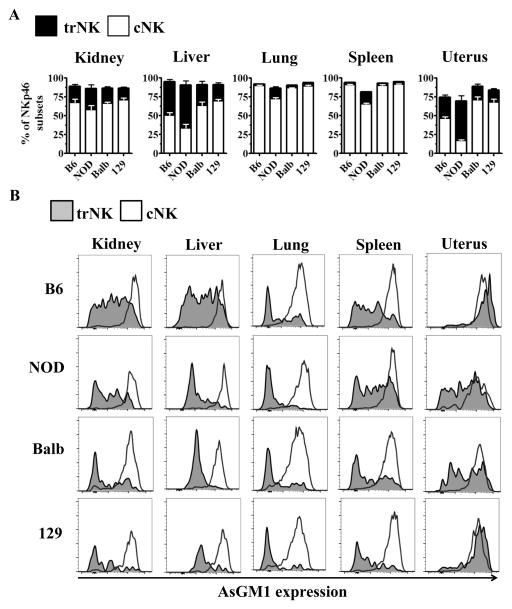
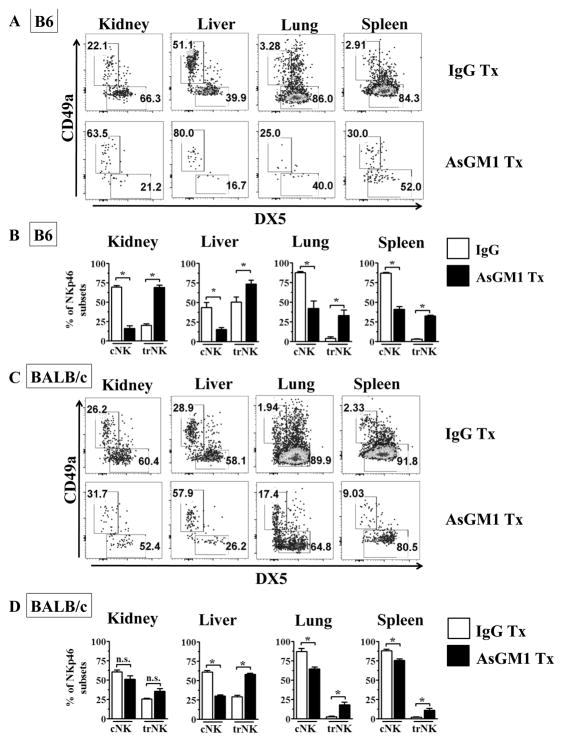
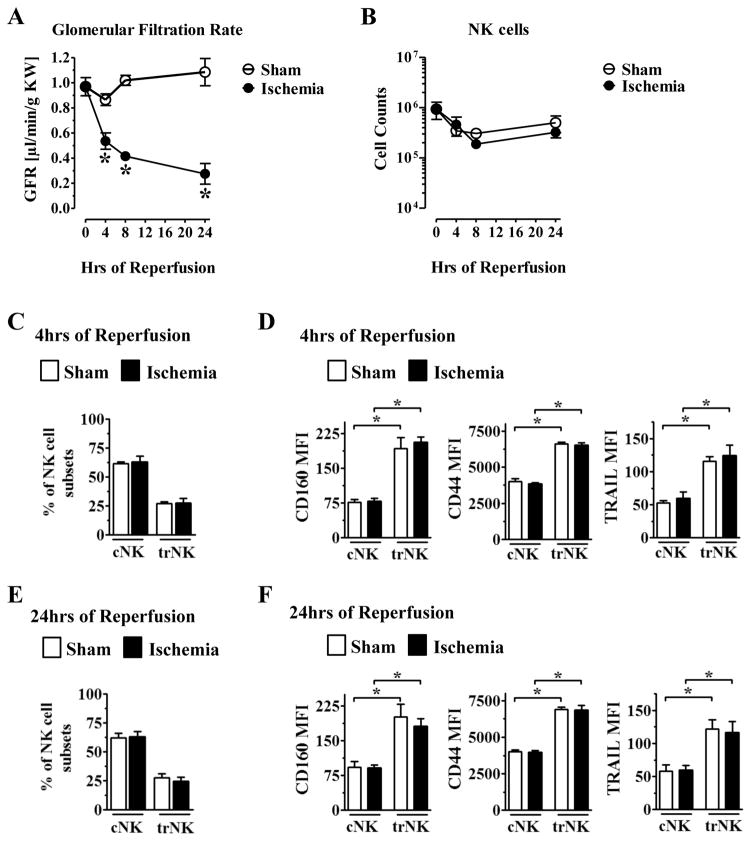
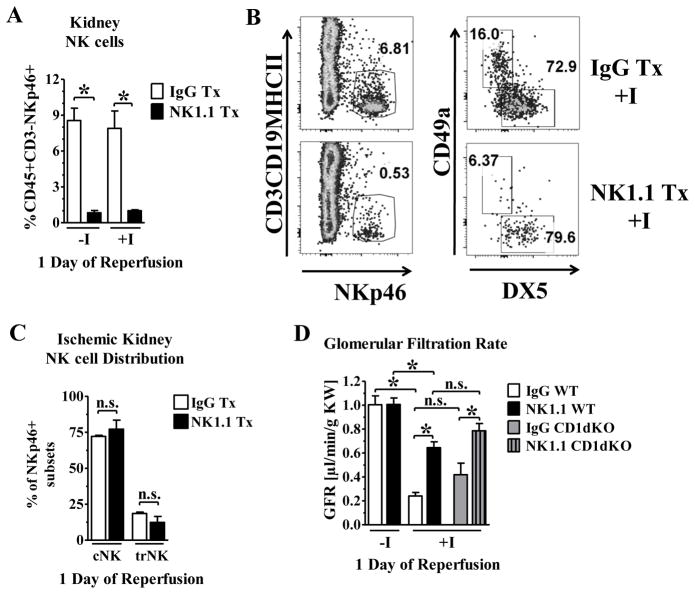
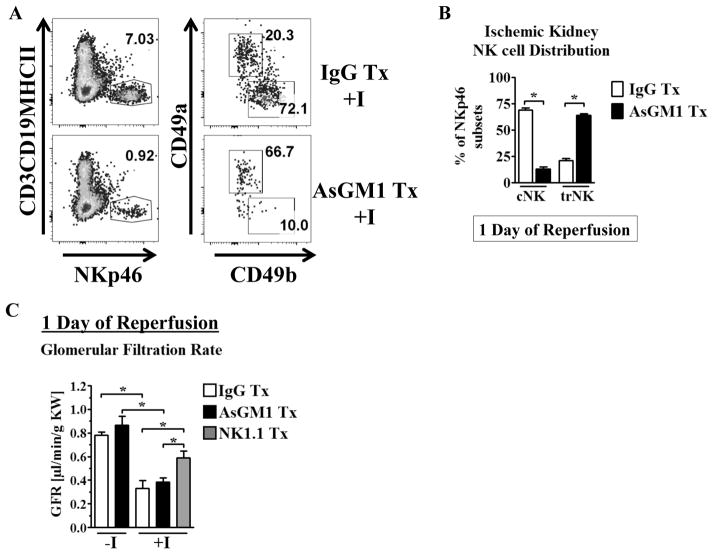
NK cells are innate lymphoid cells important for immune surveillance, identifying and responding to stress, infection, and/or transformation. Whereas conventional NK (cNK) cells circulate systemically, many NK cells reside in tissues where they appear to be poised to locally regulate tissue function. In the present study, we tested the contribution of tissue-resident NK (trNK) cells to tissue homeostasis by studying ischemic injury in the mouse kidney. Parabiosis experiments demonstrate that the kidney contains a significant fraction of trNK cells under homeostatic conditions. Kidney trNK cells developed independent of NFIL3 and T-bet, and they expressed a distinct cell surface phenotype as compared with cNK cells. Among these, trNK cells had reduced asialo-GM1 (AsGM1) expression relative to cNK cells, a phenotype observed in trNK cells across multiple organs and mouse strains. Strikingly, anti-AsGM1 Ab treatment, commonly used as an NK cell-depleting regimen, resulted in a robust and selective depletion of cNKs, leaving trNKs largely intact. Using this differential depletion, we tested the relative contribution of cNK and trNK cells in ischemic kidney injury. Whereas anti-NK1.1 Ab effectively depleted both trNK and cNK cells and protected against ischemic/reperfusion injury, anti-AsGM1 Ab preferentially depleted cNK cells and failed to protect against injury. These data demonstrate unanticipated specificity of anti-AsGM1 Ab depletion on NK cell subsets and reveal a new approach to study the contributions of cNK and trNK cells in vivo. In total, these data demonstrate that trNK cells play a key role in modulating local responses to ischemic tissue injury in the kidney and potentially other organs.


Figures

Figure 1
Figure 1. The kidney contains both conventional NK cells and tissue-resident NK cells characterized by differential AsGM1 expression
B6 mice were perfused with PBS, and kidney tissue was analyzed for the presence of CD49a+ tissue-resident (trNK) versus DX5+ conventional (cNK) NK cells. (A) Representative flow cytometric analysis to identify NK cells (NK1.1+CD3−CD19−MHC classII−) that were either trNK cells (CD49a+DX5−) or cNK cells (DX5+CD49a−). (B) Percent distribution of trNK and cNK cell subsets in the kidney. (C–E) Negligible exchange of kidney CD49a+DX5− NK cells in parabiotic mice. WT B6 (CD45.2) mice were parabiosed to congenic B6 (CD45.1) mice. At day 14 post-surgery, the spleen and kidney were harvested and flow cytometry performed. (C) Representative dot plots of the kidney gated on live CD3−CD19−NK1.1+ cells followed by a CD45.1 gate (left panels) and CD45.2 (right panels) as indicated for each parabiont. The percentages of CD49a+DX5− and CD49a−DX5+ cells are indicated in the dot plots. (D) The percentages of CD49a+DX5− and DX5+CD49a− cells in the kidney from C are shown in the stacked bar graph which represents 8 parabiotic pairs done three independent times. (E) The chimerism in the parabiotic pairs is measured by the percentage of CD45.1 and CD45.2 expression in the spleen depicted in the stacked bar graph. (F) Representative expression levels of cell surface proteins comparing trNK (shaded gray) and cNK (open red) cells, defined as in A. (G) Representative histogram of Asialo-GM1 expression for trNK and cNK cell subsets, with quantification of median fluorescent intensity on right. Data depict mean +/− SEM, with each data set containing data from 3–5 mice per group from independent experiments. Statistical significance indicated by *, p<0.05, as determined by unpaired t-test.
Fig. 2
Fig. 2. Kidney CD49a+DX5 NK cells develop independent of NFIL3 and Tbet
The kidney was isolated from WT, NFIL3 KO, and Tbet KO mice, stained, and analyzed by flow cytometry. (A) Representative dot plots were gated on live CD45+CD3CD19NK1.1+ and show the percentage of CD49a and DX5 expression. (B) The bar graphs depict the number (left panel) and percentage (right panel) of live CD45+CD3CD19NK1.1+ that express CD49a and DX5 in the kidney of WT, NFIL3 KO and Tbet KO mice. (C) The histograms indicate the expression of AsGM1 on gated CD45+CD3CD19NK1.1+ CD49a+ (shaded gray histogram, trNK) and CD45+CD3CD19NK1.1+ DX5+ (red line histogram, cNK). (D) The graph represents the mean fluorescence intensity of AsGM1 on CD49a+ and DX5+ on NK cells of WT (open circles), NFIL3 KO (filled circles), and Tbet KO (grey diamonds) mice. Experiments were performed three independent times. Statistical significance indicated by *, p<0.05, as determined by unpaired t-test between trNK and cNK cells within the same genotype.
Figure 3
Figure 3. Conventional and tissue-resident NK cells have differential expression of asialo-GM1 across multiple organs and genetic backgrounds
B6, NOD, BALB/c, and 129 mice were analyzed for the frequency of trNK and cNK cell subsets and the AsGM1 expression in these subsets. (A) Frequency of trNK and cNK cells was determined in multiple organs in various strains based on NK markers described in Fig. 1A. (B) AsGM1 expression in trNK (shaded gray) and cNK (open red) cells, with organ analyzed indicated at the top of each column, and genetic background indicated at the left of each row. Each data set has 3–5 mice per group from independent experiments.
Figure 4
Figure 4. Asialo-GM1 antibody treatment preferentially depletes cNK cells in B6 and BALB/c mice to enhance the relative frequency of trNK cells
B6 (A,B) and BALB/c (C,D) mice were treated rabbit IgG or Asialo-GM1 antibody day −1, and organs were harvested 1 day later, and analyzed for trNK and cNK cells (as in Fig. 1A). (A) Representative dot plots of NK cell subsets in B6 kidney, liver, lung, and spleen after IgG (top row) or AsGM1 (bottom row) treatment. (B) Frequency distribution of NK subsets in B6 mice across multiple organs based on CD49a and CD49b expression treated with IgG or AsGM1 antibody. (C) Representative dot plots of NK cell subsets in BALB/c kidney, liver, lung, and spleen after IgG (top row) or AsGM1 (bottom row) treatment. (D) Change in frequency distribution of NK subsets in BALB/c mice from multiple organs based on CD49a and CD49b expression treated with IgG or AsGM1. Each data set has 3–6 mice per group from independent experiments. Statistical significance indicated by *, p<0.05, as determined by unpaired t-test, comparing the frequency of either cNK or trNK in IgG versus AsGM1 antibody treated mice.
Figure 5
Figure 5. IRI in the kidney does not profoundly alter phenotype of trNK and cNK cells
B6 mice were subjected to either sham surgery (white bars) or 30m of ischemia (black bars) and analyzed as described here. (A) After 4, 8, and 24hr of reperfusion, kidney function was measured by GFR. (B) B6 mice were subjected to IRI and after 4, 8, and 24hr of reperfusion, NK cells were quantified using percoll purification and analyzed by flow cytometric analysis by staining for CD45+CD3−NK1.1+ expression. (C) B6 mice were subjected to sham or 30m of ischemia and analyzed for the frequency of trNK and cNK cells at 4hrs after IRI. (D) Flow cytometric analysis of mean expression of activation markers on trNK versus cNK cells at 4hrs after IRI in the kidney. Each data point has 4–6 mice per group. (E) B6 mice were subjected to sham or 30m of IRI surgeries and analyzed for the frequency of trNK and cNK cells at 24hrs after IRI. (F) FACS analysis of mean expression of activation markers on trNK versus cNK at 24hrs after IRI in the kidney. Each data set has 4–6 mice per group from independent experiments. Statistical significance indicated by *, p<0.05, as determined by unpaired t-test, comparing either values from the same time point between sham and ischemia (A), or by one-way ANOVA with significance indicated between cNK and trNK (D, F).
Figure 6
Figure 6. NK1.1 antibody treatment effectively depletes trNK and cNK cells in the kidney and attenuates kidney damage
B6 mice were treated with IgG or NK1.1 antibody on day −3, −1, subjected to IRI on day 0 and analyzed. (A) The frequency of NK cells in the kidneys of B6 mice that were treated with IgG or NK1.1 antibody and subjected to sham (−I) or IRI (+I) surgeries at 1 day post-reperfusion. (B–C) B6 ischemic kidneys treated with either IgG or NK1.1 antibody were analyzed by flow cytometric analysis for distribution of trNK versus cNK cells, with frequencies plotted in panel C. (D) Quantification of GFR in B6 and CD1d KO mice that received either IgG or NK1.1 antibody treatment in sham (−I) or ischemic (+I) conditions. Each data set has 3–6 mice per group from independent experiments. Statistical significance indicated by *, p<0.05, as determined by unpaired t-test (C), comparing IgG and NK1.1 treated mice or by one-way ANOVA with Bonferroni’s post-test correction for multiple comparisons (A, D). n.s., no significant difference.
Figure 7
Figure 7. Asialo-GM1 antibody preferentially depletes cNK cells, showing trNK cells promote AKI
B6 mice were treated with IgG or AsGM1 antibody on day −1 or treated with NK1.1 antibody day −3 and −1, then subjected to sham (−I) or IRI (+I) surgeries on day 0 and analyzed at day +1. (A) Representative dot plots of kidneys 24 hours after IRI from B6 mice that were treated with IgG or AsGM1 antibody, and analyzed for the frequency of NKp46+ NK cells (left) and the frequency of trNK and cNK cells in either IgG (top) or AsGM1 (bottom) treated mice. (B) Quantification of the frequency of trNK and cNK cells after IgG or AsGM1 antibody treatment in ischemic kidneys. (C) B6 mice treated with IgG, AsGM1, or NK1.1 antibody were given sham (−I) or IRI (+I) surgeries and glomerular filtration rate was measured 1 day post surgery. Each data set has 5–8 mice per group from independent experiments. Statistical significance indicated by *, p<0.05, as determined by unpaired t-test (B), comparing IgG and AsGM1 treated mice or by one-way ANOVA with Bonferroni’s post-test correction for multiple comparisons (C).

Similar articles

Cited by

References

    1. Bryceson YT, March ME, Ljunggren HG, Long EO. Synergy among receptors on resting NK cells for the activation of natural cytotoxicity and cytokine secretion. Blood. 2006;107:159–166. - PMC - PubMed
    1. Chiesa S, Tomasello E, Vivier E, Vely F. Coordination of activating and inhibitory signals in natural killer cells. Molecular immunology. 2005;42:477–484. - PubMed
    1. Vivier E, Nunes JA, Vely F. Natural killer cell signaling pathways. Science. 2004;306:1517–1519. - PubMed
    1. Vivier E, Tomasello E, Baratin M, Walzer T, Ugolini S. Functions of natural killer cells. Nature immunology. 2008;9:503–510. - PubMed
    1. Yokoyama WM. Inhibitory receptors signal activation. Immunity. 2008;29:515–517. - PubMed

Publication types