Multicenter Study
. 2016 Jan;37(1):67-80.
doi: 10.1002/hbm.23014. Epub 2015 Oct 10.

Large-scale brain network abnormalities in Huntington's disease revealed by structural covariance

Collaborators, Affiliations
Multicenter Study

Large-scale brain network abnormalities in Huntington's disease revealed by structural covariance

Lora Minkova et al. Hum Brain Mapp. 2016 Jan.

Abstract

Huntington's disease (HD) is a progressive neurodegenerative disorder that can be diagnosed with certainty decades before symptom onset. Studies using structural MRI have identified grey matter (GM) loss predominantly in the striatum, but also involving various cortical areas. So far, voxel-based morphometric studies have examined each brain region in isolation and are thus unable to assess the changes in the interrelation of brain regions. Here, we examined the structural covariance in GM volumes in pre-specified motor, working memory, cognitive flexibility, and social-affective networks in 99 patients with manifest HD (mHD), 106 presymptomatic gene mutation carriers (pre-HD), and 108 healthy controls (HC). After correction for global differences in brain volume, we found that increased GM volume in one region was associated with increased GM volume in another. When statistically comparing the groups, no differences between HC and pre-HD were observed, but increased positive correlations were evident for mHD, relative to pre-HD and HC. These findings could be explained by a HD-related neuronal loss heterogeneously affecting the examined network at the pre-HD stage, which starts to dominate structural covariance globally at the manifest stage. Follow-up analyses identified structural connections between frontoparietal motor regions to be linearly modified by disease burden score (DBS). Moderator effects of disease load burden became significant at a DBS level typically associated with the onset of unequivocal HD motor signs. Together with existing findings from functional connectivity analyses, our data indicates a critical role of these frontoparietal regions for the onset of HD motor signs.

Keywords: Huntington's disease; MRI; Pearson's correlation; functional networks; grey matter volume; structural covariance.


Figures

Figure 1
Figure 1
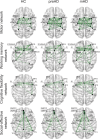
Structural covariance: within‐group effects Each subplot depicts a different network for each group with a visualization of the involved anatomy. Only positive correlations (green) were found significant (P < 0.05), as shown in the figure. HC = healthy controls; pre‐HD = presymptomatic HD; mHD = manifest HD; SMA = supplementary motor area; dPMC = dorsal premotor cortex; M1 = primary motor cortex; SPL = superior parietal lobe; S1 = primary somatosensory cortex; Thal = thalamus; Put = putamen; pMFC = posterior medial frontal cortex; IPG = intraparietal gyrus; IPS = intraparietal sulcus; AI = anterior insula; IFG = inferior frontal gyrus; IFG/BA45 = inferior frontal gyrus (caudal); IFG/BA44 = inferior frontal gyrus (rostral); MFG = middle frontal gyrus; IPC = inferior parietal cortex; ACC = anterior cingulate cortex; SCC = ; Prec = precuneus; TPJ = tempo‐parietal junction; Amy = amygdala; aMFG = anterior middle frontal gyrus; vStr = ventral striatum; DMPFC = dorso‐medial prefrontal cortex; VMPFC = ventromedial prefrontal cortex. [Color figure can be viewed in the online issue, which is available at http://wileyonlinelibrary.com.]
Figure 2
Figure 2
Structural covariance: between‐group differences Only significant correlations and networks are illustrated. A. Motor network (red): correlation between right dorsal premotor cortex (dPMC) and right superior parietal lobe (SPL). B. Working memory (green): left posterior medial frontal cortex (pMFC) and right rostral inferior frontal gyrus (IFG/BA44). C. Cognitive flexibility network (blue): inferior frontal gyrus (IFG) and supplementary motor area (SMA), right and left anterior insula (AI), as well as between left AI and right middle frontal gyrus (MFG). D. Social‐affective network (cyan): left dorsomedial prefrontal cortex (DMPFC) and left precuneus (Prec). Bar plots show the correlation coefficients (y‐axis) for each group (x‐axis). Whiskers represent the confidence intervals. Significant between‐group differences are marked with an asterisk (* P < 0.05, ** P < 0.001, two‐tailed, Bonferroni‐corrected). [Color figure can be viewed in the online issue, which is available at http://wileyonlinelibrary.com.]
Figure 3
Figure 3
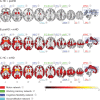
Whole‐brain VBM analysis: between‐group differences. A. HC > pre‐HD. B. Pre‐HD > mHD. C. HC > mHD. Results are reported at P = 0.05 family‐wise error (FWE)‐corrected and a cluster size k = 50. Regions and networks showing significant between‐group differences in structural covariance (see Fig. 2 above) are labeled. HC = healthy controls; pre‐HD = presymptomatic HD; mHD = manifest HD; AI = anterior insula; DMPFC = dorsomedial prefrontal cortex; MFG = middle frontal gyrus; IFG/BA44 = inferior frontal gyrus (rostral); Prec = precuneus; IFG = inferior frontal gyrus; SMA = supplementary motor area; S1 = primary somatosensory cortex; dPMC = dorsal premotor cortex; SPL = superior parietal lobe. [Color figure can be viewed in the online issue, which is available at http://wileyonlinelibrary.com.]
Figure 4
Figure 4
Moderation effects with the Johnson‐Neyman technique x‐axis: disease burden score (DBS), y‐axis: conditional indirect effects between right dorsal premotor cortex (rdPMC) and right superior parietal lobe (rSPL). A significant interaction effect is present when the confidence interval (dotted lines) is completely above (positive interaction) or below (negative interaction) the horizontal line at zero. Shaded area represents the region of significance (P < 0.05), indicating a positive interaction for all HD gene carriers with DBS above 346.

Similar articles

Cited by

References

    1. Alexander‐Bloch A, Giedd JN, Bullmore E (2013): Imaging structural co‐variance between human brain regions. Nat Rev Neurosci 14: 322–336. - PMC - PubMed
    1. Amft M, Bzdok D, Laird AR, Fox PT, Schilbach L, Eickhoff SB (2014): Definition and characterization of an extended social‐affective default network. Brain Struct Funct 220:1031–1049. - PMC - PubMed
    1. Ashburner J (2007): A fast diffeomorphic image registration algorithm. Neuroimage 38: 95–113. - PubMed
    1. Ashburner J, Friston KJ (2000): Voxel‐based morphometry‐The methods. Neuroimage 11: 805–821. - PubMed
    1. Ashburner J, Friston KJ (2005): Unified segmentation. Neuroimage 26: 839–851. - PubMed

Publication types

MeSH terms