. 2015 Oct 9;7(10):2896-912.
doi: 10.1093/gbe/evv187.

Deciphering Genome Content and Evolutionary Relationships of Isolates from the Fungus Magnaporthe oryzae Attacking Different Host Plants

Affiliations

Deciphering Genome Content and Evolutionary Relationships of Isolates from the Fungus Magnaporthe oryzae Attacking Different Host Plants

Hélène Chiapello et al. Genome Biol Evol. .

Abstract

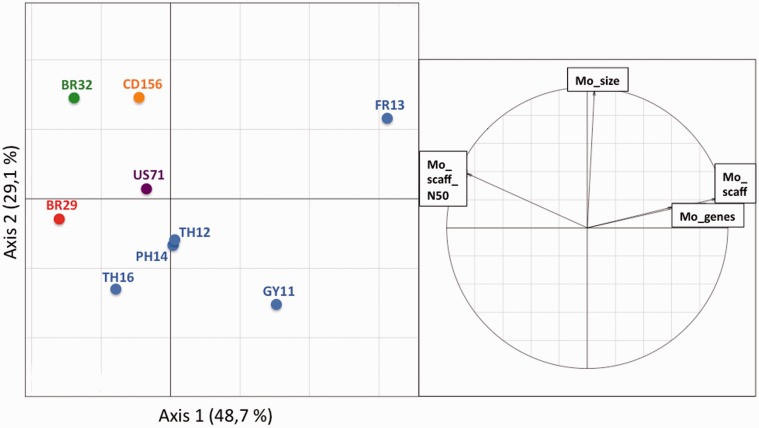
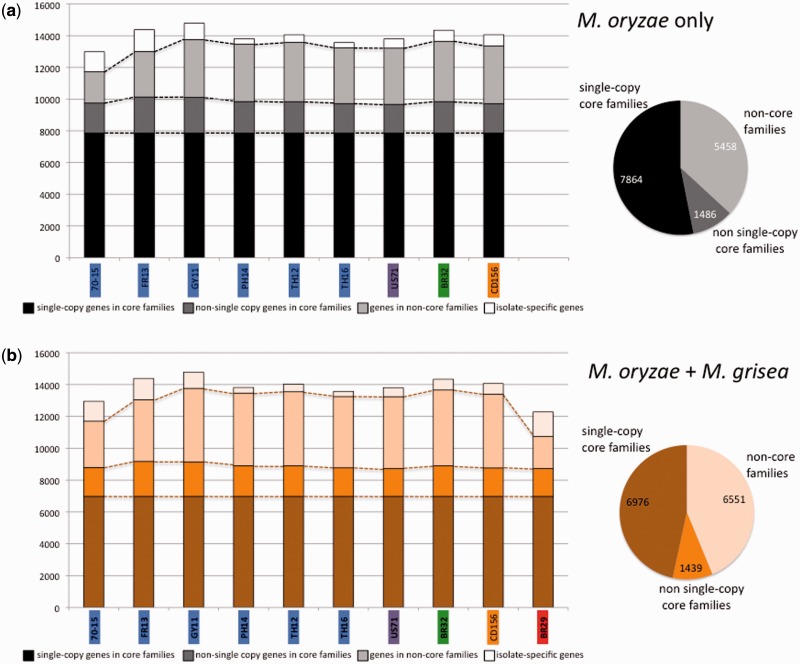
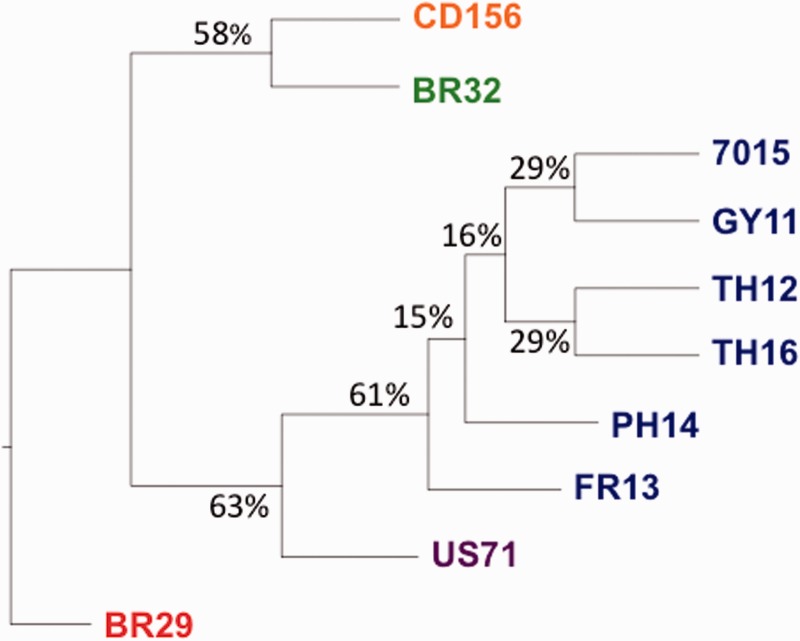
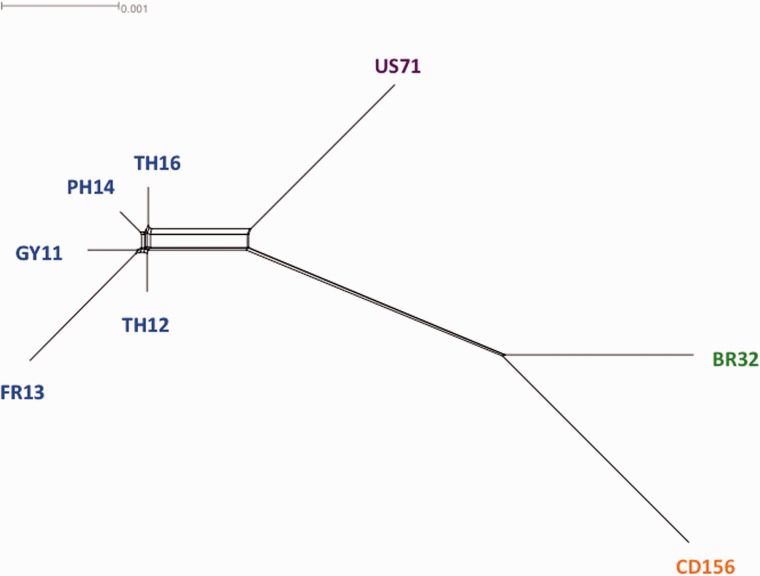
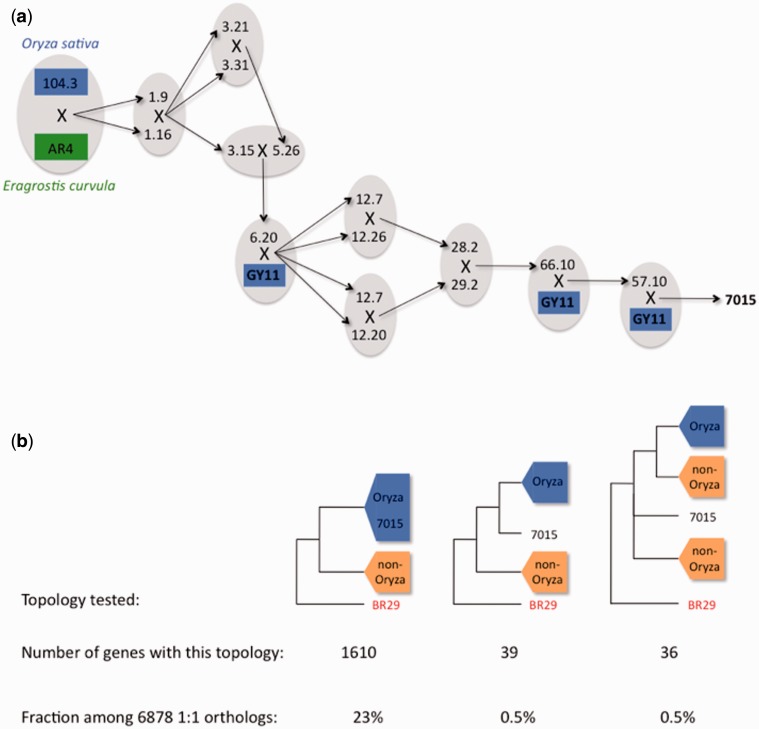
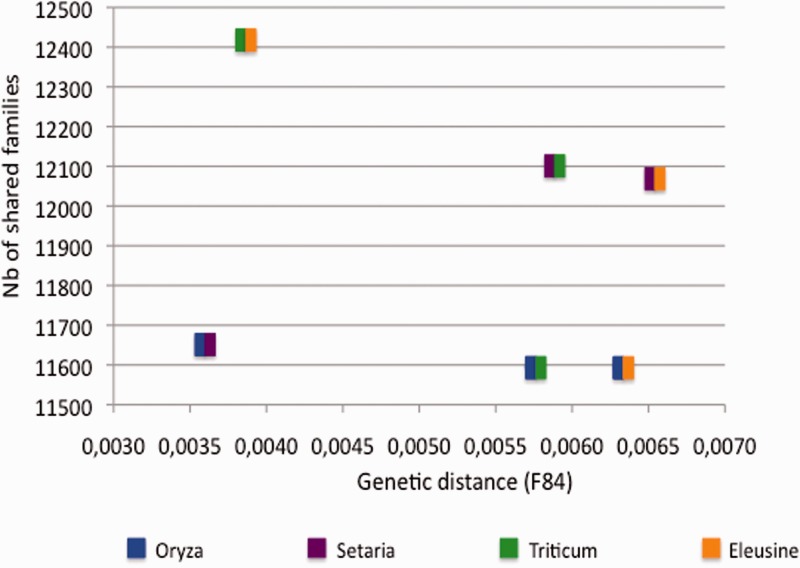
Deciphering the genetic bases of pathogen adaptation to its host is a key question in ecology and evolution. To understand how the fungus Magnaporthe oryzae adapts to different plants, we sequenced eight M. oryzae isolates differing in host specificity (rice, foxtail millet, wheat, and goosegrass), and one Magnaporthe grisea isolate specific of crabgrass. Analysis of Magnaporthe genomes revealed small variation in genome sizes (39-43 Mb) and gene content (12,283-14,781 genes) between isolates. The whole set of Magnaporthe genes comprised 14,966 shared families, 63% of which included genes present in all the nine M. oryzae genomes. The evolutionary relationships among Magnaporthe isolates were inferred using 6,878 single-copy orthologs. The resulting genealogy was mostly bifurcating among the different host-specific lineages, but was reticulate inside the rice lineage. We detected traces of introgression from a nonrice genome in the rice reference 70-15 genome. Among M. oryzae isolates and host-specific lineages, the genome composition in terms of frequencies of genes putatively involved in pathogenicity (effectors, secondary metabolism, cazome) was conserved. However, 529 shared families were found only in nonrice lineages, whereas the rice lineage possessed 86 specific families absent from the nonrice genomes. Our results confirmed that the host specificity of M. oryzae isolates was associated with a divergence between lineages without major gene flow and that, despite the strong conservation of gene families between lineages, adaptation to different hosts, especially to rice, was associated with the presence of a small number of specific gene families. All information was gathered in a public database (http://genome.jouy.inra.fr/gemo).

Keywords: adaptation to the host, rice blast, comparative genomics; http://genome.jouy.inra.fr/gemo.


Figures

<sc>Fig</sc>. 1.—
Fig. 1.—
Comparisons of genome metrics, genome sizes, and gene content among isolates after Burkholderia filtering. The principal components analysis was performed for the nine de novo sequenced genomes on the following variables, recalculated after Burkholderia filtering when necessary: Magnaporthe genome size (Mo_size), number of Magnaporthe scaffolds (Mo_scaff), N50 of Magnaporthe scaffolds (Mo_scaff_N50), and number of Magnaporthe genes (Mo_genes). Colors indicate the host of origin (for M. oryzae, blue: rice, purple: foxtail millet, green: wheat, orange: goose grass; for M. grisea, red: crab grass).
<sc>Fig</sc>. 2.—
Fig. 2.—
Organization of gene contents in the analyzed genomes, among the nine M. oryzae isolates (a) and among the whole data set (b). Histograms represent the distribution of genes in the different OrthoMCL families for each genome, and isolate-specific genes in white. Circles represent the proportion of OrthoMCL families. Colors on isolate names indicate host of origin (for M. oryzae, blue: rice, purple: foxtail millet, green: wheat, orange: goose grass; for M. grisea, red: crab grass).
<sc>Fig</sc>. 3.—
Fig. 3.—
Primary concordance tree obtained from 6,878 M. oryzae/grisea single-copy orthologs. The primary concordance tree topology features relationships inferred to be true for the largest proportion of genes according the BUCKy software. CFs are indicated at internal branches and represent the proportion of individual gene phylogenies out of 6,878 in which this branch is resolved, providing a measure of branch support. Colors of leaves indicated host of origin of isolates (for M. oryzae, blue: rice, purple: foxtail millet, green: wheat, orange: goose grass; for M. grisea, red: crab grass).
<sc>Fig</sc>. 4.—
Fig. 4.—
Network obtained from 6,878 M. oryzae orthologs. The NeighborNet method was applied to pairwise genetic distances (F84 distances obtained from the concatenated 6,878 orthologs aligned in codons). Colors of leaves indicated host of M. oryzae isolates (green: wheat, orange: goose grass, blue: rice, purple: foxtail millet). Isolates BR29 and 70-15 were not considered in this analysis.
<sc>Fig</sc>. 5.—
Fig. 5.—
Genealogy of the 70-15 reference strain and estimation of the fraction of the 70-15 genome introgressed from nonrice lineage. (a) 70-15 was issued from a parental cross between a rice isolate and an Eragrostis isolate, followed by several crosses, three of them involving the GY11 rice isolate. X indicates in vitro crosses; arrows starting from X point toward offsprings of this cross. (b) Number and proportion of single-copy orthologs, among the 6,878 genes tested, exhibiting one of the three topologies where a rice lineage was fully resolved, and representative of three contrasted situations: 70-15 ingroup of the rice lineage, 70-15 outgroup and sister of the rice lineage, and 70-15 outgroup and not sister of the rice lineage.
<sc>Fig</sc>. 6.—
Fig. 6.—
Number of OrthoMCL families shared among pairs of lineages as a function of the genetic distance between lineages. The F84 genetic distance between pairs of lineages was inferred from the Splitstree network (distance between the rice lineage and any other nonrice lineage: Mean distance between rice isolates and the corresponding nonrice isolate). The number of families shared between pairs of lineages was inferred from the OrthoMCL predictions (number of families shared between the rice lineage and any other nonrice lineage: Mean number of families shared between rice isolates and the corresponding nonrice isolate).

Similar articles

Cited by

References

    1. Aguileta G, et al. 2010. Finding candidate genes under positive selection in non-model species: examples of genes involved in host specialization in pathogens. Mol Ecol. 19:292–306. - PubMed
    1. Amyotte SG, et al. 2012. Transposable elements in phytopathogenic Verticillum spp.: insights into genome evolution and inter- and intra-specific diversification. BMC Genomics 13:314. - PMC - PubMed
    1. Anderson PK, et al. 2004. Emerging infectious diseases of plants: pathogen pollution, climate change and agrotechnology drivers. Trends Ecol Evol. 19:535–544. - PubMed
    1. Ané C, Larget B, Baum DA, Smith SD, Rokas A. 2007. Bayesian estimation of concordance among gene trees. Mol Biol Evol. 24:412–426. - PubMed
    1. Angiuoli SV, Salzberg SL. 2011. Mugsy: fast multiple alignment of closely related whole genomes. Bioinformatics 27:334–342. - PMC - PubMed

Publication types