. 2015 Oct 12:6:8400.
doi: 10.1038/ncomms9400.

Wall mechanics and exocytosis define the shape of growth domains in fission yeast

Affiliations

Wall mechanics and exocytosis define the shape of growth domains in fission yeast

Juan F Abenza et al. Nat Commun. .

Abstract

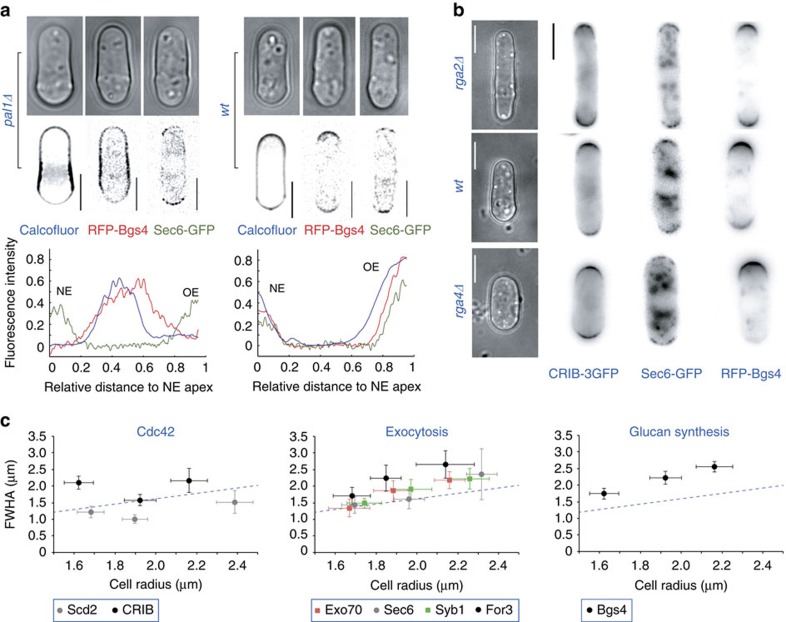
The amazing structural variety of cells is matched only by their functional diversity, and reflects the complex interplay between biochemical and mechanical regulation. How both regulatory layers generate specifically shaped cellular domains is not fully understood. Here, we report how cell growth domains are shaped in fission yeast. Based on quantitative analysis of cell wall expansion and elasticity, we develop a model for how mechanics and cell wall assembly interact and use it to look for factors underpinning growth domain morphogenesis. Surprisingly, we find that neither the global cell shape regulators Cdc42-Scd1-Scd2 nor the major cell wall synthesis regulators Bgs1-Bgs4-Rgf1 are reliable predictors of growth domain geometry. Instead, their geometry can be defined by cell wall mechanics and the cortical localization pattern of the exocytic factors Sec6-Syb1-Exo70. Forceful re-directioning of exocytic vesicle fusion to broader cortical areas induces proportional shape changes to growth domains, demonstrating that both features are causally linked.


Figures

Figure 1
Figure 1. Morphological evolution of cell growth domains in fission yeast.
(a) Transmitted light images illustrating the changes in OE and NE shape in a fission yeast cell throughout interphase. Left, cell immediately before NETO. Images are maximum intensity projections of z-stacks comprising the most equatorial 2 μm of the cell. Scale bar, 5 μm. (b) Average meridional curvature of the NE (red line) and OE (green line). The coloured areas around the averages correspond to the standard deviations. n=35 OEs and n=35 pre-NETO NEs were averaged. (c) Cell contours extracted from the time-lapse sequence in a. (d) Curvature kymographs showing a pointy OE keeping its curvature (top) and a hemispherical NE evolving into a pointy OE (bottom). The plots, corresponding to the ends of the cell depicted in a, display the meridional curvature as a ‘heat map' during 3 h with a 2-min resolution. One of n=25 OEs and one of n=18 NEs are shown. (e) Schematic illustration of the three morphogenetic transitions observed in S. pombe: (i) the deformation of the flat post-cytokinesis septum into a hemispherical NE (first arrow), (ii) the growth of the hemispherical NE into the pointy OE (second arrow) and (iii) the steady growth of the OE (third arrow).
Figure 2
Figure 2. A mechanical model of fission yeast growth.
(a) Elastic deformation of the cell wall following cell plasmolysis. The diagonal line indicates a ratio of 1:2 between the meridional and circumferential strains. Top: fluorescence of a Qdot-labelled cell before (left) and after (right) plasmolysis (Note: here and in other images contrast has been inverted for clarity). (b) Measured wall element displacements at OEs using fluorescent Qdots. Top left: temporal projection of a Qdot-labelled cell during growth. (c) Canonical wall expansion profile at the OE. The meridional and circumferential strain rates were inferred from the best fit of the wall displacement field shown in b. (d) Elastic properties space. Blue dots and ellipse: normalized Young's modulus (E/P) and Poisson's ratio (ν) inferred from the data points in a. White circle and error bars: best material properties inferred from the whole-cell simulations of e and f. Background colour map: fit between the canonical OE expansion profile and the growth simulations (j) for each pair [ν, E/P] (dark red: best fit). White level curve: sub-region of the space yielding a predicted expansion profile within the 95% confidence of the observed profile (star: point closest to the experimental elastic properties). (e) Contour of a plasmolysed cell (left) used as input to the elastic shell model. Numerical inflation of the plasmolysed cell yields a turgid cell geometry (blue) very similar to the observed cell (background: Qdot-labelled cell). (f) Simulation of the septum-NE transition with the relaxed septum shown as a dashed line. (g) Predicted NE curvature following the septum-NE transition (compare with Fig. 1b). (h) Morphogenetic model of cell ends where both wall incorporation and elastic deformation contribute. (i) Simulation of cell growth using the experimental wall areal expansion as growth input and mechanical build-up of circumferential anisotropy. Left: schematic of cell end curvature evolution through time at the simulated OE/NE (top/bottom). Right: simulated curvature kymographs for the OE/NE (top/bottom; compare with Fig. 1d). (j) Comparison of the canonical expansion profile (left) and the predicted expansion from the simulations (right). The areal expansion profiles (colour map) and expansion anisotropy (ellipses) are predicted precisely by the model.
Figure 3
Figure 3. Morphogenetic potential of cell end-distributed factors.
(a) Diagrammatic representation of the function of 11 key factors involved at different levels of the polarized growth cascade (black, polarity factors; green, exocytosis; blue, glucan synthesis). (b) Cortical OE distribution in vivo of the factors fluorescently labelled. The images are OAI sum projections (12 frames every 10 s). (c) Top panels: The symmetrized average OE distribution of each GFP-labelled marker (n=29). The darker grey area corresponds to the full-width at half-area (FWHA), a parameter quantifying the spread of a given marker in the apical membrane; the lighter grey area corresponds to the full-width at 95% area (FW95A), which defines the shape of the distribution along the membrane (see Supplementary Fig. 3 for the distributions' standard deviations). Bottom panels: Modelled OE morphologies obtained when using the average factor distribution as a proxy for new wall incorporation. Note how different factors belonging to similar machineries have similar distributions and lead to similar geometries, as quantitatively illustrated by their respective branch length in the dendrogram. The Areal distribution is inferred from the strain rate profiles of Fig. 2.
Figure 4
Figure 4. Wall mechanics and exocytosis suffice to drive growth domain morphology.
(a) Top: Sum intensity projection images of pal1Δ and wild-type cells stained with calcofluor white, which binds to the linear chains of β-1,3 glucan, or expressing RFP-Bgs4 and Sec6-GFP. Scale bars, 5 μm. Bottom: Quantitation of the fluorescence intensity of each of the three reporters in pal1Δ and wild-type. (b) Sum intensity projection images showing rga2Δ (top), wild-type (middle) and rga4Δ (bottom) cells expressing CRIB-3GFP, Sec6-GFP or RFP-Bgs4. Scale bars, 5 μm. Transmitted light images of the mutants and wild-type are depicted on the left. (c) Plots illustrating the average full-width half-area (FWHA) of the distribution of Cdc42 markers (CRIB-3GFP and Scd2-GFP; left), exocytosis markers (Sec6-GFP, Exo70-GFP, For3-3GFP and GFP-Syb1) and the glucan synthesis marker RFP-Bgs4 against the cell width in the mutants rga2Δ (left within each plot) and rga4Δ (right within each plot) and the wild-type (middle within each plot). n=26 cells per condition. The standard deviations are represented as crosses emerging from each average value (coloured shapes). The dashed line corresponds to the observed relationship between the FWHA of the wild-type wall expansion strains and the cell radius.
Figure 5
Figure 5. Exocytosis pattern and growth domain morphogenesis are causally linked.
(a) Cartoon describing the strategy chosen to re-direct GFP-Syb1-containing vesicles to the whole extension of the GBP-mCherry-CaaX-containing plasma membrane. (b) Forced re-directioning of exocytic vesicle fusion to broader areas of the plasma membrane causes proportional morphological changes to growth domains. Left: Images showing misshapen cells because of the ectopic distribution of GFP-Syb1 in a GBP-mCherry-CaaX background. Right: Plots depicting the average (thick line) curvature and GFP-Syb1 apical distribution of n=30 OEs (the thin lines represent the standard deviation). (c) Images showing the distribution of GBP-mCherry-CaaX in the absence of GFP-Syb1 (left) and the canonical curvature of wild-type OEs (right; this corresponds to the data displayed in Fig. 1b; n=29 OEs). (d) Images showing the distribution of GFP-Syb1 in the absence of GBP-mCherry-CaaX (left) and the canonical OE distribution of GFP-Syb1 in wild-type cells (right; this corresponds to the data displayed in Supplementary Fig. 3; n=29 OEs). Scale bars, 5 μm.
Figure 6
Figure 6. A biomechanical model explaining the morphological evolution of fission yeast cell growth domains through the cell cycle.
Cartoon summarizing the dual control of cell growth domain morphology by cell wall elasticity and Sec6-driven exocytosis through the cell cycle.

Similar articles

Cited by

References

    1. Caspar D. L. & Klug A. Physical principles in the construction of regular viruses. Cold Spring Harb. Symp. Quant. Biol. 27, 1–24 (1962). - PubMed
    1. Thompson D. W. On Growth and Form (Cambridge University Press, 1917).
    1. Llorente J. M. G., Hernández-Rojas J. & Bretón J. A minimal representation of the self-assembly of virus capsids. Soft Matter 10, 3560–3569 (2014). - PubMed
    1. Lecuit T. & Lenne P.-F. Cell surface mechanics and the control of cell shape, tissue patterns and morphogenesis. Nat. Rev. Mol. Cell Biol. 8, 633–644 (2007). - PubMed
    1. Abenza J. F., Chessel A., Raynaud W. G. & Carazo-Salas R. E. Dynamics of cell shape inheritance in fission yeast. PLoS ONE 9, e106959 (2014). - PMC - PubMed

Publication types

Substances

LinkOut - more resources