. 2016 Jun 23;35(25):3324-34.
doi: 10.1038/onc.2015.394. Epub 2015 Oct 12.

Tumour-suppression function of KLF12 through regulation of anoikis

Affiliations

Tumour-suppression function of KLF12 through regulation of anoikis

N Godin-Heymann et al. Oncogene. .

Abstract

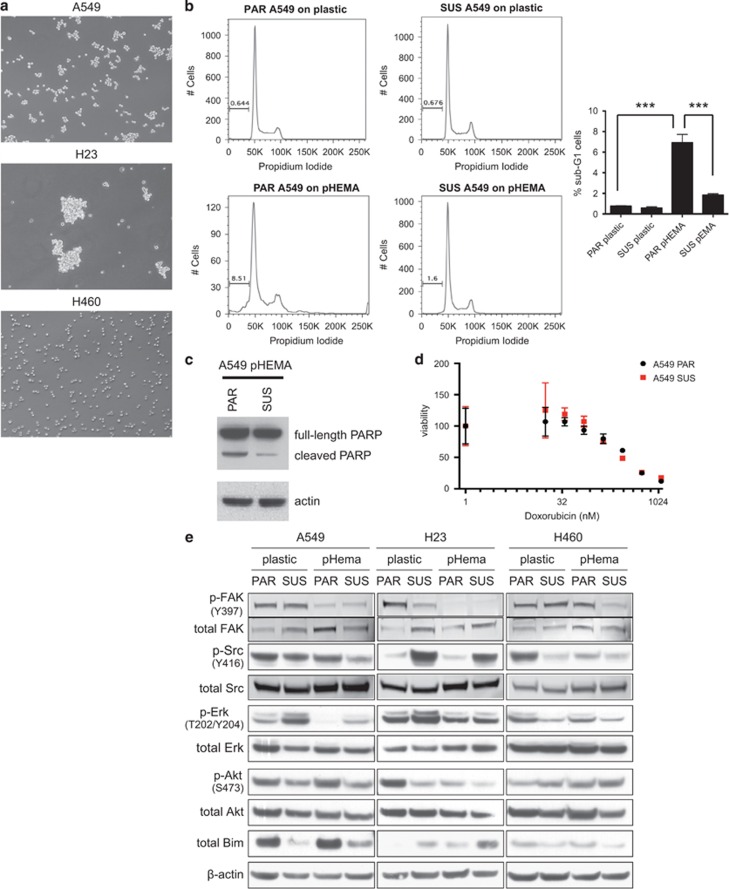
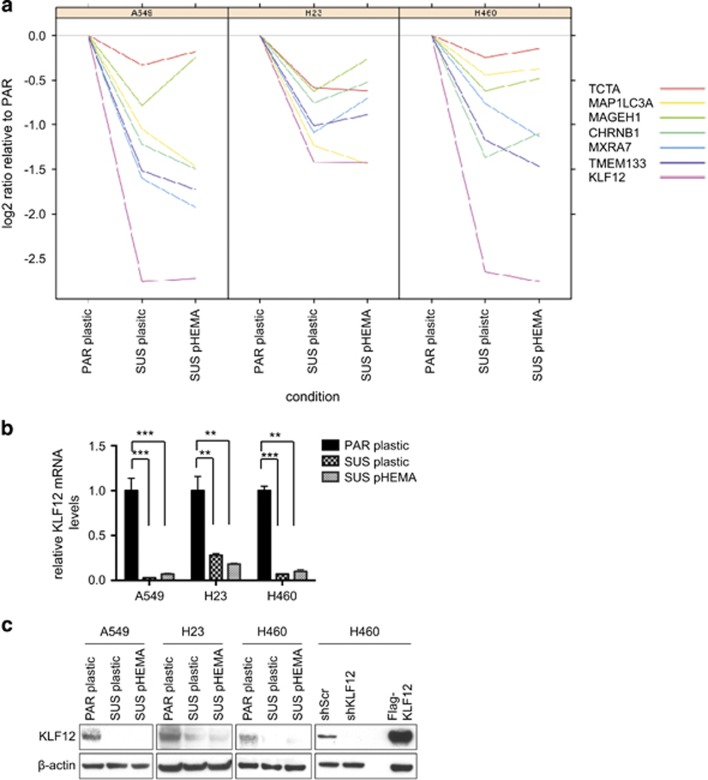
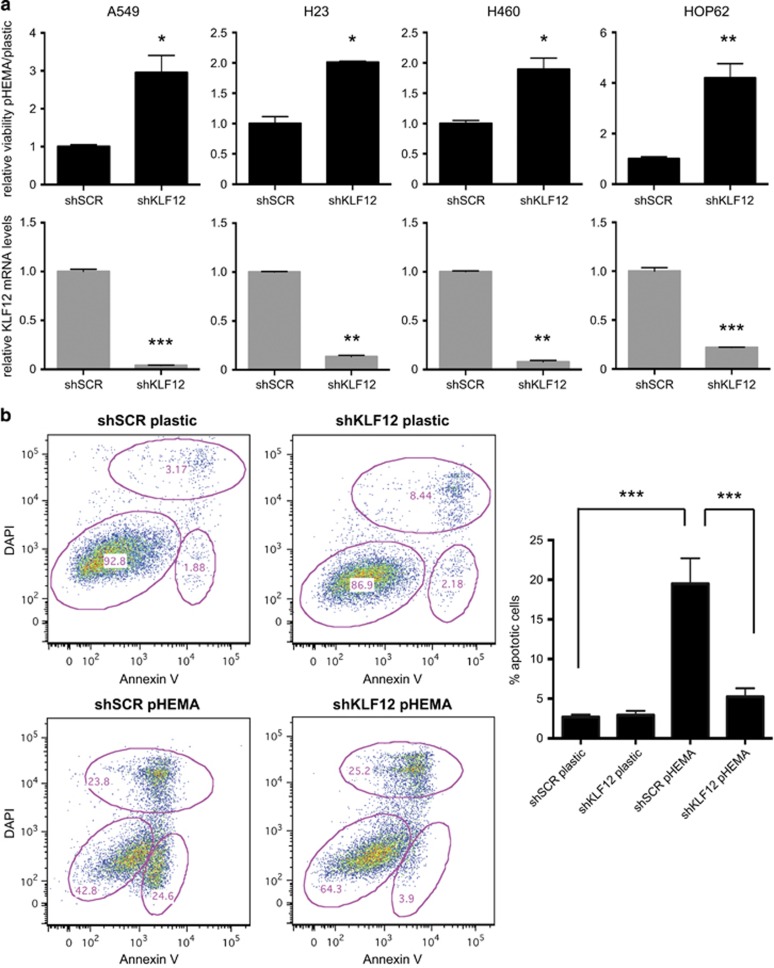
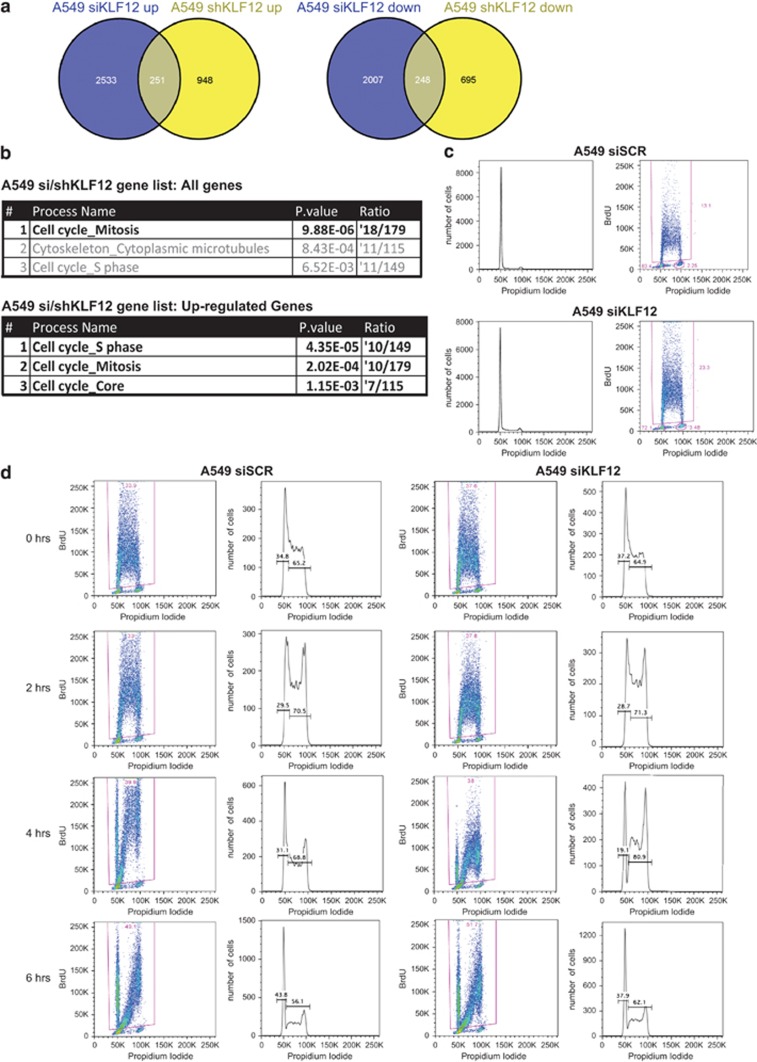
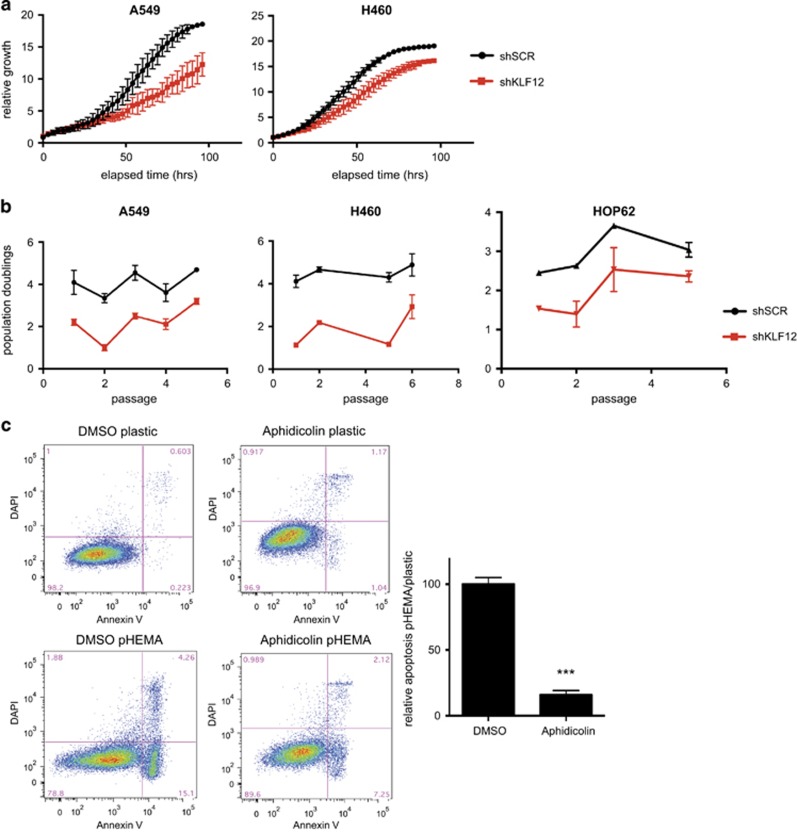
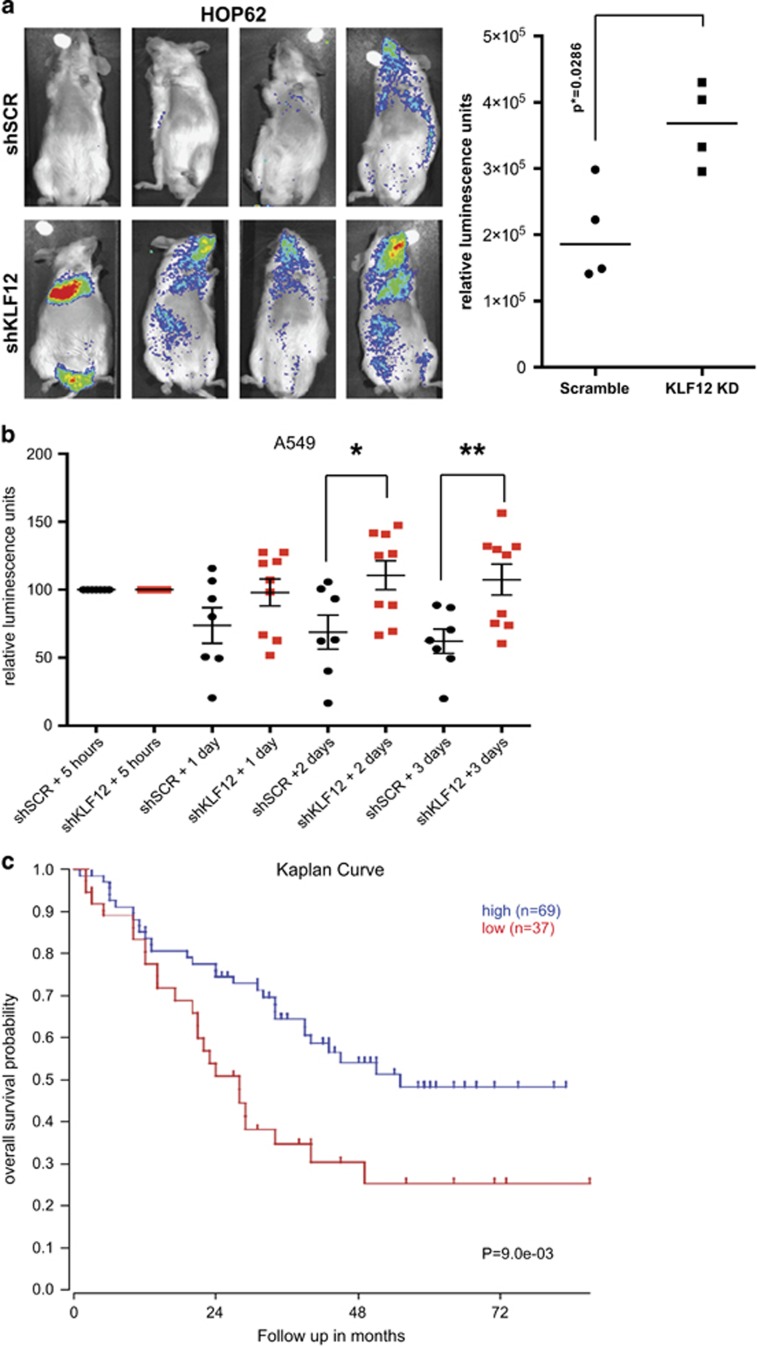
Suppression of detachment-induced cell death, known as anoikis, is an essential step for cancer metastasis to occur. We report here that expression of KLF12, a member of the Kruppel-like family of transcription factors, is downregulated in lung cancer cell lines that have been selected to grow in the absence of cell adhesion. Knockdown of KLF12 in parental cells results in decreased apoptosis following cell detachment from matrix. KLF12 regulates anoikis by promoting the cell cycle transition through S phase and therefore cell proliferation. Reduced expression levels of KLF12 results in increased ability of lung cancer cells to form tumours in vivo and is associated with poorer survival in lung cancer patients. We therefore identify KLF12 as a novel metastasis-suppressor gene whose loss of function is associated with anoikis resistance through control of the cell cycle.


Figures

Figure 1
Figure 1
Characterization of the suspension-derived sublines. (a) Light microscopy images (× 10) of A549, H23 and H460 SUS cell lines growing in suspension (on polyHEMA) for at least 48 h. (b) A549 SUS cells have reduced sub-G1 population relative to A549 PAR cells when grown on polyHEMA. DNA content assessed by fluorescence-activated cell sorting. The percentage of the sub-G1 population is labelled (left). Histogram showing an average sub-G1 apoptotic population (n=3) (right). Following a one-way analysis of variance, the P-values were determined to be 0.00003 comparing PAR plastic and PAR pHEMA and 0.000124 comparing PAR pHEMA and SUS pHEMA, n=3. (c) Apoptosis induction assessed by poly ADP-ribose polymerase cleavage in A549 PAR compared with attenuated response in SUS cells grown on polyHEMA. (d) A549 PAR and SUS cell lines were treated in triplicates with serial dilutions of doxorubicin in adherent conditions. (e) Cell signalling profiling of parental and suspension A549, H23 and H460. Cells were cultured for 48 h on plastic or on polyHEMA. Cell extracts were subjected to immunoblotting with p-FAK(Y397), p-Src (Y416), p-Erk (T202/Y204), p-Akt (S473), Bim, total FAK, Src, Erk, Akt and β-actin antibodies.
Figure 2
Figure 2
KLF12 mRNA levels are decreased in suspension-derived cell lines relative to parental cell lines. (a) A Nimblegen gene expression microarray analysis was performed on A549, H23 and H460 PAR cells in adherent conditions (PAR plastic) and their suspension derivatives grown in either adherent (SUS plastic) or suspension conditions (SUS polyHEMA). (b) Validating KLF12 reduced mRNA levels in triplicate in SUS-derived cell lines relative to PAR cells by Q-PCR. The P-values were determined using a Hochberg analysis and are 0.0005 and 0.00004 for A549 comparing PAR to PL and PAR to PH, respectively; 0.002 and 0.002 for H23 comparing PAR to PL and PAR to PH, respectively; and 0.0002 and 0.002 for H460 comparing PAR to PL and PAR to PH, respectively. (c) Western blotting showing KLF12 protein levels are decreased in SUS-derived cell lines relative to PAR cells.
Figure 3
Figure 3
KLF12 promotes anoikis. (a) KLF12 knockdown results in decreased viability in suspension. A549, H23, H460 and HOP62 PAR cells infected with shRNA against KLF12 or scramble control were grown in plastic or polyHEMA and their viability was assessed (upper panels). The statistical significance was determined by Hochberg analysis (n=3) and the P-values were 0.02, 0.02, 0.02 and 0.008 for A549, H23, H460 and HOP62, respectively. KLF12 knockdown efficiently was determined in triplicate by Q-PCR (lower panels), and the statistical significance was determined by Hochberg analysis. The P-values were 0.0005, 0.005, 0.005 and 0.0004 for A549, H23, H460 and HOP62, respectively. (b) KLF12 knockdown leads to decreased apoptosis in suspension. A549 PAR cells infected with shRNA against KLF12 or scramble control were grown in polyHEMA or plastic and the Annexin-positive apoptotic population was quantified by fluorescence-activated cell sorting analysis (left). Histogram showing the Annexin-positive population as an average of four independent experiments (right). Following a two-way analysis of variance, the P-values were determined to be 0.00008 looking at the KLF12 effect within polyHEMA and 0.0005 looking at the polyHEMA effect within shSCR (n=4).
Figure 4
Figure 4
KLF12 regulates the cell cycle. (a) Venn diagram representation of RNA seq profile of genes upregulated (left) or downregulated (right) upon knockdown by shRNA against KLF12 or by siRNA against KLF12 in A549 cells. (b) KLF12 regulates genes involved in cell cycle in A549 cells. Gene Ontology (GO) process enrichment of all genes differentially expressed in siKFL12 and shKLF12 groups that overlap (top) and those that overlap from upregulated groups following siKLF12 and shKLF12 knockdown (bottom). (c) KLF12 knockdown leads to decreased S phase population in A549 cells. Left: Cell cycle profiling of A549 fluorescence-activated cell sorting. Right: DNA content by propidium iodide staining and BrdU content by anti-BrdU staining. The numbers of BrdU-positive cells representing S phase were determined. (d) KLF12 knockdown results in a lag of exiting S phase in A549 cells. Cells were transfected with a pool of siRNA against KLF12 or scramble control. Forty-eight hours after siRNA transfection, BrdU was pulsed for 15 min and then chased with BrdU-free medium, and cells were fixed at the indicated time points. For each time point and sample, BrdU-positive cells cycling through S phase are gated (left), and the DNA content of those cells are depicted (right). The percentage of cells in early S phase and mid-late S phase is shown.
Figure 5
Figure 5
KLF12 regulates proliferation. (a) Reduced cell growth following KLF12 knockdown. Cell growth of A549 and H460 infected with shRNA against KLF12, as measured in real time in triplicate on an IncuCyte FLR (Essen Instruments) every 3 min. (b) Reduced proliferation in cells with decreased KLF12 levels. A549, H460 and HOP62 cells were infected with shRNA against KLF12 or scramble control (n=2 per condition). Cells were counted every 3–4 days by haemocytometer and re-seeded at a determined confluency. P-values for A549, H460 and HOP62 were 1.88 × 10⁻¹⁵, 1.10 × 10⁻¹⁸ and 4.15 × 10⁻⁷, respectively. The P-values were calculated by a three-way analysis of variance test using passage number and KLF12 status, nested within cell line, as the three covariates. Walt test was used against the interaction between cell line and KLF12 status. (c) Aphidicolin treatment reduces anoikis in A549. A549 cells were treated with 0.1 ug/ml Aphidicolin for 24 h after which the cells were grown either on plastic or polyHEMA for a further 48 h. The apoptotic population was determined by Annexin-V-positive staining (left). Histogram of the relative apoptotic population representing an average of two independent experiments in triplicates (right). T-test, P=0.0002, n=6.
Figure 6
Figure 6
Reduced KLF12 levels result in increased lung tumour formation and decreased survival. (a) KLF12 knockdown results in increased HOP62 cells tumour formation. Luminescence was presented visually (left panel), and its quantification is shown in a histogram (right panel). The P-value was derived from Mann–Whitney test. (b) KLF12 knockdown results in increased A549 cells in the lung. Luminescence was quantified after tail-vein injection at set time points. Values were normalized at the 5-h time point. (c) The lung cancer data set from Bild et al. was analysed using the R2 genomics analysis and visualization platform (http://hgserver1.amc.nl/cgi-bin/r2/main.cgi).

References

    1. Zhong X, Rescorla FJ. Cell surface adhesion molecules and adhesion-initiated signaling: understanding of anoikis resistance mechanisms and therapeutic opportunities. Cell Signal 2012; 24: 393–401. - PubMed
    1. Paoli P, Giannoni E, Chiarugi P. Anoikis molecular pathways and its role in cancer progression. Biochim Biophys Acta 2013; 1833: 3481–3498. - PubMed
    1. Frisch SM, Schaller M, Cieply B. Mechanisms that link the oncogenic epithelial-mesenchymal transition to suppression of anoikis. J Cell Sci 2013; 126: 21–29. - PMC - PubMed
    1. Guadamillas MC, Cerezo A, Del Pozo MA. Overcoming anoikis—pathways to anchorage-independent growth in cancer. J Cell Sci 2011; 124: 3189–3197. - PubMed
    1. Pucci B, Kasten M, Giordano A. Cell cycle and apoptosis. Neoplasia 2000; 2: 291–299. - PMC - PubMed

Publication types

MeSH terms

Substances