. 2015 Nov 10;5(5):918-931.
doi: 10.1016/j.stemcr.2015.09.004. Epub 2015 Oct 8.

Efficient Recombinase-Mediated Cassette Exchange in hPSCs to Study the Hepatocyte Lineage Reveals AAVS1 Locus-Mediated Transgene Inhibition

Affiliations

Efficient Recombinase-Mediated Cassette Exchange in hPSCs to Study the Hepatocyte Lineage Reveals AAVS1 Locus-Mediated Transgene Inhibition

Laura Ordovás et al. Stem Cell Reports. .

Erratum in

Abstract

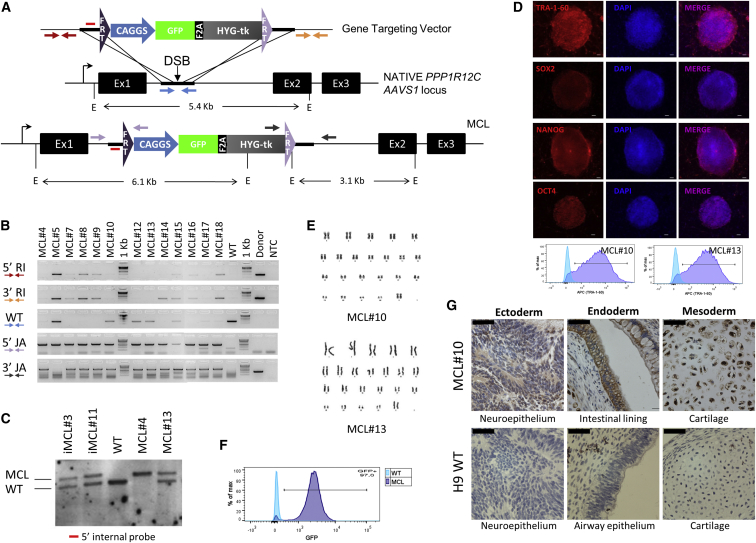
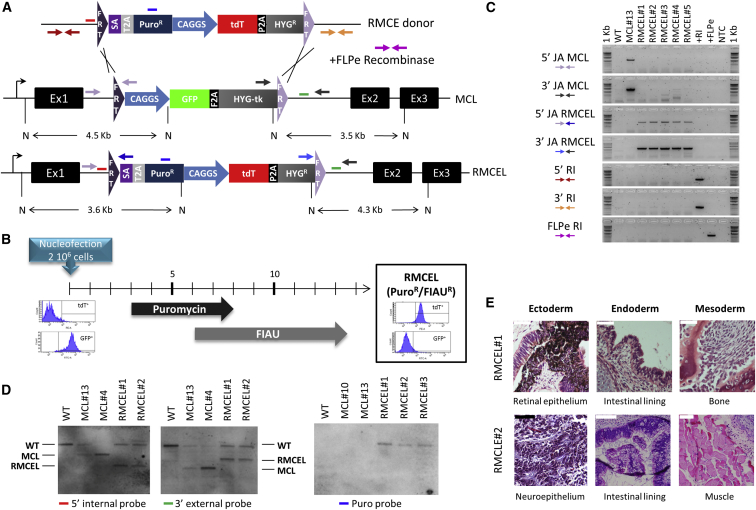
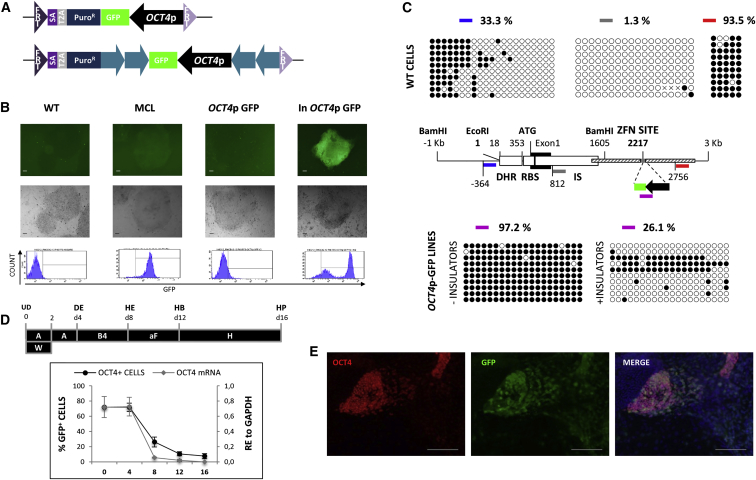
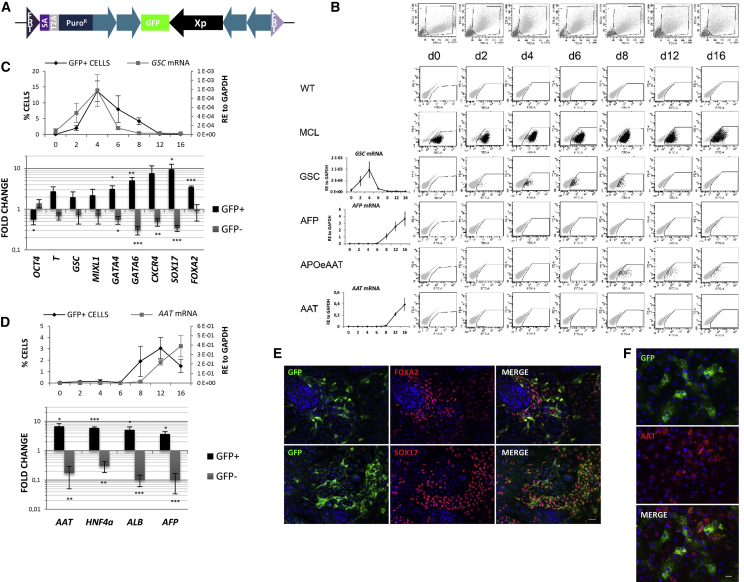
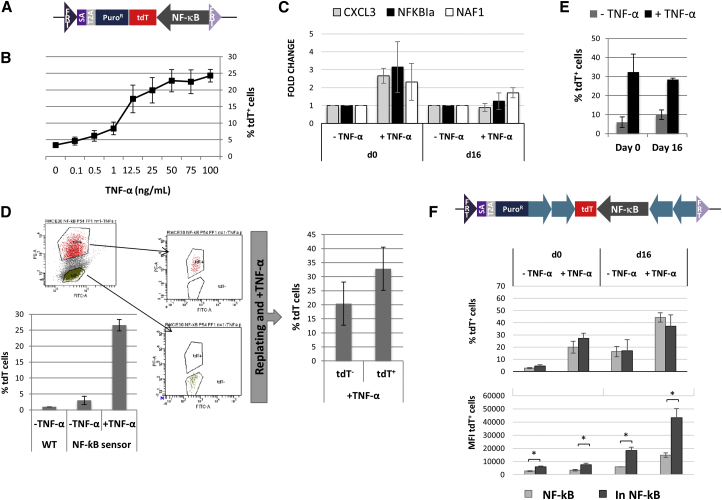
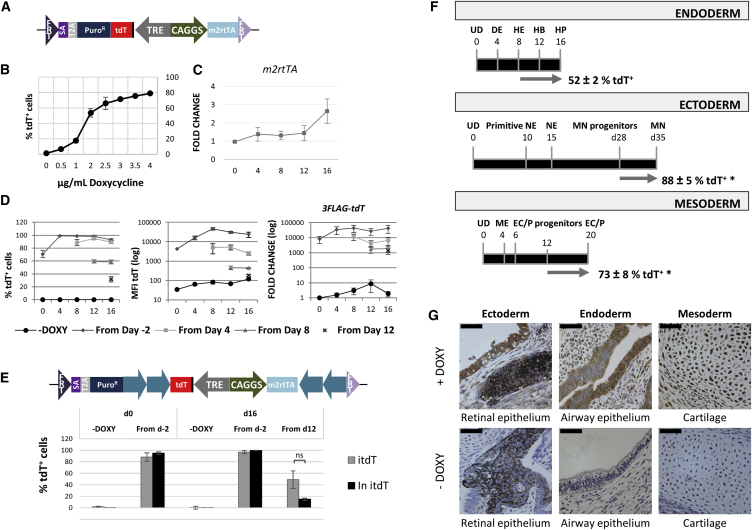
Tools for rapid and efficient transgenesis in "safe harbor" loci in an isogenic context remain important to exploit the possibilities of human pluripotent stem cells (hPSCs). We created hPSC master cell lines suitable for FLPe recombinase-mediated cassette exchange (RMCE) in the AAVS1 locus that allow generation of transgenic lines within 15 days with 100% efficiency and without random integrations. Using RMCE, we successfully incorporated several transgenes useful for lineage identification, cell toxicity studies, and gene overexpression to study the hepatocyte lineage. However, we observed unexpected and variable transgene expression inhibition in vitro, due to DNA methylation and other unknown mechanisms, both in undifferentiated hESC and differentiating hepatocytes. Therefore, the AAVS1 locus cannot be considered a universally safe harbor locus for reliable transgene expression in vitro, and using it for transgenesis in hPSC will require careful assessment of the function of individual transgenes.


Figures

Figure 1
Figure 1
Generation and Characterization of FRT-Containing Master Cell Lines in hESC (A) The AAVS1 gene targeting vector pZ:F3-CAGGS GPHTK-F, containing homology regions to the PPP1R12C locus (thick bars) and flanking FRTs (additional details in the Supplemental Information). The 5′ internal Southern blot probe (red bar) and fragment sizes of DNA digested with EcoRI (E) are indicated. (B) PCR genotyping of the master cell line (MCL) clones using primer sets depicted in (A) for 5′/3′ random integration (RI), amplification of the wild-type allele (WT), and 5′/3′ junction assays (JA). NTC, negative template control. (C) Southern blot of the wild-type cells and clones of iPSC (iMCL) and ESC (MCL) master cell lines. (D) Top: Expression of pluripotency markers of a representative MCL clone by immunocytochemistry (scale bars, 100 μm). Bottom: TRA-1-60 expression in two clones determined by FACS. (E) Karyogram of two hESC MCL clones. (F) GFP expression in undifferentiated hESC MCL after more than 20 passages. (G) Immunohistochemistry of GFP expression in teratoma of one MCL clone and WT cells (scale bars, 50 μm).
Figure 2
Figure 2
FLPe-Mediated RMCE Allows Generation of Fully Recombined Lines, Free of Random Integration, with 100% Efficiency (A) The RMCE donor vector pZ:F3-P CAGGS tdTPH-F (top) flanked by heterotypic FRT sequences (additional details in the Supplemental Information), original master cell line (MCL) and resulting RMCE line (RMCEL) are depicted. Red, blue, and green lines represent the 5′ internal, puromycin, and 3′ external Southern blot probes, respectively. Fragment sizes of DNA digested with NcoI (N) are indicated. (B) Timeline of RMCEL generation (all PuroR/FIAUR cells) and selection program with FACS histograms representing the cassette exchange. (C) PCR characterization of independent RMCELs using primer sets depicted in (A) for 5′/3′ JA of the MCL or RMCEL, 5′/3′ RI of the donor or FLPe-expressing vector. Wild-type (WT), MCL#13, and controls for random and FLPe integration (+RI and +FLPe) and no template control (NTC) samples were included. (D) Southern blotting of hESC wild-type (WT) cells, MCLs and RMCELs. (E) Teratoma formation assay of two RMCE lines. Scale bars, 50 μm (black) and 100 μm (white).
Figure 3
Figure 3
The AAVS1 Locus Mediates Transgene Silencing by DNA Methylation in Undifferentiated hESC (A) The RMCE donor vectors pZ:F3-P OCT4p-GFP-F (top) and pZ:F3-P (cHS4)X4 OCT4p-GFP-F (bottom) contain the OCT4p-GFP-polyA cassette without or with insulators (blue arrows), respectively. (B) Representative data of GFP expression levels (microscopy and FACS) in undifferentiated wild-type (WT), master cell line (MCL) and OCT4p without (OCT4p GFP) or with insulators (In OCT4p GFP). Scale bar, 100 μm. (C) Middle: representation of the AAVS1 locus adapted from Ogata et al. (2003). Thin line: 4-kb-long sequence containing the AAVS1 locus. Empty boxes: DNase hypersensitive region (DHR), Rep-binding site (RBS), and integration site (IS). Exon 1 (black box), homology regions used for homologous recombination (striped boxes), and ZFN targeting site (gray line) are depicted. Bisulfite sequenced regions analyzed in wild-type (WT) undifferentiated hESC: blue, gray, and red thick lines. The OCT4p-GFP RMCE lines (+/− insulators) and the fragment analyzed by bisulfite sequencing (purple line) are below the ZFN site. Top and bottom show representative panels and percentages of the results of bisulfite sequencing of the regions highlighted in the middle figure (n = 2 IEs). (D) Top, scheme of the hepatic differentiation protocol: Activin (A), W (Wnt3a), B4 (BMP4), aF (aFGF), H (HGF), UD (undifferentiated), DE (definitive endoderm), HE (hepatic endoderm), HB (hepatoblasts), and HP (hepatocytes). Bottom, OCT4 expression levels as percentage of GFP+ cells and mRNA expression levels (relative expression [RE], mean ± SEM of n = 3 IEs). (E) Immunocytochemistry of day 8 differentiated progeny. Scale bar, 100 μm.
Figure 4
Figure 4
Activity of Lineage-Specific Promoters during Hepatocyte Commitment (A) The RMCE donor vector pZ:F3-P (cHS4)X4 X-GFP-F contains lineage-specific promoters (Xp) flanked by insulators (blue arrows) driving GFP. (B) Timeline of cell morphology (SSC-FSC, top row) and GFP fluorescence (bottom rows) of wild-type (WT), master cell line (MCL), and RMCELs with the indicated promoters during the hepatocyte differentiation. Left graphs: endogenous mRNA expression levels of GSC, AFP, and AAT (relative expression, RE). (C and D) Top, average percentage of GFP+ cells during differentiation and endogenous mRNA expression levels in GSCp (C) and APOeAATp (D) RMCE lines. Bottom, mRNA expression profile of GFP+ and GFP sorted cells (relative gene expression to unsorted cells) from GSCp (day 4, C) and APOeAATp (day 12, D) RMCELs. Data as mean ± SEM of n = 3 IEs. (E and F) Immunocytochemistry of GSCp (day 4, E) and APOeAATp (day 12, F) RMCEL progenies. Areas with concentrated amount of positive cells are shown. Scale bar, 35 μm. p < 0.05, ∗∗p < 0.001, and ∗∗∗p < 0.0001 by Student’s t test.
Figure 5
Figure 5
Recombination of a Molecular Response Sensor in the AAVS1 Locus (A) The RMCE donor vector pZ:F3-P NF-κB-F contains an NF-κB response element followed by tdT. (B) NF-κB sensor response in undifferentiated cells with increasing doses of TNF-α. (C) Relative gene expression (to non-induced cells) of NF-κB direct target genes on days 0 or 16. (D) Sorting of tdT+ and tdT cells after induction and percentages of tdT+ cells in undifferentiated wild-type (WT) or NF-κB sensor-RMCEL before and after replating. (E) TNF-α response on day 0 and 16 of hepatocyte differentiation. (F) RMCE donor vector pZ:F3-P (cHS4)X4 NF-κB tdT-F containing insulators (blue arrows) and response to TNF-α induction (day 0 or 16) without (NF-κB) or with insulators (In NF-κB) determined by FACS and expressed as percentage of tdT+ cells and MFI. Data: mean ± SEM, n = 3 IEs. p < 0.05 by Student’s t test.
Figure 6
Figure 6
Inducible Expression from the AAVS1 Locus during Hepatocyte Differentiation (A) RMCE donor vector pZ:F3-P TetOn 3f-tdT-F for inducible expression (fully described in the Supplemental Information). (B) Percentage of tdT+ cells in response to increasing doses of DOXY for 48 hr. (C) Relative gene expression (to day 0) of m2rtTA during hepatocyte differentiation. (D) Percentage of tdT+ cells, expression levels of tdT per cell (mean fluorescence intensity, MFI) and 3FLAG-tdT mRNA (relative gene expression levels to –DOXY) with 3 μg/ml DOXY from the indicated time points. (E) RMCE donor vector pZ:F3-P (cHS4)X4 TetOn 3f-tdT-F with insulators (blue arrows). Response to 3 μg/ml DOXY, initiated at the indicated time points (on day 0 and 16), of the RMCELs without (itdT) and with insulators (In itdT) expressed as percentage of tdT+ cells. (F) Directed differentiation of itdT RMCEL toward endoderm (hepatocytes, HP), ectoderm (motor neurons, MN), and mesoderm (endothelial cells/pericytes, EC/P) with addition of 3 μg/ml DOXY during the last 7–8 days of differentiation (gray arrow). UD, undifferentiated cell; DE, hepatic endoderm; HE, hepatic endoderm; HB, hepatoblast; NE, neuroectoderm; ME, mesoderm. (G) Immunohistochemistry analysis of 3flag-tdT expression in teratomas of the itdT RMCEL in animals fed with or without DOXY. Scale bars, 50 μm. Data: mean ± SEM of n ≥ 3 IEs, p < 0.05 by Student’s t test. Statistical significance is not represented in (B) and (D); ns (not significant).

References

    1. Beard C., Hochedlinger K., Plath K., Wutz A., Jaenisch R. Efficient method to generate single-copy transgenic mice by site-specific integration in embryonic stem cells. Genesis. 2006;44:23–28. - PubMed
    1. Chang C.J., Bouhassira E.E. Zinc-finger nuclease-mediated correction of α-thalassemia in iPS cells. Blood. 2012;120:3906–3914. - PMC - PubMed
    1. Cherry S.R., Biniszkiewicz D., van Parijs L., Baltimore D., Jaenisch R. Retroviral expression in embryonic stem cells and hematopoietic stem cells. Mol. Cell. Biol. 2000;20:7419–7426. - PMC - PubMed
    1. Davis R.P., Ng E.S., Costa M., Mossman A.K., Sourris K., Elefanty A.G., Stanley E.G. Targeting a GFP reporter gene to the MIXL1 locus of human embryonic stem cells identifies human primitive streak-like cells and enables isolation of primitive hematopoietic precursors. Blood. 2008;111:1876–1884. - PubMed
    1. DeKelver R.C., Choi V.M., Moehle E.A., Paschon D.E., Hockemeyer D., Meijsing S.H., Sancak Y., Cui X., Steine E.J., Miller J.C. Functional genomics, proteomics, and regulatory DNA analysis in isogenic settings using zinc finger nuclease-driven transgenesis into a safe harbor locus in the human genome. Genome Res. 2010;20:1133–1142. - PMC - PubMed

Publication types