

Mice lacking GPR3 receptors display late-onset obese phenotype due to impaired thermogenic function in brown adipose tissue
- PMID: 26455425
- PMCID: PMC4601089
- DOI: 10.1038/srep14953
Mice lacking GPR3 receptors display late-onset obese phenotype due to impaired thermogenic function in brown adipose tissue
Abstract
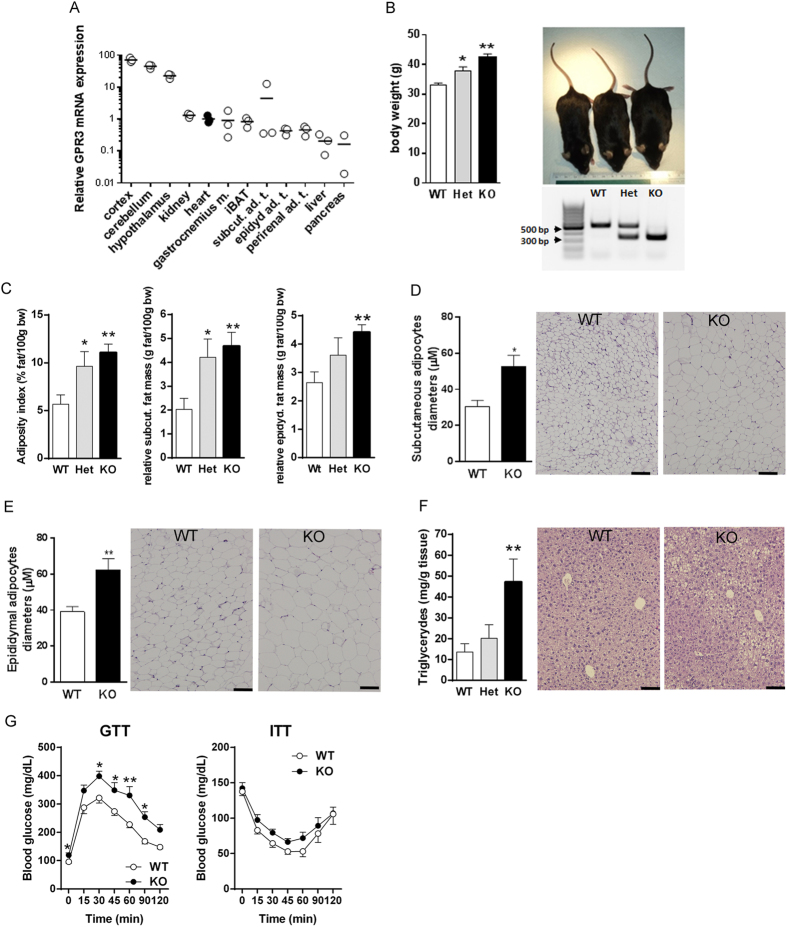
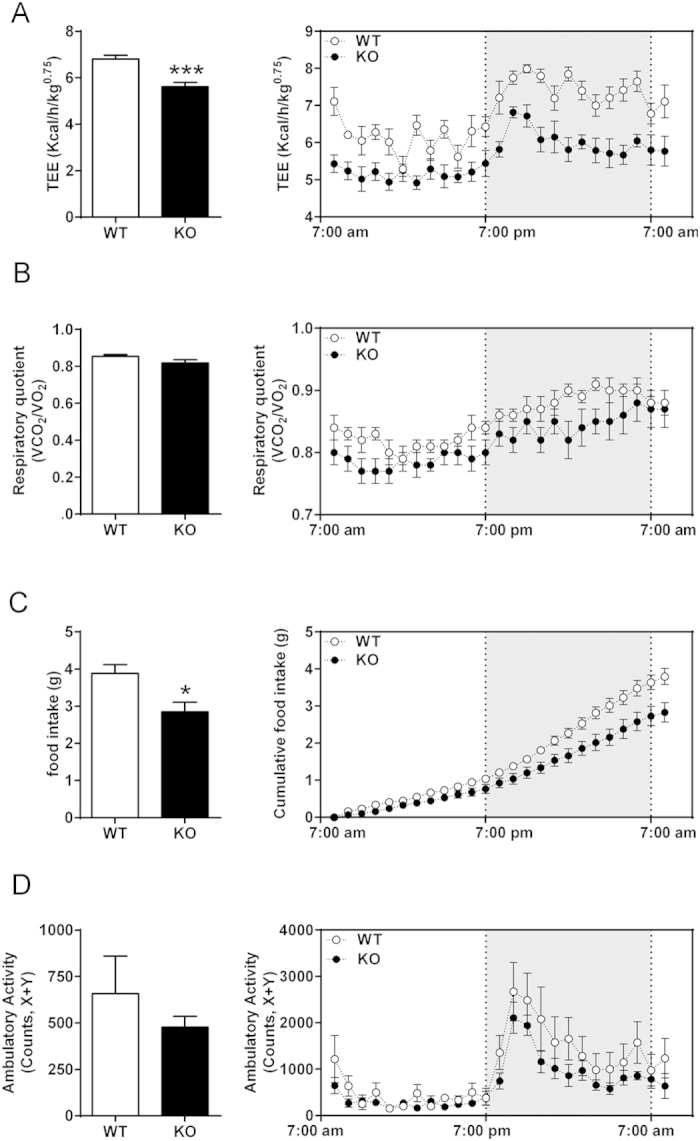
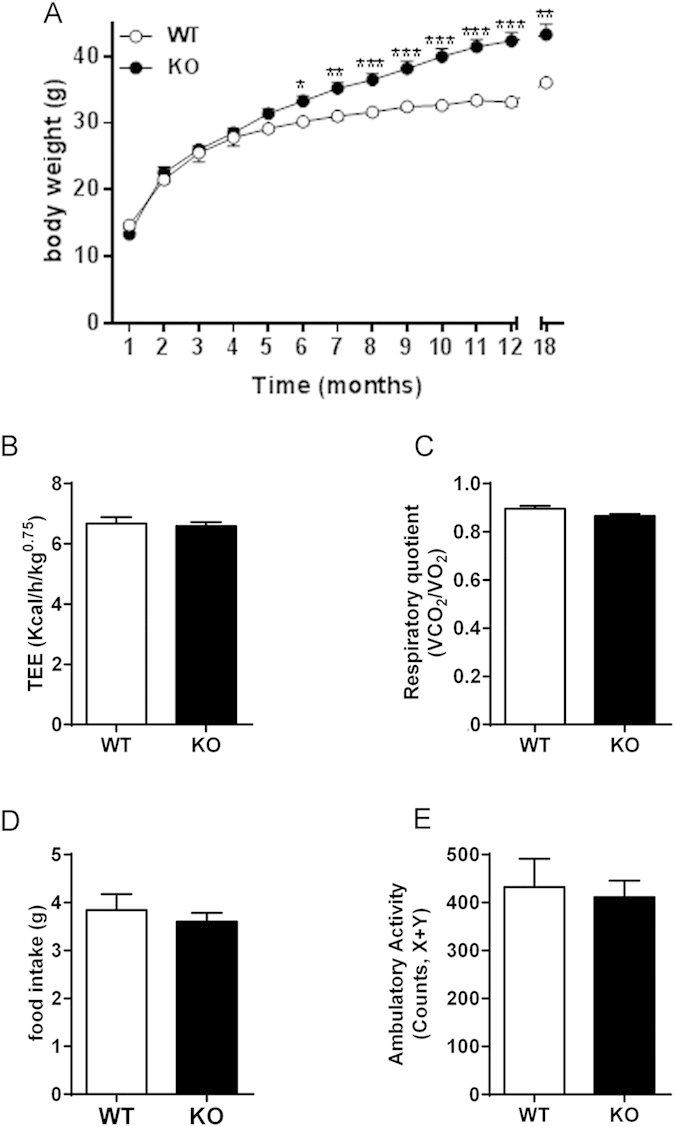
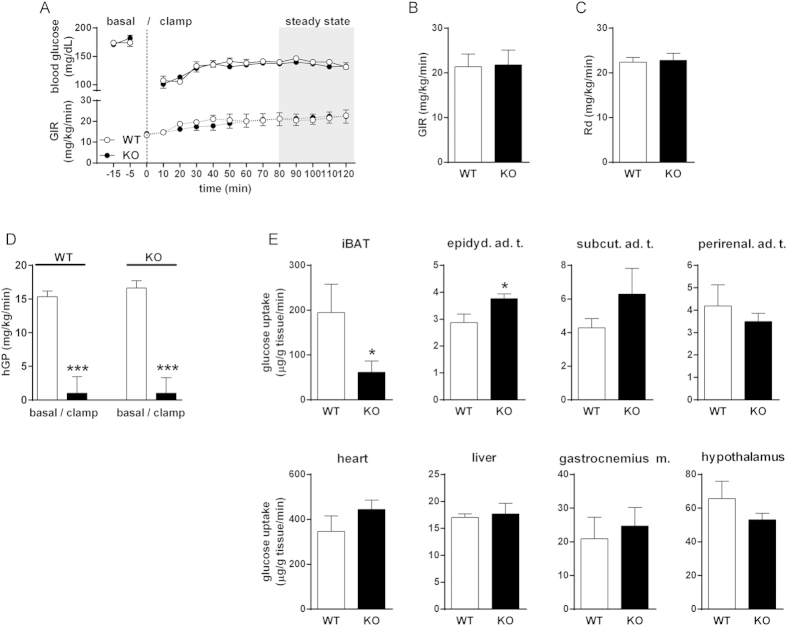
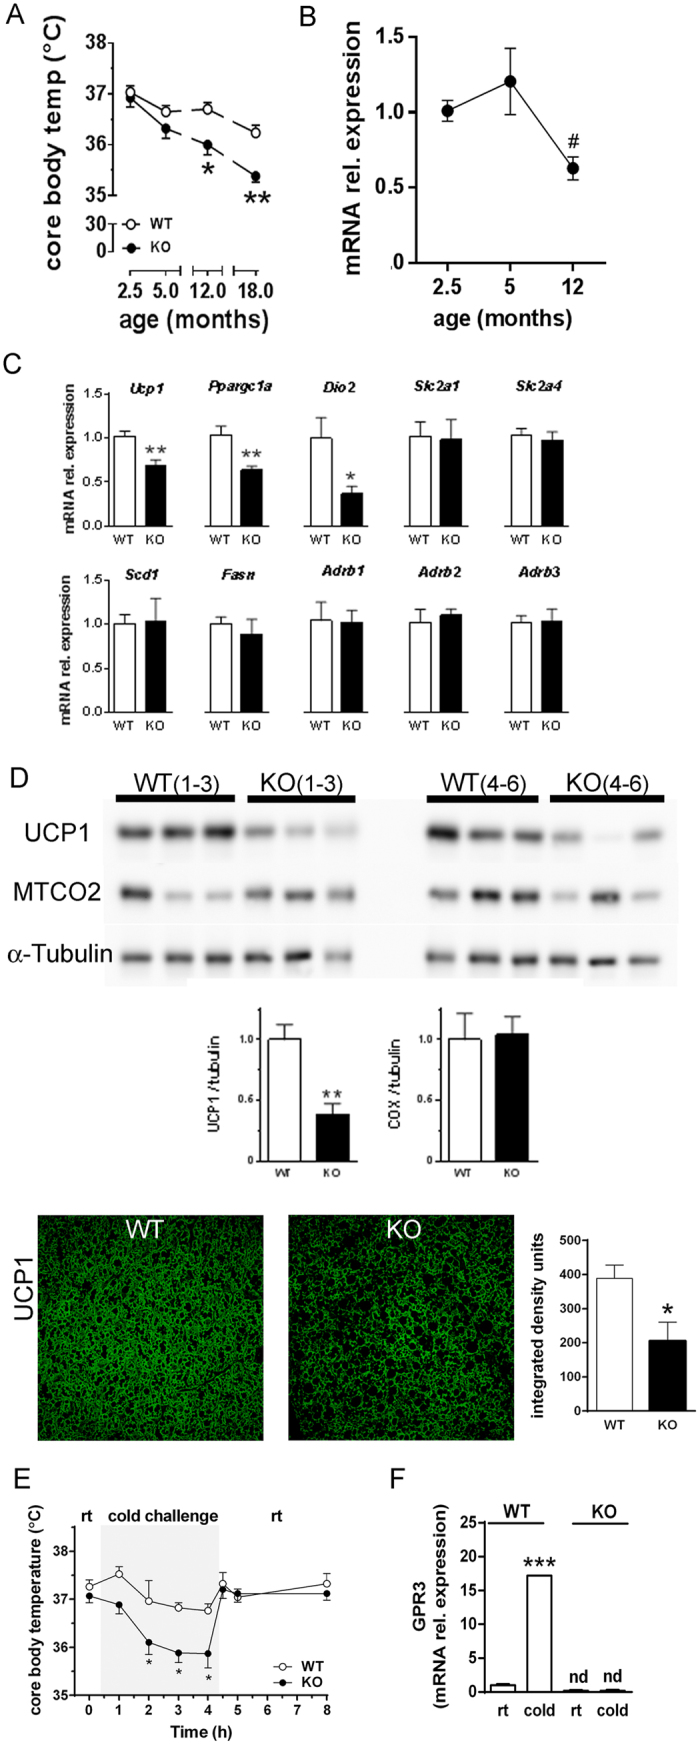
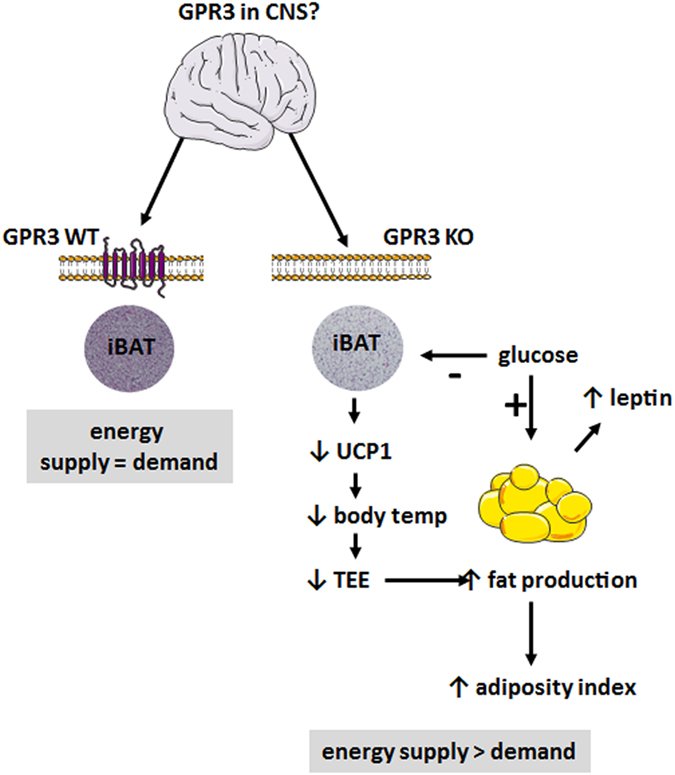
We report an unexpected link between aging, thermogenesis and weight gain via the orphan G protein-coupled receptor GPR3. Mice lacking GPR3 and maintained on normal chow had similar body weights during their first 5 months of life, but gained considerably more weight thereafter and displayed reduced total energy expenditure and lower core body temperature. By the age of 5 months GPR3 KO mice already had lower thermogenic gene expression and uncoupling protein 1 protein level and showed impaired glucose uptake into interscapular brown adipose tissue (iBAT) relative to WT littermates. These molecular deviations in iBAT of GPR3 KO mice preceded measurable differences in body weight and core body temperature at ambient conditions, but were coupled to a failure to maintain thermal homeostasis during acute cold challenge. At the same time, the same cold challenge caused a 17-fold increase in Gpr3 expression in iBAT of WT mice. Thus, GPR3 appears to have a key role in the thermogenic response of iBAT and may represent a new therapeutic target in age-related obesity.
Figures
Similar articles
-
Rorα deficiency and decreased adiposity are associated with induction of thermogenic gene expression in subcutaneous white adipose and brown adipose tissue.Am J Physiol Endocrinol Metab. 2015 Jan 15;308(2):E159-71. doi: 10.1152/ajpendo.00056.2014. Epub 2014 Nov 25. Am J Physiol Endocrinol Metab. 2015. PMID: 25424999
-
Inactivation of the adrenergic receptor β2 disrupts glucose homeostasis in mice.J Endocrinol. 2014 Jun;221(3):381-90. doi: 10.1530/JOE-13-0526. J Endocrinol. 2014. PMID: 24868110 Free PMC article.
-
Genetic variation in brown fat activity and body weight regulation in mice: lessons for human studies.Biochim Biophys Acta. 2014 Mar;1842(3):370-6. doi: 10.1016/j.bbadis.2013.04.025. Epub 2013 May 2. Biochim Biophys Acta. 2014. PMID: 23644163 Review.
-
Ablation of ghrelin receptor reduces adiposity and improves insulin sensitivity during aging by regulating fat metabolism in white and brown adipose tissues.Aging Cell. 2011 Dec;10(6):996-1010. doi: 10.1111/j.1474-9726.2011.00740.x. Epub 2011 Oct 12. Aging Cell. 2011. PMID: 21895961 Free PMC article.
-
Metabolic consequences of the presence or absence of the thermogenic capacity of brown adipose tissue in mice (and probably in humans).Int J Obes (Lond). 2010 Oct;34 Suppl 1:S7-16. doi: 10.1038/ijo.2010.177. Int J Obes (Lond). 2010. PMID: 20935668 Review.
Cited by
-
Characterization of Four Orphan Receptors (GPR3, GPR6, GPR12 and GPR12L) in Chickens and Ducks and Regulation of GPR12 Expression in Ovarian Granulosa Cells by Progesterone.Genes (Basel). 2021 Mar 27;12(4):489. doi: 10.3390/genes12040489. Genes (Basel). 2021. PMID: 33801713 Free PMC article.
-
Mice deficient of G-protein coupled receptor 3 (GPR3) developed severe experimental autoimmune uveitis (EAU) through increased effector T cell activities.J Immunol. 2025 Jul 1;214(7):1592-1602. doi: 10.1093/jimmun/vkaf099. J Immunol. 2025. PMID: 40381994 Free PMC article.
-
The development of diphenyleneiodonium analogs as GPR3 agonists.Bioorg Med Chem Lett. 2023 Oct 1;94:129427. doi: 10.1016/j.bmcl.2023.129427. Epub 2023 Aug 2. Bioorg Med Chem Lett. 2023. PMID: 37541631 Free PMC article.
-
Transcriptional control of intestinal cholesterol absorption, adipose energy expenditure and lipid handling by Sortilin.Sci Rep. 2018 Jun 13;8(1):9006. doi: 10.1038/s41598-018-27416-y. Sci Rep. 2018. PMID: 29899496 Free PMC article.
-
Identification of oleic acid as an endogenous ligand of GPR3.Cell Res. 2024 Mar;34(3):232-244. doi: 10.1038/s41422-024-00932-5. Epub 2024 Jan 29. Cell Res. 2024. PMID: 38287117 Free PMC article.
References
-
- Arterburn D. E., Crane P. K. & Sullivan S. D. The coming epidemic of obesity in elderly Americans. J. Am. Geriatr. Soc. 52, 1907–1912 (2004). - PubMed
-
- Flier J. S. Obesity wars: molecular progress confronts an expanding epidemic. Cell 116, 337–350 (2004). - PubMed
-
- Wang Y. C., McPherson K., Marsh T., Gortmaker S. L. & Brown M. Health and economic burden of the projected obesity trends in the USA and the UK. Lancet 378, 815–825 (2011). - PubMed
Publication types
MeSH terms
Substances
Grants and funding
LinkOut - more resources
Full Text Sources
Other Literature Sources
Medical
Molecular Biology Databases
Research Materials
