A fast cross-validation method for alignment of electron tomography images based on Beer-Lambert law
- PMID: 26455556
- PMCID: PMC4633358
- DOI: 10.1016/j.jsb.2015.10.004
A fast cross-validation method for alignment of electron tomography images based on Beer-Lambert law
Abstract
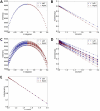
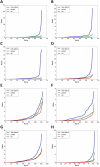
In electron tomography, accurate alignment of tilt series is an essential step in attaining high-resolution 3D reconstructions. Nevertheless, quantitative assessment of alignment quality has remained a challenging issue, even though many alignment methods have been reported. Here, we report a fast and accurate method, tomoAlignEval, based on the Beer-Lambert law, for the evaluation of alignment quality. Our method is able to globally estimate the alignment accuracy by measuring the goodness of log-linear relationship of the beam intensity attenuations at different tilt angles. Extensive tests with experimental data demonstrated its robust performance with stained and cryo samples. Our method is not only significantly faster but also more sensitive than measurements of tomogram resolution using Fourier shell correlation method (FSCe/o). From these tests, we also conclude that while current alignment methods are sufficiently accurate for stained samples, inaccurate alignments remain a major limitation for high resolution cryo-electron tomography.
Keywords: Alignment accuracy; Beer–Lambert law; Cross validation; Electron tomography; Inelastic scattering; Least square fitting.
Copyright © 2015 Elsevier Inc. All rights reserved.
Figures


Similar articles
-
Simultaneous determination of sample thickness, tilt, and electron mean free path using tomographic tilt images based on Beer-Lambert law.J Struct Biol. 2015 Nov;192(2):287-96. doi: 10.1016/j.jsb.2015.09.019. Epub 2015 Oct 9. J Struct Biol. 2015. PMID: 26433027 Free PMC article.
-
Conical Fourier shell correlation applied to electron tomograms.J Struct Biol. 2015 May;190(2):215-23. doi: 10.1016/j.jsb.2015.03.010. Epub 2015 Apr 3. J Struct Biol. 2015. PMID: 25843950
-
Implementation of a cryo-electron tomography tilt-scheme optimized for high resolution subtomogram averaging.J Struct Biol. 2017 Feb;197(2):191-198. doi: 10.1016/j.jsb.2016.06.007. Epub 2016 Jun 14. J Struct Biol. 2017. PMID: 27313000 Free PMC article.
-
Electron tomography in plant cell biology.Microscopy (Oxf). 2019 Feb 1;68(1):69-79. doi: 10.1093/jmicro/dfy133. Microscopy (Oxf). 2019. PMID: 30452668 Review.
-
Cryo-electron microscopy and cryo-electron tomography of nanoparticles.Wiley Interdiscip Rev Nanomed Nanobiotechnol. 2017 Mar;9(2). doi: 10.1002/wnan.1417. Epub 2016 Jun 23. Wiley Interdiscip Rev Nanomed Nanobiotechnol. 2017. PMID: 27339510 Review.
References
-
- Brandt SS. Markerless Alignment in Electron Tomography. In: Frank J, editor. Electron Tomography. Springer; New York, New York: 2006. pp. 187–215.
-
- Brandt SS, Ziese U. Automatic TEM image alignment by trifocal geometry. Journal of microscopy. 2006;222:1–14. - PubMed
-
- Braunfeld MB, Koster AJ, Sedat JW, Agard DA. Cryo automated electron tomography: towards high-resolution reconstructions of plastic-embedded structures. Journal of microscopy. 1994;174:75–84. - PubMed
-
- Cardone G, Grunewald K, Steven AC. A resolution criterion for electron tomography based on cross-validation. Journal of structural biology. 2005;151:117–129. - PubMed
Publication types
MeSH terms
Grants and funding
LinkOut - more resources
Full Text Sources
Other Literature Sources

