. 2015 Oct 12:3:44.
doi: 10.1186/s40168-015-0107-4.

Ecology of bacteria in the human gastrointestinal tract--identification of keystone and foundation taxa

Affiliations

Ecology of bacteria in the human gastrointestinal tract--identification of keystone and foundation taxa

Pål Trosvik et al. Microbiome. .

Abstract

Background: Determining ecological roles of community members and the impact of specific taxa on overall biodiversity in the gastrointestinal (GI) microbiota is of fundamental importance. A step towards a systems-level understanding of the GI microbiota is characterization of biotic interactions. Community time series analysis, an approach based on statistical analysis of changing population abundances within a single system over time, is needed in order to say with confidence that one population is affecting the dynamics of another.

Results: Here, we characterize biotic interaction structures and define ecological roles of major bacterial groups in four healthy individuals by analysing high-resolution, long-term (>180 days) GI bacterial community time series. Actinobacteria fit the description of a keystone taxon since they are relatively rare, but have a high degree of ecological connectedness, and are positively correlated with diversity both within and between individuals. Bacteriodetes were found to be a foundation taxon in that they are numerically dominant and interact extensively, in particular through positive interactions, with other taxa. Although community structure, diversity and biotic interaction patterns were specific to each individual, we observed a strong tendency towards more intense competition within than between phyla. This is in agreement with Darwin's limiting similarity hypothesis as well as a published biotic interaction model of the GI microbiota based on reverse ecology. Finally, we link temporal enterotype switching to a reciprocal positive interaction between two key genera.

Conclusions: In this study, we identified ecological roles of key taxa in the human GI microbiota and compared our time series analysis results with those obtained through a reverse ecology approach, providing further evidence in favour of the limiting similarity hypothesis first put forth by Darwin. Larger longitudinal studies are warranted in order to evaluate the generality of basic ecological concepts as applied to the GI microbiota, but our results provide a starting point for achieving a more profound understanding of the GI microbiota as an ecological system.


Figures

Fig. 1
Fig. 1
Genus level bacterial interactions for I1. The heat map describes the strength and direction (β i,j in Eq. 1) of highly significant interactions. Dependent variables are along the y axis and independent variables along the x axis, i.e. if you follow the column of given genus upward from the x axis until you reach a coloured cell, that cell indicates the effect of the given genus (dependent) on the genus indicated on the y axis (independent). The colour key on the right-hand side indicates the sign and magnitude of interactions that were significant at the 99 % confidence level. Cells representing non-significant relationships are black. Genus names are coloured according to phylum provenance: black Actinobacteria, red Bacteroidetes, green Firmicutes, blue Proteobacteria, light blue Tenericutes, and pink Verrucomicrobia. Note that according to the NCBI taxonomy database, the family Erysipelotrichaceae and the genus Holdemania are classified as Firmicutes. Here, and throughout, we have remained consistent with the Greengenes classification of these taxa as Tenericutes
Fig. 2
Fig. 2
Ranked genus level degree of connectedness in I1. The bar charts show the total number of significant negative and positive genus level interactions. Dependent (acted upon) interactions are shown in a while independent (acting on) interactions are in b. Genus names are coloured according to phylum provenance: black Actinobacteria, red Bacteroidetes, green Firmicutes, blue Proteobacteria, light blue Tenericutes and pink Verrucomicrobia
Fig. 3
Fig. 3
Prevalence of observed pairwise interaction categories. The categories are indicated on the x axis: cooperation (+/+), competition (−/−), commensalism (+/0, with zero being a non-significant interaction) and amensalism (−/0). The y axis indicates the number of significant interactions in the specified categories (Additional file 1: Figure S11) relative to the total number of pairwise interactions identified in an individual (i.e. the number of pairwise interactions in which at least one taxon in a given pair interacts with the other)
Fig. 4
Fig. 4
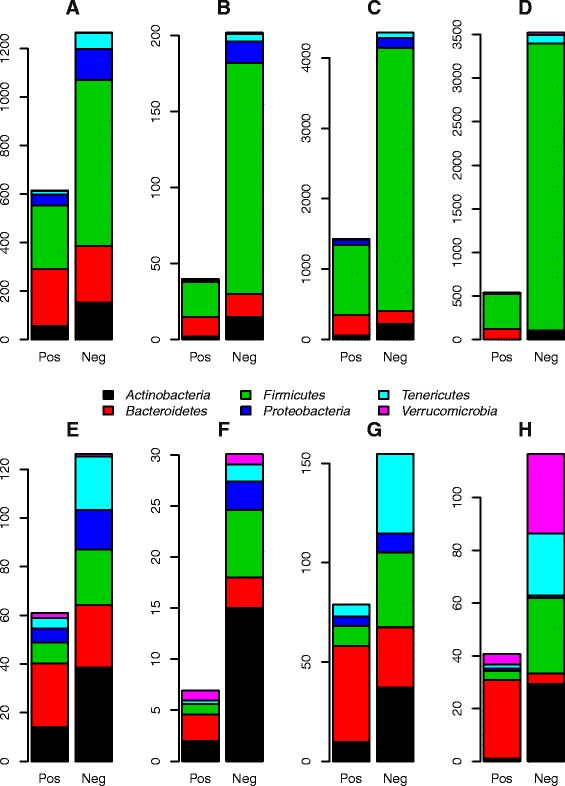
Total and mean connectedness of six main phyla in I1-4. ad show counts of positive and negative interactions significant at the 99 % confidence level for I1-4, respectively. eh show the mean connectedness of the phyla, i.e. the counts in ad divided by the number of observed genera within the respective phyla in each individual. Each bar combines interactions viewed both as dependent and independent. Dependent and independent interactions can be seen separately in Additional file 1: Figure S16
Fig. 5
Fig. 5
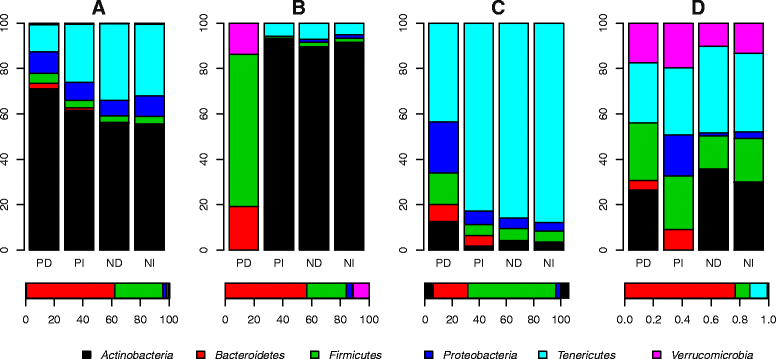
Phylum level degree of connectedness divided by relative abundances. The bars show the number of positive dependent (PD), positive independent (PI), negative dependent (ND) and negative independent (NI) interactions observed within each of the six main phyla divided by the mean relative abundance of each phylum (horizontal bars below the panels). The ratios have been converted to percentages. ad show data for I1-4, respectively
Fig. 6
Fig. 6
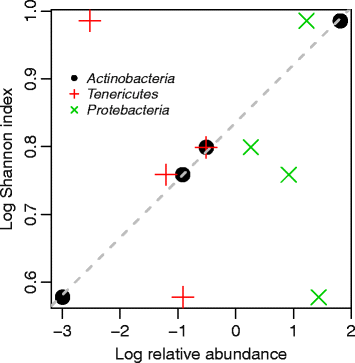
Between-individual relationship between Actinobacteria relative abundance and total community diversity (Shannon index). On the log scale, the relationship is linear (R 2 = 0.99, p << 0.001). This relationship was not observed for Tenericutes or Proteobacteria
Fig. 7
Fig. 7
Enterotype switching in I1. a Average silhouette widths of different cluster numbers indicate that two clusters provide a reasonable fit to the data. b PCoA plot of samples from I1 showing two distinct clusters. c Relative abundance of Prevotella in samples corresponding to enterotype 1 (red) and 2 (green). d Relative abundance of Bacteroides in samples corresponding to enterotype 1 (red) and 2 (green)

Similar articles

Cited by

References

    1. Sommer F, Backhed F. The gut microbiota—masters of host development and physiology. Nat Rev Microbiol. 2013;11(4):227–238. doi: 10.1038/nrmicro2974. - DOI - PubMed
    1. Greenblum S, Chiu HC, Levy R, Carr R, Borenstein E. Towards a predictive systems-level model of the human microbiome: progress, challenges, and opportunities. Curr Opin Biotechnol. 2013;24(4):810–820. doi: 10.1016/j.copbio.2013.04.001. - DOI - PMC - PubMed
    1. Trosvik P, de Muinck EJ, Stenseth NC. Biotic interactions and temporal dynamics of the human gastrointestinal microbiota. ISME J. 2015;9(3):533–541. doi: 10.1038/ismej.2014.147. - DOI - PMC - PubMed
    1. Caporaso JG, Lauber CL, Costello EK, Berg-Lyons D, Gonzalez A, Stombaugh J, et al. Moving pictures of the human microbiome. Genome Biol. 2011;12(5):R50. doi: 10.1186/gb-2011-12-5-r50. - DOI - PMC - PubMed
    1. David LA, Materna AC, Friedman J, Campos-Baptista MI, Blackburn MC, Perrotta A, et al. Host lifestyle affects human microbiota on daily timescales. Genome Biol. 2014;15(7):R89. doi: 10.1186/gb-2014-15-7-r89. - DOI - PMC - PubMed

Publication types

LinkOut - more resources