

Hepatic proteomic analysis revealed altered metabolic pathways in insulin resistant Akt1(+/-)/Akt2(-/-) mice
- PMID: 26455965
- PMCID: PMC4641788
- DOI: 10.1016/j.metabol.2015.09.008
Hepatic proteomic analysis revealed altered metabolic pathways in insulin resistant Akt1(+/-)/Akt2(-/-) mice
Abstract
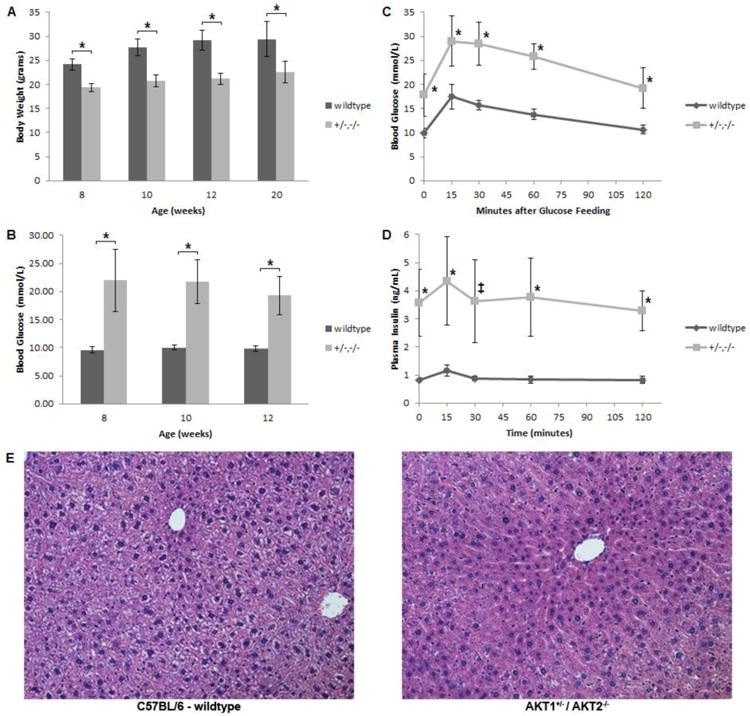
Objective: The aim of this study was to identify liver proteome changes in a mouse model of severe insulin resistance and markedly decreased leptin levels.
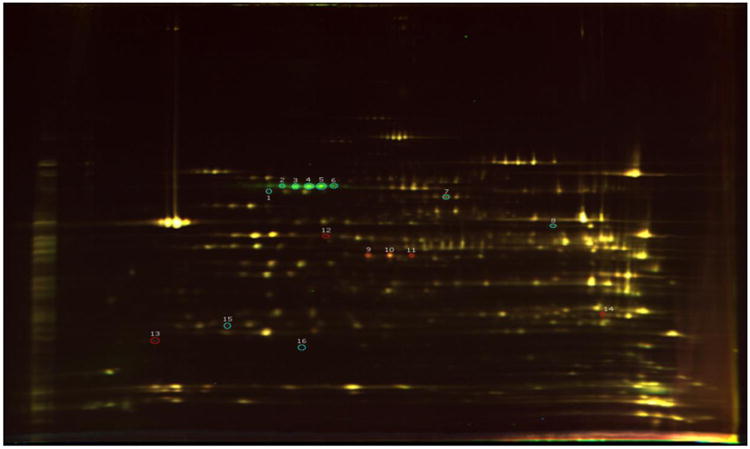
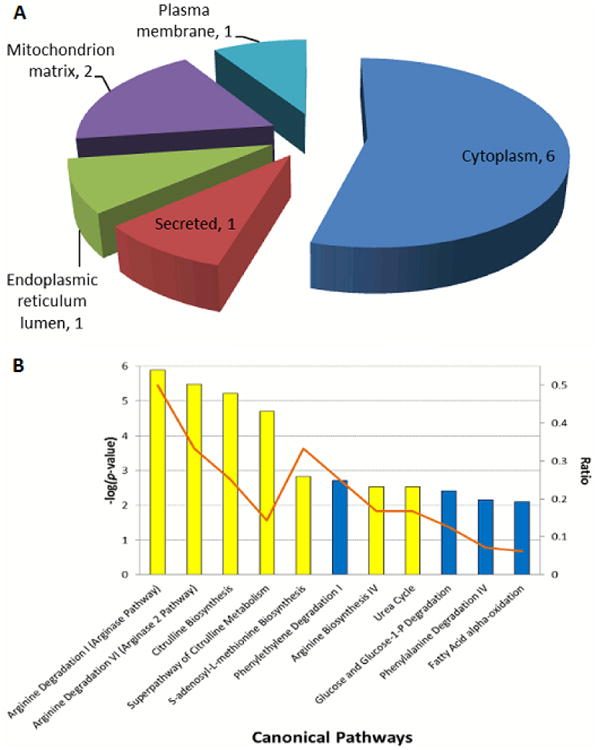
Methods: Two-dimensional differential gel electrophoresis was utilized to identify liver proteome changes in AKT1(+/-)/AKT2(-/-) mice. Proteins with altered levels were identified with tandem mass spectrometry. Ingenuity Pathway Analysis was performed for the interpretation of the biological significance of the observed proteomic changes.
Results: 11 proteins were identified from 2 biological replicates to be differentially expressed by a ratio of at least 1.3 between age-matched insulin resistant (Akt1(+/-)/Akt2(-/-)) and wild type mice. Albumin and mitochondrial ornithine aminotransferase were detected from multiple spots, which suggest post-translational modifications. Enzymes of the urea cycle were common members of top regulated pathways.
Conclusion: Our results help to unveil the regulation of the liver proteome underlying altered metabolism in an animal model of severe insulin resistance.
Keywords: AKT; Insulin resistance; Liver; Mouse; Proteomics.
Copyright © 2015 Elsevier Inc. All rights reserved.
Conflict of interest statement
Figures
Similar articles
-
Prediabetes linked to excess glucagon in transgenic mice with pancreatic active AKT1.J Endocrinol. 2016 Jan;228(1):49-59. doi: 10.1530/JOE-15-0288. Epub 2015 Oct 20. J Endocrinol. 2016. PMID: 26487674 Free PMC article.
-
Proteomic and bioinformatic analysis of membrane proteome in type 2 diabetic mouse liver.Proteomics. 2013 Apr;13(7):1164-79. doi: 10.1002/pmic.201200210. Epub 2013 Feb 26. Proteomics. 2013. PMID: 23349036
-
Akt1 and Akt2 Isoforms Play Distinct Roles in Regulating the Development of Inflammation and Fibrosis Associated with Alcoholic Liver Disease.Cells. 2019 Oct 29;8(11):1337. doi: 10.3390/cells8111337. Cells. 2019. PMID: 31671832 Free PMC article.
-
Akt isoforms and glucose homeostasis - the leptin connection.Trends Endocrinol Metab. 2011 Feb;22(2):66-73. doi: 10.1016/j.tem.2010.09.003. Epub 2010 Oct 12. Trends Endocrinol Metab. 2011. PMID: 20947368 Free PMC article. Review.
-
Promiscuous affairs of PKB/AKT isoforms in metabolism.Arch Physiol Biochem. 2011 May;117(2):70-7. doi: 10.3109/13813455.2010.539236. Epub 2011 Jan 10. Arch Physiol Biochem. 2011. PMID: 21214427 Review.
Cited by
-
Multi-omics profiling: the way towards precision medicine in metabolic diseases.J Mol Cell Biol. 2021 Aug 18;13(8):576-93. doi: 10.1093/jmcb/mjab051. Online ahead of print. J Mol Cell Biol. 2021. PMID: 34406397 Free PMC article.
-
Improvement in glycemia after glucose or insulin overload in leptin-infused rats is associated with insulin-related activation of hepatic glucose metabolism.Nutr Metab (Lond). 2016 Mar 1;13:19. doi: 10.1186/s12986-016-0079-9. eCollection 2016. Nutr Metab (Lond). 2016. PMID: 26937247 Free PMC article.
-
Functional characterization of CD49f+ hepatic stem/progenitor cells in adult mice liver.J Mol Histol. 2022 Apr;53(2):239-256. doi: 10.1007/s10735-022-10063-z. Epub 2022 Feb 15. J Mol Histol. 2022. PMID: 35166962
-
Protein Expression Profile of Twenty-Week-Old Diabetic db/db and Non-Diabetic Mice Livers: A Proteomic and Bioinformatic Analysis.Biomolecules. 2018 Jun 1;8(2):35. doi: 10.3390/biom8020035. Biomolecules. 2018. PMID: 29857581 Free PMC article.
References
-
- Araki E, et al. Alternative pathway of insulin signalling in mice with targeted disruption of the IRS-1 gene. Nature. 1994;372(6502):186–90. - PubMed
-
- Withers DJ, et al. Disruption of IRS-2 causes type 2 diabetes in mice. Nature. 1998;391(6670):900–4. - PubMed
-
- Liu SC, et al. Insulin receptor substrate 3 is not essential for growth or glucose homeostasis. J Biol Chem. 1999;274(25):18093–9. - PubMed
-
- Fantin VR, et al. Mice lacking insulin receptor substrate 4 exhibit mild defects in growth, reproduction, and glucose homeostasis. Am J Physiol Endocrinol Metab. 2000;278(1):E127–33. - PubMed
-
- Cho H, et al. Insulin resistance and a diabetes mellitus-like syndrome in mice lacking the protein kinase Akt2 (PKB beta) Science. 2001;292(5522):1728–31. - PubMed
Publication types
MeSH terms
Substances
Grants and funding
LinkOut - more resources
Full Text Sources
Other Literature Sources
Miscellaneous
