. 2015 Oct 12:6:8548.
doi: 10.1038/ncomms9548.

Replication stress caused by low MCM expression limits fetal erythropoiesis and hematopoietic stem cell functionality

Affiliations

Replication stress caused by low MCM expression limits fetal erythropoiesis and hematopoietic stem cell functionality

Silvia Alvarez et al. Nat Commun. .

Abstract

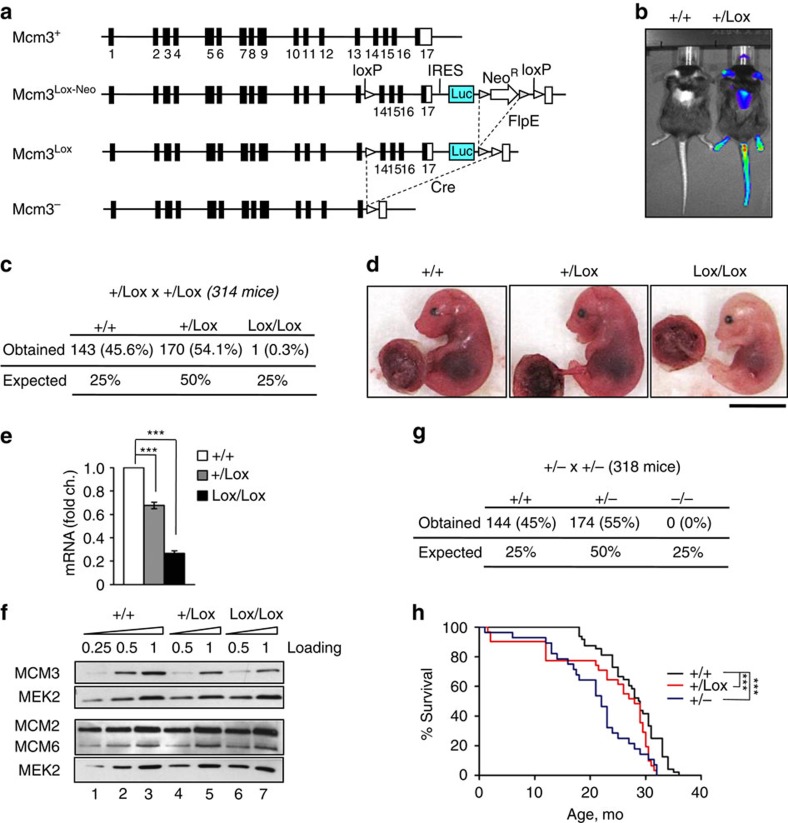
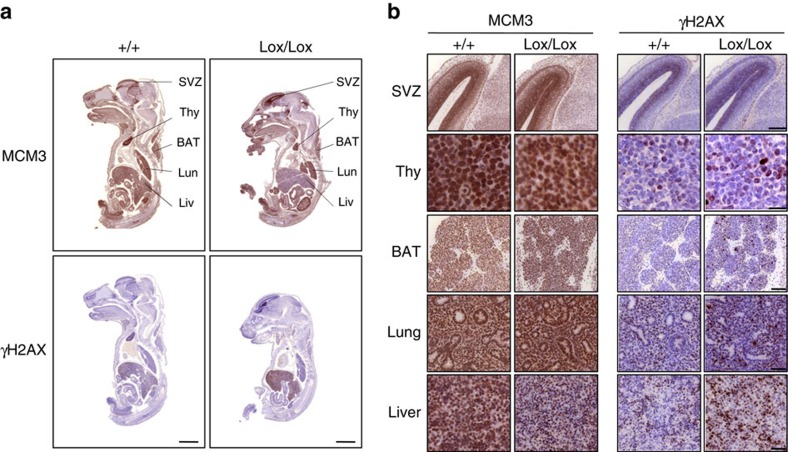
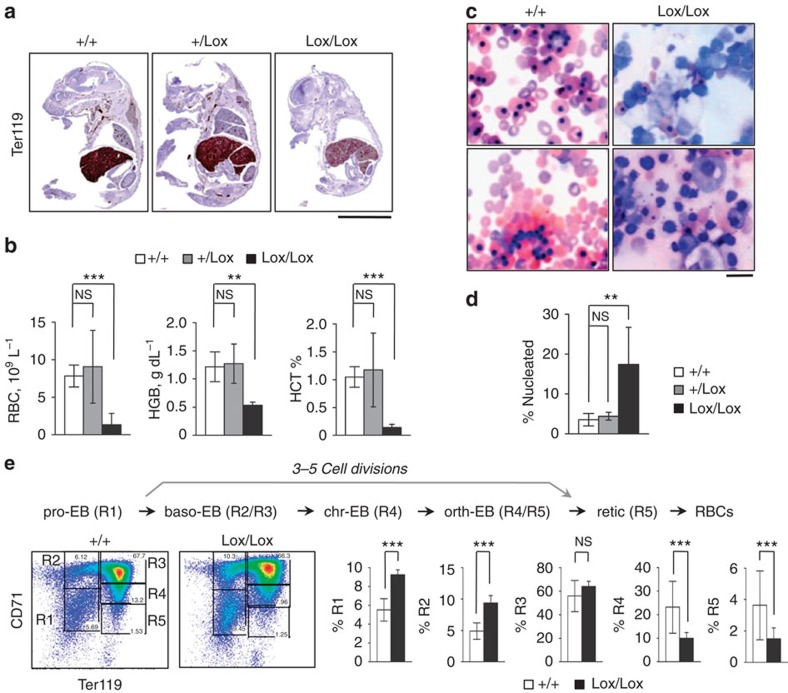
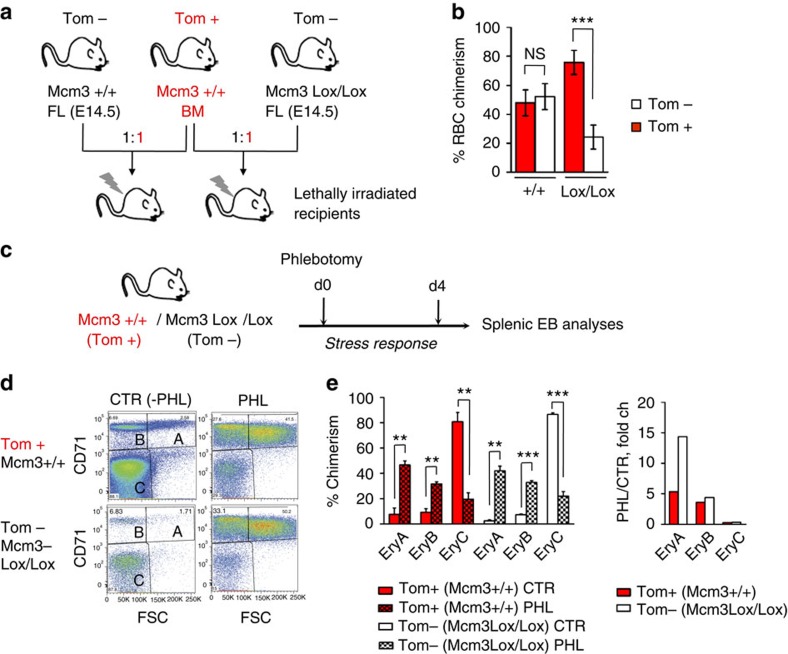
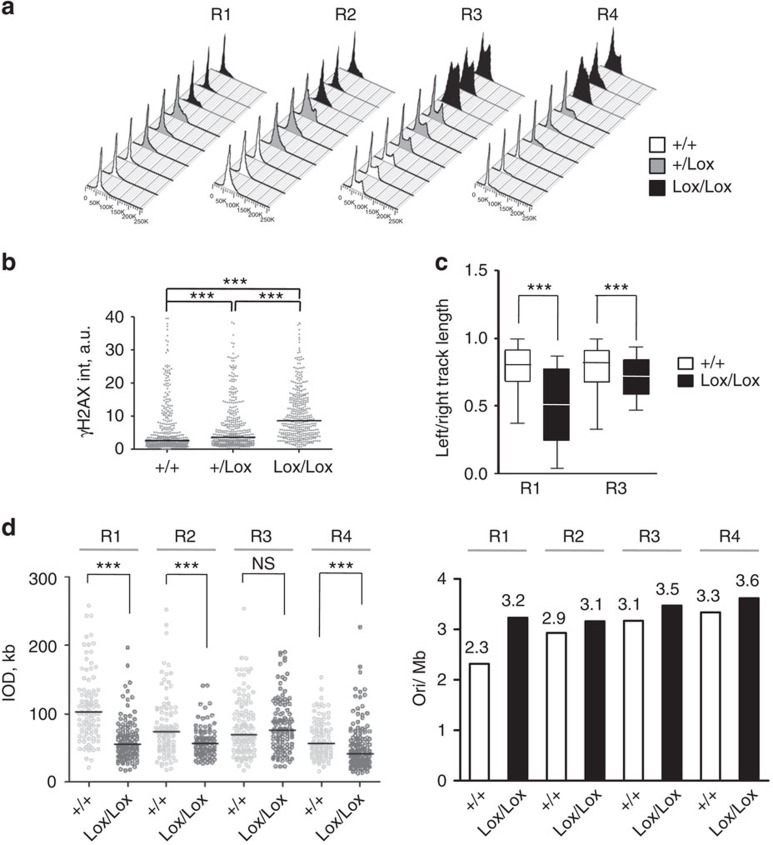
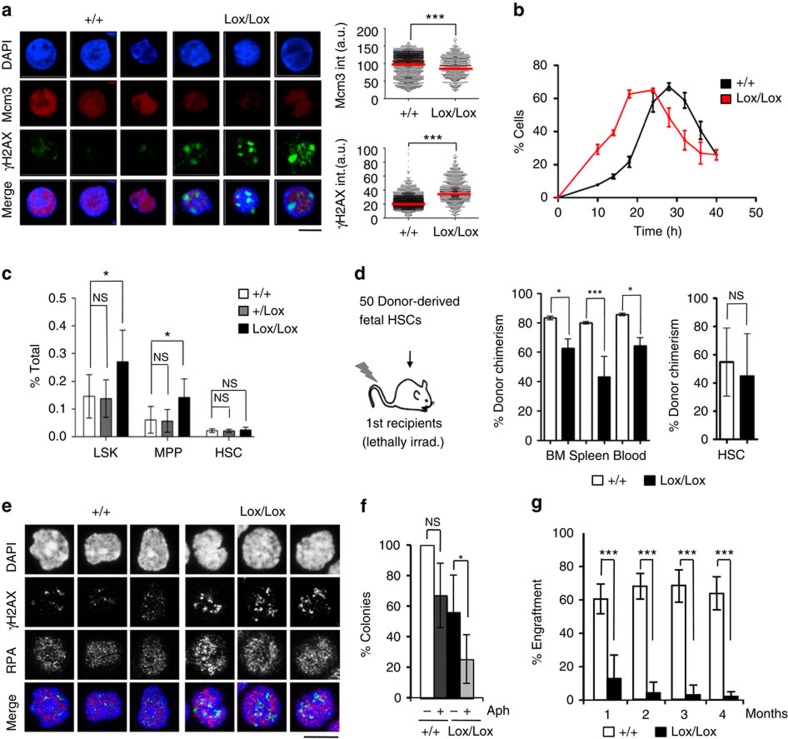
Replicative stress during embryonic development influences ageing and predisposition to disease in adults. A protective mechanism against replicative stress is provided by the licensing of thousands of origins in G1 that are not necessarily activated in the subsequent S-phase. These 'dormant' origins provide a backup in the presence of stalled forks and may confer flexibility to the replication program in specific cell types during differentiation, a role that has remained unexplored. Here we show, using a mouse strain with hypomorphic expression of the origin licensing factor mini-chromosome maintenance (MCM)3 that limiting origin licensing in vivo affects the functionality of hematopoietic stem cells and the differentiation of rapidly-dividing erythrocyte precursors. Mcm3-deficient erythroblasts display aberrant DNA replication patterns and fail to complete maturation, causing lethal anemia. Our results indicate that hematopoietic progenitors are particularly sensitive to replication stress, and full origin licensing ensures their correct differentiation and functionality.


Figures

Figure 1
Figure 1. A mouse strain carrying a hypomorphic Mcm3 allele.
(a) Schematic of the endogenous Mcm3 locus (Mcm3+) and the different alleles resulting from targeted recombination. Mcm3Lox-Neo carries loxP sites flanking exons 14 and 17, a luciferase reporter expressed from an IRES element, and a neomycin-resistance cassette flanked by frt sites (gray triangles) that can be excised with FlpE recombinase, resulting in the Mcm3Lox allele. Cre recombinase excises exons 14–17, resulting in the Mcm3 (null) allele. (b) Imaging of whole body bioluminescence of Mcm3+/+ and Mcm3+/Lox mice, taken 10 min after intraperitoneal injection of luciferin. Mice were partially shaved on the back to expose the skin. (c) Percentage (expected and obtained) of Mcm3+/+, Mcm3+/Lox and Mcm3Lox/Lox mice derived from extensive Mcm3+/Lox × Mcm3+/Lox breeding. (d) Representative images of Mcm3+/+, Mcm3+/Lox and Mcm3Lox/Lox E16.5 embryos and placental tissue. Scale bar, 1 cm. (e) Mcm3 mRNA levels in Mcm3+/+, Mcm3+/Lox and Mcm3Lox/Lox MEFs, determined by qRT-PCR. Histogram shows the average ±s.d. of 3 independent experiments. P-values were calculated with Fisher's test (***P<0.001). (f) Protein levels of the indicated MCM subunits in Mcm3+/+, Mcm3+/Lox and Mcm3Lox/Lox MEFs as determined by immunoblots. For accurate comparisons, different amounts of each extract were loaded. For each SDS-PAGE, MEK2 levels are shown as loading control. Full western blots are shown in Supplementary Fig. 9A. (g) Percentage (expected and obtained) of Mcm3+/+, Mcm3+/− and Mcm3−/− mice after extensive Mcm3+/− × Mcm3+/− breeding. (h) Kaplan-Meier survival curves for Mcm3+/+ (black), Mcm3+/Lox (red) and Mcm3+/− (blue) mice. 42 individuals were included in the wt group (18 female; 24 male), 31 individuals in the +/Lox group (15 female; 16 male) and 35 individuals in the +/- group (13 female; 22 male). Log-Rank (Mantel-Cox) test indicated that there were significant differences between Mcm3+/+ and Mcm3+/Lox or Mcm3+/− curves (***P<0.001).
Figure 2
Figure 2. Hypomorphic Mcm3 expression and DNA damage in Mcm3Lox/Lox embryos.
(a) Immunohistochemistry (IHC) detection of MCM3 and γH2AX proteins in Mcm3+/+ and Mcm3Lox/Lox embryo (E16.5) sections. The following tissues are indicated: SVZ, subventricular zone of the brain; Thy, thymus; BAT, brown adipose tissue; lung; liver. Scale bar, 2 mm. (b) Detailed sections of the indicated tissues stained for MCM3 and γH2AX. Scale bars: SVZ, 200 μm; thymus, 20 μm; BAT, 100 μm; lung, 50 μm; liver, 50 μm.
Figure 3
Figure 3. Defective erythrocyte maturation in Mcm3Lox/Lox embryos.
(a) Ter119 IHC staining in Mcm3+/+, Mcm3+/Lox and Mcm3Lox/Lox E16.5 embryos. Scale bar, 5 mm. (b) Peripheral blood counts from Mcm3+/+, Mcm3+/Lox and Mcm3Lox/Lox E14.5 embryos. RBC, number of red blood cells; HGB, haemoglobin concentration; HCT, hematocrit. Histograms show the average value±s.d. of Mcm3+/+ (n=6), Mcm3+/Lox (n=7) and Mcm3Lox/Lox (n=3) embryo peripheral blood cell counts. P-values were calculated by Fisher's test (***P<0.001, **P<0.05, NS, not significant). (c) Representative fields of Giemsa-stained peripheral blood samples derived from Mcm3+/+ and Mcm3Lox/Lox embryos. Scale bar, 20 μm. (d) Percentage of nucleated erythrocytes in embryo peripheral blood samples. Histograms show the average value±s.d. of Mcm3+/+ (n=5), Mcm3+/Lox (n=8) and Mcm3Lox/Lox (n=6) cell counts. Statistical significance was calculated by One-way Anova (**P<0.05, NS, not significant). (e) Top, schematic of the pathway of erythrocyte differentiation. Bottom left, density plots showing the distribution of EBs in R1-R5 stages in Mcm3+/+ and Mcm3Lox/Lox fetal livers. Bottom right, histogram quantification of the percentage (±s.d.) of cells in R1-R5 in Mcm3+/+ (n=15) and Mcm3Lox/Lox (n=7) fetal livers. P-values were calculated by Fisher's test (***P<0.001, NS not significant).
Figure 4
Figure 4. Impaired RBC maturation during steady-state or stress erythropoiesis.
(a) Experimental design of a competitive transplantation assay between Mcm3+/+ and Mcm3Lox/Lox fetal liver (FL; E14.5) cells and bone marrow (BM) cells of a tool strain constitutively expressing red fluorescent Tomato (Tom) protein, with wild-type Mcm3 levels. In each case, cells were transplanted at 1:1 ratio. (b) Quantification of the RBC (Ter119-positive) chimerism in peripheral blood of recipient mice, 2 months post-transplantation. Histograms show average±s.d.; n=4 mice transplanted with Mcm3+/+ cells and n=4 mice transplanted with Mcm3Lox/Lox cells. P-values were calculated by Fisher's test (***P<0.001, NS, not significant). (c) Schematic of a phlebotomy assay in chimaeric mice to monitor the erythropoietic stress response. (d) Examples of flow cytometry analyses of splenic EryA, EryB, EryC precursors (abbreviated A, B, C), in control mice (CTR) or mice subjected to phlebotomy (PHL). Analyses of EryA, EryB and EryC was carried out four days after the bleeding, differentiating between Tom+ and Tom- cells. (e) Left, histograms showing the percentage of EryA, EryB and EryC populations relative to control mice (n= 2 CTR, n=4 PHL mice). P-values were calculated by Fisher's test (***P<0.001, **P<0.01). Right, histogram showing the fold-change variation in Tom+ (red) or Tom- (white) EryA, EryB and EryC populations induced by phlebotomy.
Figure 5
Figure 5. Aberrant DNA replication patterns in differentiating EBs.
(a) DNA content of EBs in R1-R4 differentiation stages. Three examples of each genotype are shown. (b) γH2AX intensity in Mcm3+/+, Mcm3+/Lox and Mcm3Lox/Lox R3 EBs (>300 nuclei scored per condition). Data are representative of 3 independent experiments. P-values were calculated by Mann-Whitney test (***P<0.001). (c) Box plots showing the values of fork asymmetry in Mcm3+/+ and Mcm3Lox/Lox EBs sorted in R1 and R3 stages. >180 bidirectional forks were counted per condition. Statistical analysis was done with Mann-Whitney rank sum test (***P<0.001). (d) Left, IOD values (data distribution and median value) of Mcm3+/+, Mcm3+/Lox and Mcm3Lox/Lox EBs at the indicated (R1-R4) maturation stage. >100 IOD values were scored for each condition. P-values were calculated using Mann-Whitney test (***P<0.001; NS, not significant). Right, origin density expressed by number of origins/Mb of DNA was estimated as indicated in Materials and Methods. See also Table 1.
Figure 6
Figure 6. Impaired reconstitution potential of Mcm3-deficient HSCs.
(a) Representative images of LSK cells (Lin, cKit+, Sca1+) isolated from Mcm3+/+ and Mcm3Lox/Lox embryonic liver, stained with MCM3 (red) and γH2AX (green) antibodies. Scale bar, 5 μM. Right panels, quantification of MCM3 or γH2AX staining intensity, using Definiens software on confocal microscopy images. Red lines indicate the median nuclear intensity (>800 nuclei scored per condition). P-values were calculated by Mann-Whitney test (***P<0.001). (b) Single-cell tracking of the first cell division of cultured fetal Mcm3+/+ or Mcm3Lox/Lox HSCs. Representation shows the average±s.d. of 4 independent experiments. (c) Histograms showing the percentage of LSK, MPP and HSCs in Mcm3+/+, Mcm3+/Lox and Mcm3Lox/Lox embryonic liver tissue. Median values±s.d. are shown (n=7 embryos for each genotype). P-values were calculated by Fisher's test (*P<0.05; NS, not significant). (d) HSC engraftment results at 4 months post-transplantation. Middle histograms show the percentage of donor-derived chimerism in the bone marrow (BM), spleen and peripheral blood. Right histograms show the percentage of chimerism in the adult HSC compartment. Quantification shows average±s.d. of three independent experiments. P-values were calculated by Fisher's test (***P<0.001; *P<0.05; NS, not significant). (e) Confocal microscopy images of γH2AX and RPA staining in donor-derived, cycling adult Mcm3+/+ or Mcm3Lox/Lox HSCs isolated from the BM. Scale bar, 10 μm. (f) Histogram showing the average number of colonies (±s.d.) formed 7 days after plating Mcm3+/+ or Mcm3Lox/Lox HSCs in methylcellulose, in the absence or presence of low-dose aphidicolin (50 ng ml−1). Results are normalized for vehicle-treated cells (DMSO) and expressed as fold change compared to Mcm3+/+ HSCs. 3 independent experiments were conducted and included in the quantification. P-values were calculated using Fisher's test (*P<0.05; NS, not significant). (g) Donor-derived adult Mcm3+/+ and Mcm3Lox/Lox HSCs were re-isolated and transplanted into lethally irradiated secondary recipients (500 HSCs per mouse; 5 mice per group). Histogram shows the percentage of donor-derived chimerism in peripheral blood, assessed 1–4 months post-transplantation. Data are mean values±s.d. P-values were calculated using Fisher's test (***P<0.001).

References

    1. Costa A., Hood I. V. & Berger J. M. Mechanisms for initiating cellular DNA replication. Annu. Rev. Biochem. 82, 25–54 (2013). - PMC - PubMed
    1. Masai H., Matsumoto S., You Z., Yoshizawa-Sugata N. & Oda M. Eukaryotic chromosome DNA replication: where, when and how? Annu. Rev. Biochem. 79, 89–130 (2010). - PubMed
    1. Bicknell L. S. et al.. Mutations in ORC1, encoding the largest subunit of the origin recognition complex, cause microcephalic primordial dwarfism resembling Meier-Gorlin syndrome. Nat. Genet. 43, 350–355 (2011a). - PubMed
    1. Bicknell L. S. et al.. Mutations in the pre-replication complex cause Meier-Gorlin syndrome. Nat. Genet. 43, 356–359 (2011b). - PMC - PubMed
    1. Guernsey D. L. et al.. Mutations in origin recognition complex gene ORC4 cause Meier–Gorlin syndrome. Nat. Genet. 43, 360–364 (2011). - PubMed

Publication types

Substances