. 2015 Nov;185(11):2969-82.
doi: 10.1016/j.ajpath.2015.07.018. Epub 2015 Oct 9.

Intestinal microbiota modulates gluten-induced immunopathology in humanized mice

Affiliations

Intestinal microbiota modulates gluten-induced immunopathology in humanized mice

Heather J Galipeau et al. Am J Pathol. 2015 Nov.

Abstract

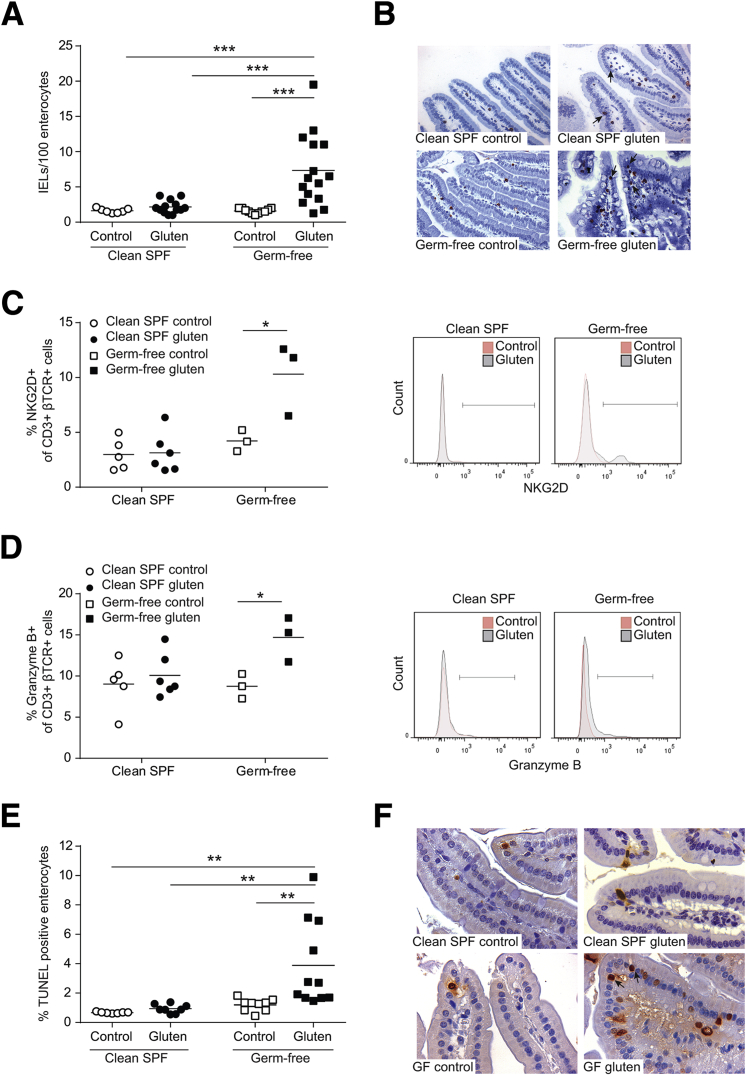
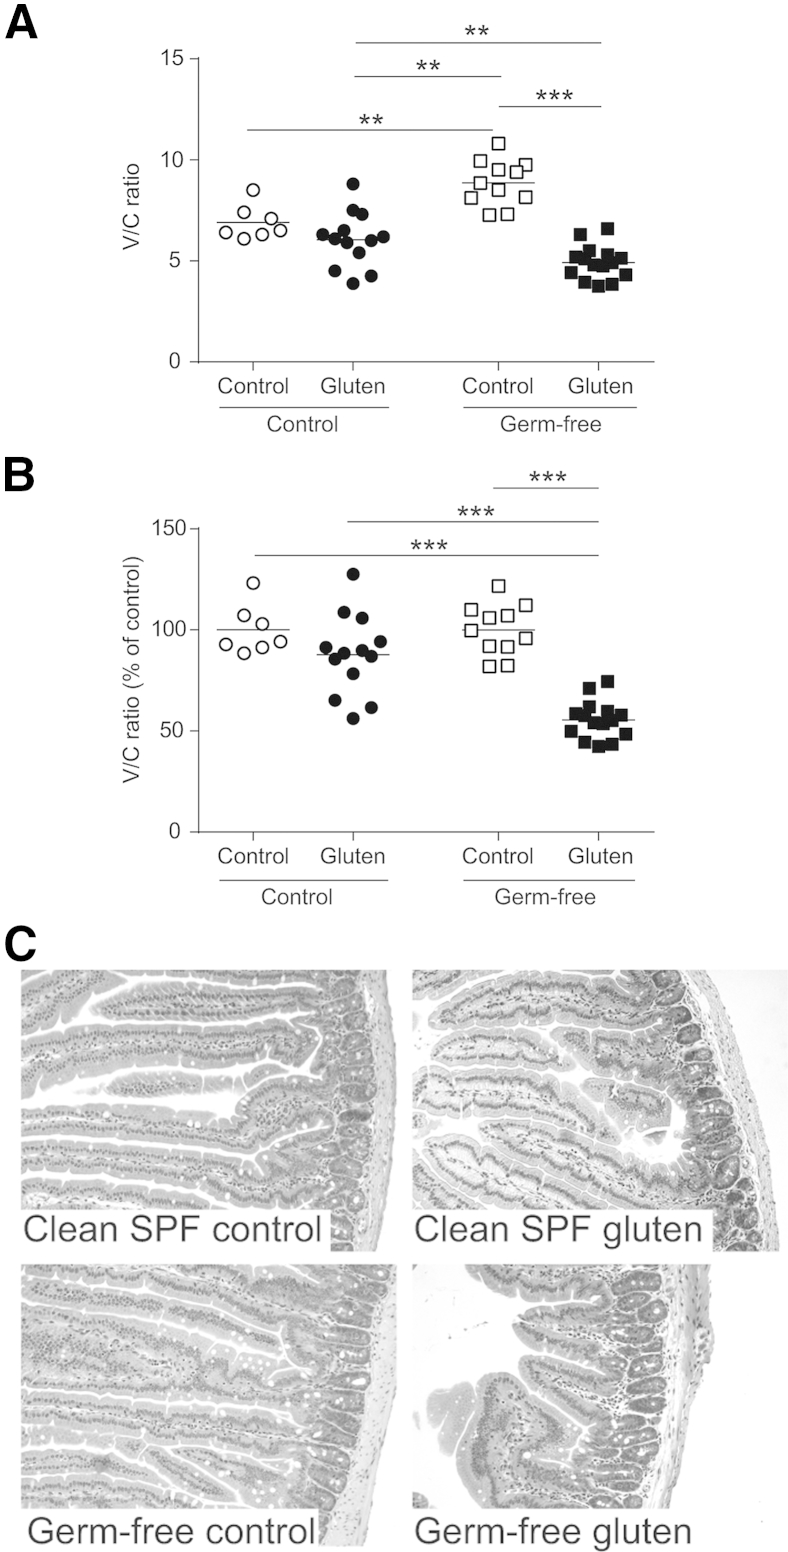
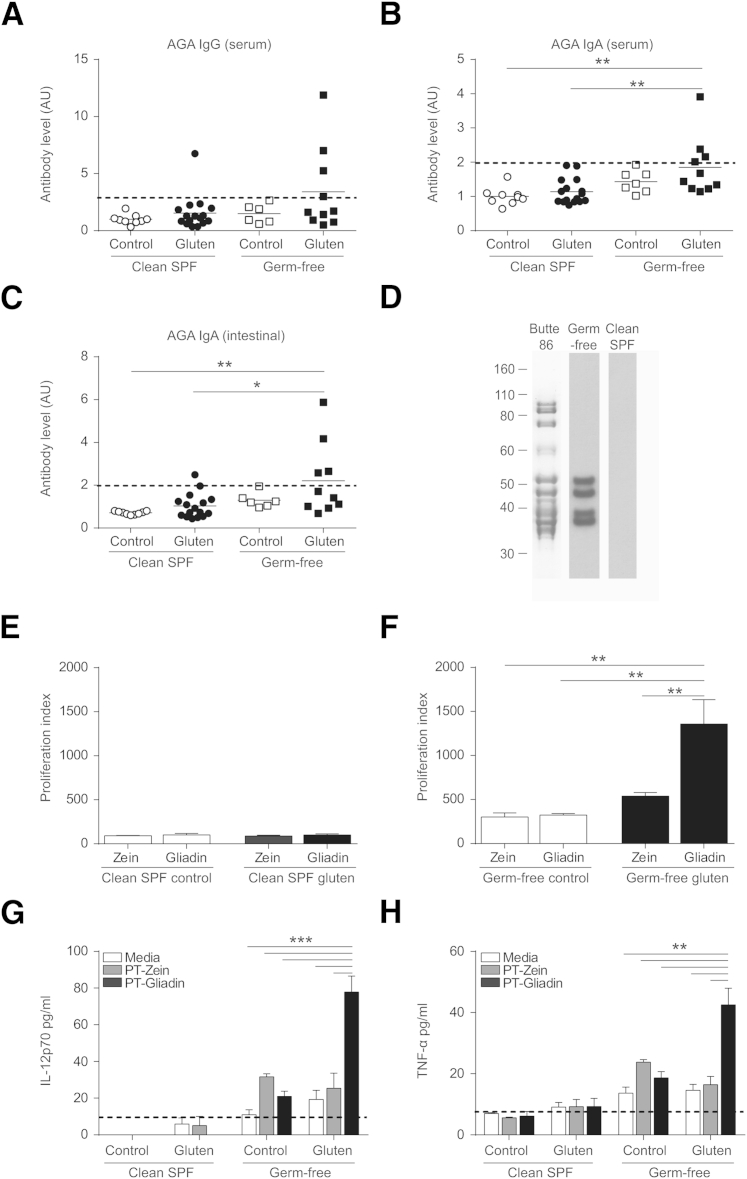
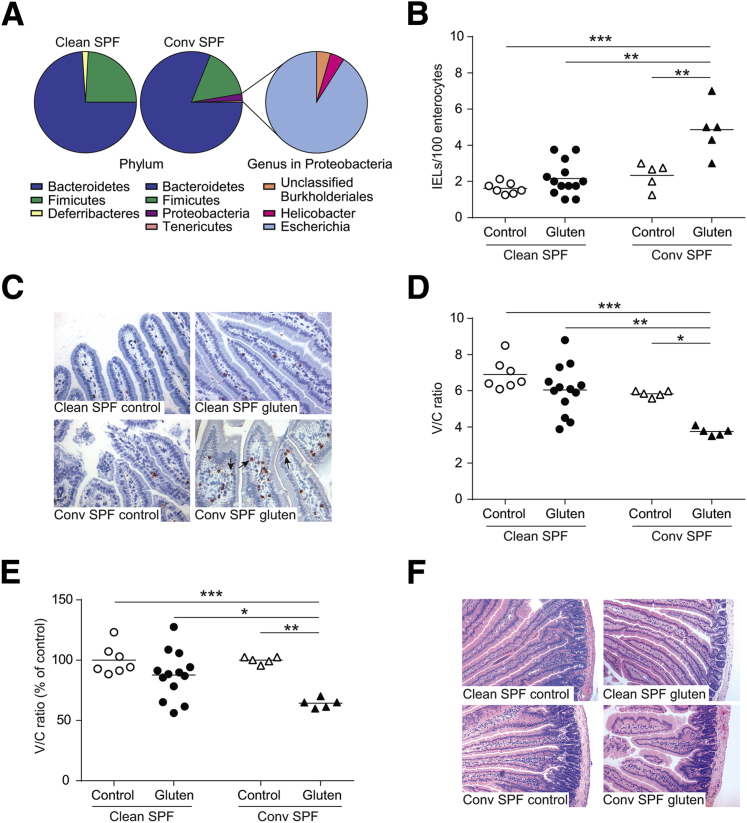
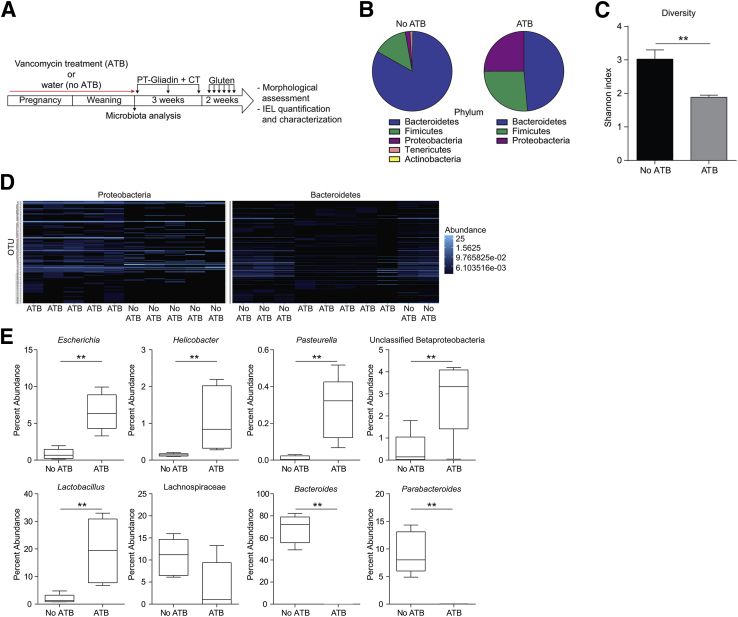
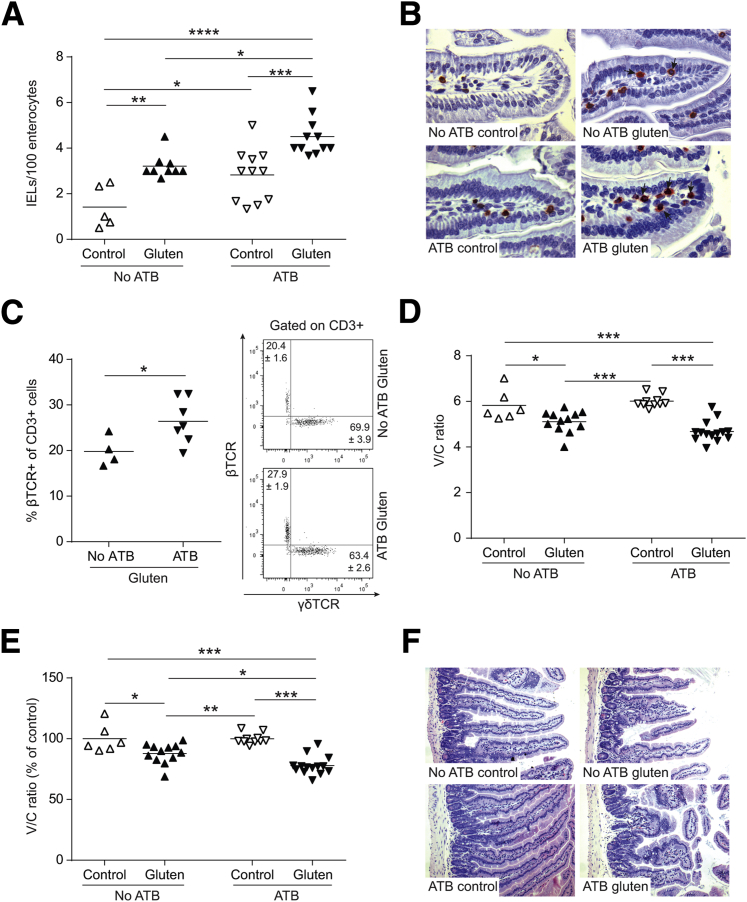
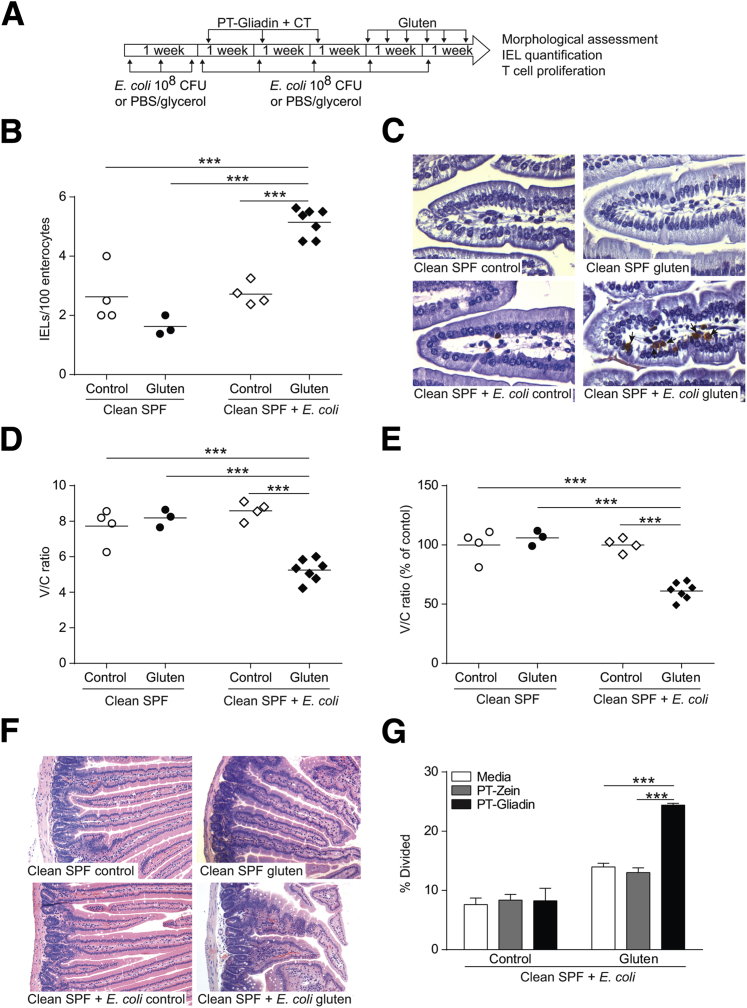
Celiac disease (CD) is an immune-mediated enteropathy triggered by gluten in genetically susceptible individuals. The recent increase in CD incidence suggests that additional environmental factors, such as intestinal microbiota alterations, are involved in its pathogenesis. However, there is no direct evidence of modulation of gluten-induced immunopathology by the microbiota. We investigated whether specific microbiota compositions influence immune responses to gluten in mice expressing the human DQ8 gene, which confers moderate CD genetic susceptibility. Germ-free mice, clean specific-pathogen-free (SPF) mice colonized with a microbiota devoid of opportunistic pathogens and Proteobacteria, and conventional SPF mice that harbor a complex microbiota that includes opportunistic pathogens were used. Clean SPF mice had attenuated responses to gluten compared to germ-free and conventional SPF mice. Germ-free mice developed increased intraepithelial lymphocytes, markers of intraepithelial lymphocyte cytotoxicity, gliadin-specific antibodies, and a proinflammatory gliadin-specific T-cell response. Antibiotic treatment, leading to Proteobacteria expansion, further enhanced gluten-induced immunopathology in conventional SPF mice. Protection against gluten-induced immunopathology in clean SPF mice was reversed after supplementation with a member of the Proteobacteria phylum, an enteroadherent Escherichia coli isolated from a CD patient. The intestinal microbiota can both positively and negatively modulate gluten-induced immunopathology in mice. In subjects with moderate genetic susceptibility, intestinal microbiota changes may be a factor that increases CD risk.


Figures

Figure 1
Figure 1
Colonization with a clean specific pathogen free (SPF) microbiota attenuates gluten-induced intraepithelial lymphocytosis, markers of intraepithelial lymphocyte (IEL) cytotoxicity, and enterocyte cell death in germ-free NOD/DQ8 mice. A: Quantification of CD3+ cells in villi tips in sections of jejunum, expressed as IELs per 100 enterocytes. B: Representative CD3+ stained sections of jejunum. Arrows indicate examples of IELs. C and D: Quantification and corresponding histograms of NKG2D+ (C) and granzyme B+ (D) cells gated on CD3+ β T-cell receptor (TCR)+ small-intestinal IELs. Open circles represent clean SPF controls, closed circles represent clean SPF gluten-treated mice, open squares represent germ-free controls, and closed squares represent germ-free gluten treated mice. E: Quantification of the percentage of terminal deoxynucleotidyl transferase-mediated dUTP nick-end labeling (TUNEL)-positive enterocytes in the villi of jejunum sections. F: Representative TUNEL-stained sections of the jejunum. Arrows indicate examples of positive cells. Each dot represents an individual mouse. P < 0.05 (C and D), ∗∗P < 0.01 (E), and ∗∗∗P < 0.001 (A). Original magnification: ×20 (B); ×40 (F).
Figure 2
Figure 2
Colonization with a clean specific pathogen free (SPF) microbiota attenuates gluten-induced enteropathy in germ-free NOD/DQ8 mice. A: Quantification of villus-to-crypt (V/C) ratios in jejunum sections. B: V/C ratios for clean SPF and germ-free control and gluten-treated mice, expressed as a percentage of controls. Each dot represents an individual mouse. C: Representative hematoxylin and eosin–stained sections of jejunum. ∗∗P < 0.01, ∗∗∗P < 0.001. Original magnification, ×10 (C).
Figure 3
Figure 3
Colonization with a clean specific pathogen free (SPF) microbiota attenuates gliadin-specific immune responses in germ-free NOD/DQ8 mice. AC: Serum and small-intestinal washes were collected for determination of serum anti-gliadin IgG (A), serum anti-gliadin IgA (B), and intestinal anti-gliadin IgA (C). Each dot represents an individual mouse. Positive reactivity was determined by using a positive cutoff value of ≥2 standard deviations above the mean of control mice, as indicated by the dotted line. D: Confirmation of antibody reactivity to gluten proteins by Western blotting. SDS-PAGE profile of the gluten extract from the Butte 86 cultivar used for immunoblotting assays. Western blot reactivity of serum antibodies from a representative germ-free gluten-treated mouse and a representative clean SPF control mouse. Molecular weight markers on the left are in kiloDaltons. E and F: CD4+ T cells were isolated from mesenteric lymph nodes of nonsensitized control and gluten-treated clean SPF (E) and germ-free NOD/DQ8 (F) mice and stimulated with pepsin-trypsin (PT)-gliadin, PT-zein, or medium. The percentage of divided cells was determined for each stimulation condition (PT-gliadin, PT-zein), normalized to the proliferation of medium only wells, and expressed as a proliferation index. G and H: Production of IL-12p70 (G) and tumor necrosis factor (TNF)-α (H) in cell culture supernatant. Black dotted line represents the limit of detection. Data presented as means ± SEM. n = 3 (G and H, per group). P < 0.05 (C), ∗∗P < 0.01 (BC, F, and H), and ∗∗∗P < 0.001 (G). AGA, anti-gliadin antibodies.
Figure 4
Figure 4
Conventional specific pathogen free (SPF) mice harbor opportunistic bacteria and develop more severe gluten-induced pathology compared to clean SPF NOD/DQ8 mice. A: Microbial composition of cecal contents from clean SPF and conventional (conv) SPF NOD/DQ8 mice by 16s rRNA sequencing at the phylum and genus level within the Proteobacteria phylum. B: Quantification of CD3+ cells in villi tips of jejunum sections, expressed as intraepithelial lymphocytes (IELs) per 100 enterocytes. C: Representative CD3+-stained sections of the jejunum. Black arrows indicate examples of IELs. D: Quantification of villus-to-crypt (V/C) ratios in jejunum sections. E: V/C ratios for clean SPF and conventional SPF control and gluten-treated mice, expressed as a percentage of controls. Each dot represents an individual mouse. F: Representative hematoxylin and eosin–stained sections of jejunum. P < 0.05 (D and E), ∗∗P < 0.01 (B, D, and E), and ∗∗∗P < 0.001(B, D, and E). Original magnification: ×20 (C); ×10 (F).
Figure 5
Figure 5
In utero and neonatal vancomycin treatment induces changes in microbial composition in conventional specific pathogen free (SPF) NOD/DQ8 mice. A: Pregnant conventional SPF mice received antibiotics (vancomycin; ATB) in drinking water until pups were weaned at 3 weeks of age. Non–antibiotic-treated mice received water alone (no ATB). B: Fecal microbial composition by 16s rRNA sequencing, at the phylum level. C: Fecal microbial diversity, expressed via Shannon Index. D: Heat map of Proteobacteria and Bacteroidetes phyla, each band representing a unique operational taxonomic unit, generated using Bray-Curtis dissimilarity. E: Percent abundance of genera Escherichia, Helicobacter, Pasteurella, unclassified Betaproteobacteria, Bacteroides, Parabacteroidetes, Lactobacillus, and family Lachnospiraceae. Data presented as means ± SEM (C) or as medians (E), with each box extending from the 25th to 75th percentile, and whiskers extending from the minimum to maximum value. n = 5 (per group). ∗∗P < 0.01.
Figure 6
Figure 6
Perturbation of the colonization process in NOD/DQ8 mice increases severity of gluten-induced pathology. A: Quantification of CD3+ cells in villi tips of jejunum sections, expressed as intraepithelial lymphocytes (IELs) per 100 enterocytes. B: Representative CD3+-stained sections of jejunum. Arrows indicate examples of IELs. C: Quantification of the percentage of β T-cell receptor (TCR)+ cells gated on CD3+ small-intestinal IELs and representative flow cytometry plots for CD3+ γδTCR+ and CD3+ βTCR+ IELs are shown with the means ± SEM indicated. D: Quantification of villus-to-crypt (V/C) ratios in jejunum sections. E: V/C ratios for control and gluten-treated mice, expressed as a percentage of controls. Each dot represents an individual mouse. F: Representative hematoxylin and eosin–stained sections of the jejunum. P = 0.05 (A, C, D, and E), ∗∗P < 0.01 (A and E), ∗∗∗P < 0.001 (A, D, and E), and ∗∗∗∗P < 0.0001 (A). Original magnification: ×40 (B); ×10 (F). ATB, antibiotics.
Figure 7
Figure 7
Supplementation of clean specific pathogen free (SPF) microbiota with Escherichia coli ENT CAI:5 increases severity of gluten-induced pathology in NOD/DQ8 mice. A:E. coli ENT CAI:5 supplementation and gluten treatment protocol. B: Quantification of CD3+ cells in villi tips of jejunum sections, expressed as intraepithelial lymphocytes (IELs) per 100 enterocytes. C: Representative CD3+-stained sections of the jejunum. Arrows indicate examples of IELs. D: Quantification of villus-to-crypt (V/C) ratios in jejunum sections. E: V/C ratios for control and gluten-treated mice, expressed as a percentage of controls. Each dot represents an individual mouse. F: Representative hematoxylin and eosin–stained sections of the jejunum. G: Mesenteric lymph node CD4+ T-cell proliferation in response to pepsin-trypsin (PT)-zein or PT-gliadin stimulation in E. coli ENT CAI:5-supplemented clean SPF mice. Data presented as means ± SEM. n = 3 per group. ∗∗∗P < 0.001. Original magnification: ×40 (C); ×10 (F). CFU, colony-forming units.

Comment in

References

    1. Dieterich W., Ehnis T., Bauer M., Donner P., Volta U., Riecken E.O., Schuppan D. Identification of tissue transglutaminase as the autoantigen of celiac disease. Nat Med. 1997;3:797–801. - PubMed
    1. Shan L., Molberg Ø., Parrot I., Hausch F., Filiz F., Gray G.M., Sollid L.M., Khosla C. Structural basis for gluten intolerance in celiac sprue. Science. 2002;297:2275–2279. - PubMed
    1. Allegretti Y.L., Bondar C., Guzman L., Rua E.C., Chopita N., Fuertes M., Zwirner N.W., Chirdo F.G. Broad MICA/B expression in the small bowel mucosa: a link between cellular stress and celiac disease. PLoS One. 2013;8:e73658. - PMC - PubMed
    1. Meresse B., Chen Z., Ciszewski C., Tretiakova M., Bhagat G., Krausz T.N., Raulet D.H., Lanier L.L., Groh V., Spies T., Ebert E.C., Green P.H., Jabri B. Coordinated induction by IL15 of a TCR-independent NKG2D signaling pathway converts CTL into lymphokine-activated killer cells in celiac disease. Immunity. 2004;21:357–366. - PubMed
    1. Rubio-Tapia A., Kyle R.A., Kaplan E.L., Johnson D.R., Page W., Erdtmann F., Brantner T.L., Kim W., Phelps T.K., Lahr B.D., Zinsmeister A.R., Melton L.J., 3rd, Murray J.A. Increased prevalence and mortality in undiagnosed celiac disease. Gastroenterology. 2009;137:88–93. - PMC - PubMed

Publication types

MeSH terms