. 2015 Oct 20;13(3):585-598.
doi: 10.1016/j.celrep.2015.09.021. Epub 2015 Oct 8.

CSNAP Is a Stoichiometric Subunit of the COP9 Signalosome

Affiliations

CSNAP Is a Stoichiometric Subunit of the COP9 Signalosome

Shelly Rozen et al. Cell Rep. .

Abstract

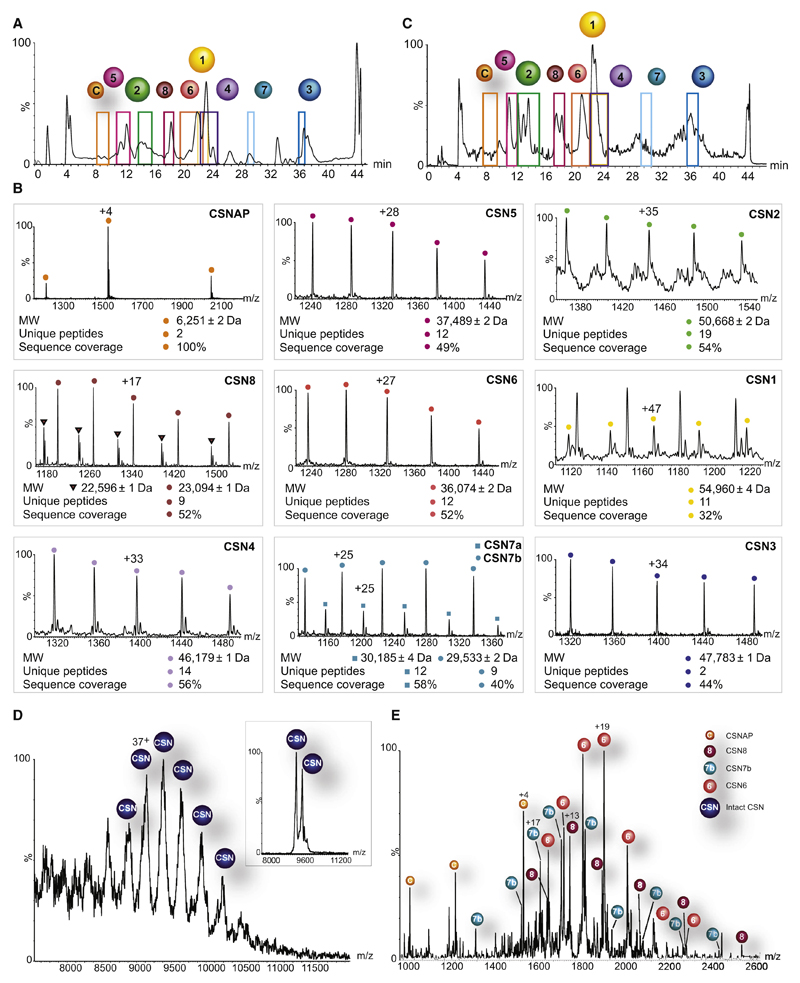
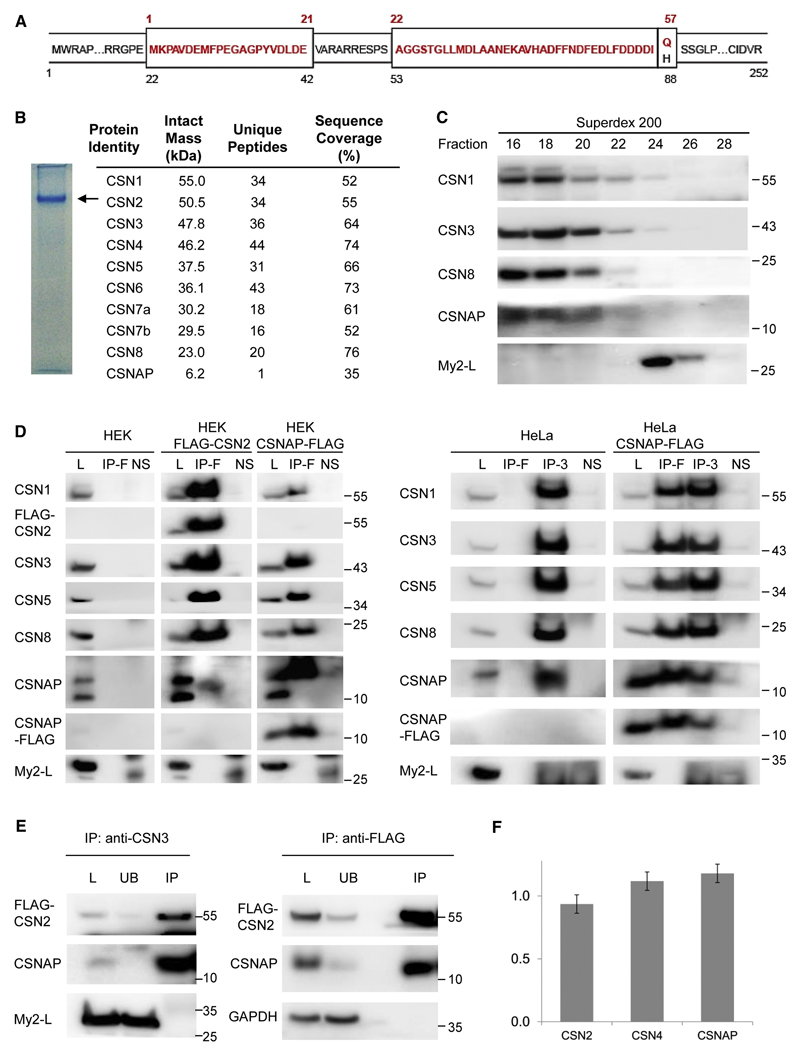
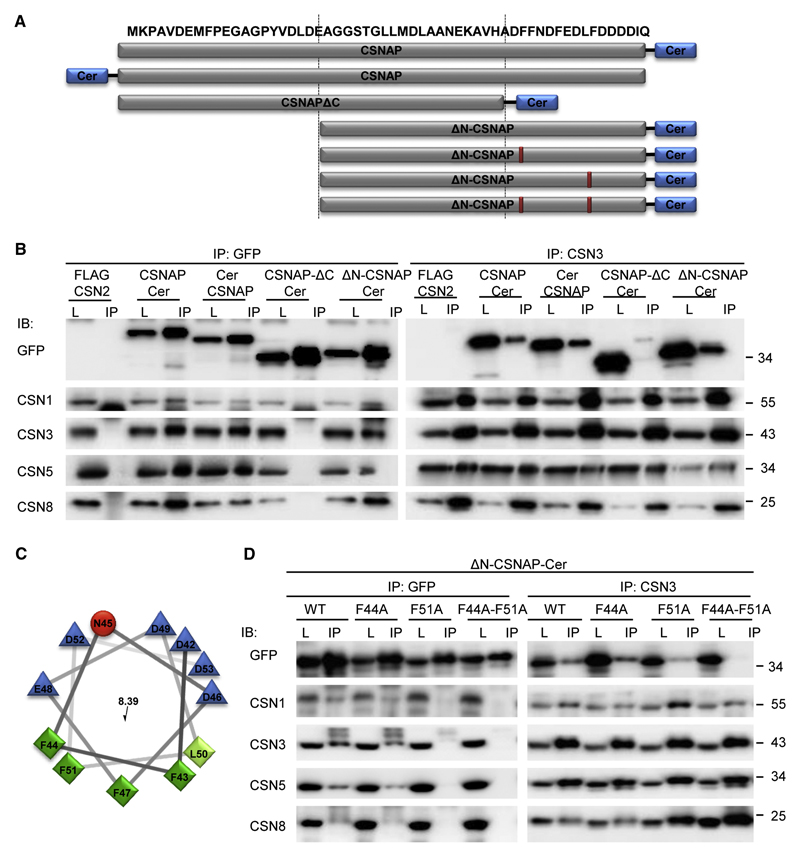
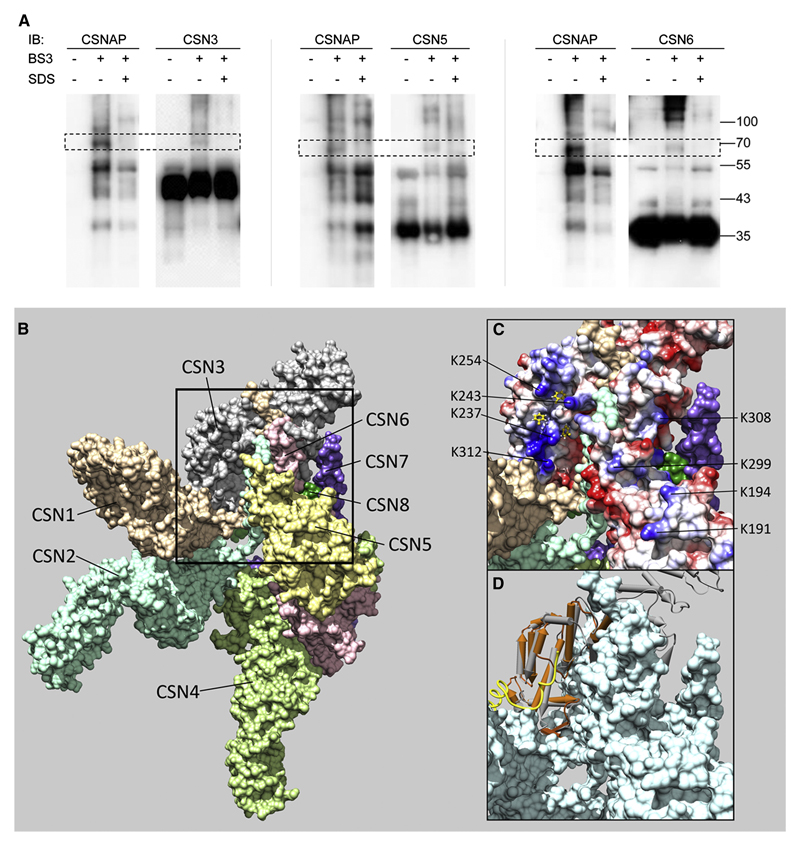
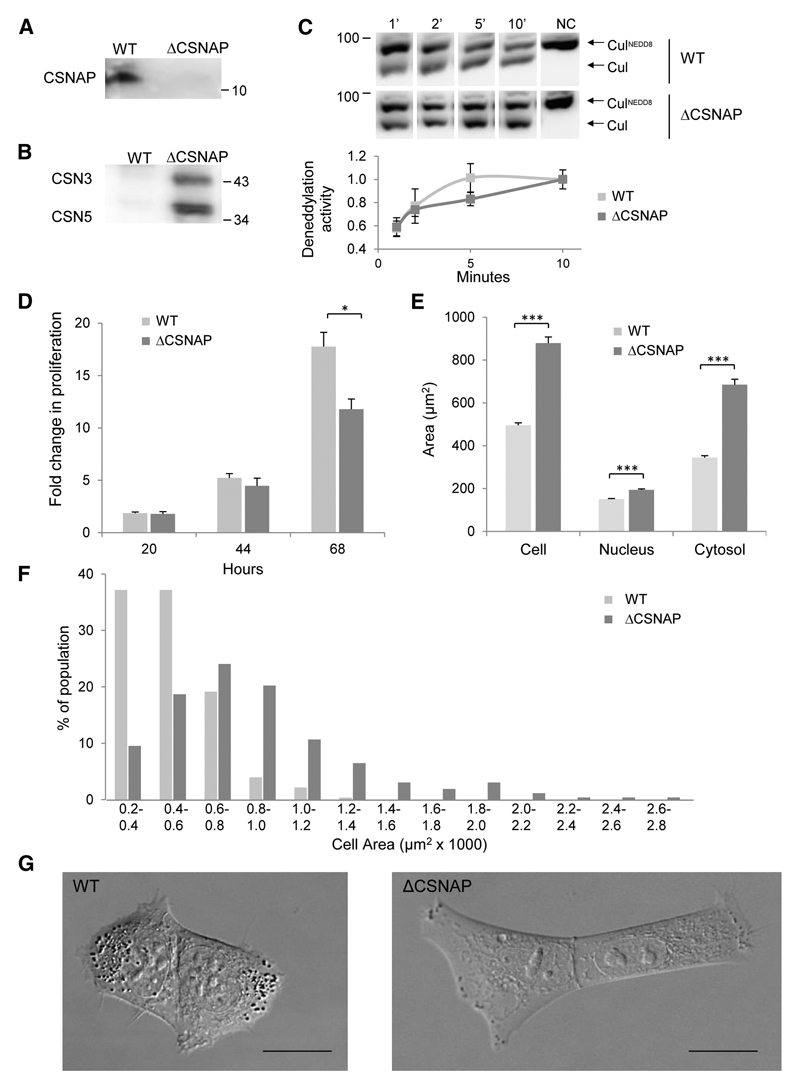
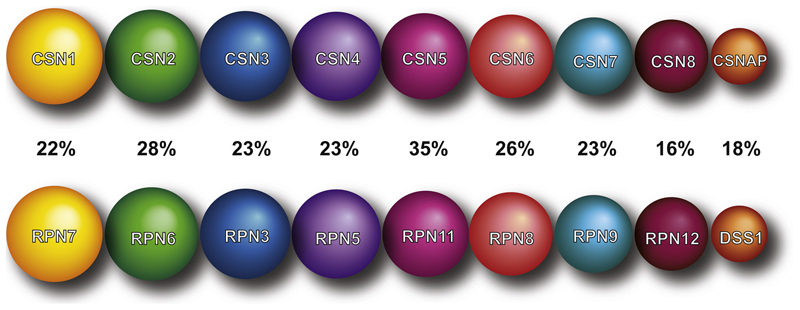
The highly conserved COP9 signalosome (CSN) complex is a key regulator of all cullin-RING-ubiquitin ligases (CRLs), the largest family of E3 ubiquitin ligases. Until now, it was accepted that the CSN is composed of eight canonical components. Here, we report the discovery of an additional integral and stoichiometric subunit that had thus far evaded detection, and we named it CSNAP (CSN acidic protein). We show that CSNAP binds CSN3, CSN5, and CSN6, and its incorporation into the CSN complex is mediated through the C-terminal region involving conserved aromatic residues. Moreover, depletion of this small protein leads to reduced proliferation and a flattened and enlarged morphology. Finally, on the basis of sequence and structural properties shared by both CSNAP and DSS1, a component of the related 19S lid proteasome complex, we propose that CSNAP, the ninth CSN subunit, is the missing paralogous subunit of DSS1.


Figures

Figure 1
Figure 1. CSNAP physically associates with the CSN complex.
The endogenous CSN complex isolated from human erythrocytes (A) and HEK293 cells (C) was separated into its component subunits, using a monolithic column under denaturing conditions. A colored frame highlights the retention time of each eluted protein. CSNAP (labeled as C) was persistently detected alongside the eluted CSN subunits, implying its association with the CSN complex. (B) The resulting ESI-QToF mass spectra are shown. These spectra made it possible to determine the mass of the eluted protein and its associated variants; proteomics analysis was performed for sequence identification. CSNAP repeatedly co-eluted with the CSN subunits, suggesting that it associates with the complex. Indicated masses are an average of biological and technical measurements. Subunit variants are differentiated by labeling with circles and squares. (D) Nano-electrospray mass spectrum recorded under native conditions of the human CSN complex isolated from HEK293T cells. The intact CSN complex is observed between 8,500 and 10,500 m/z. The 36+ and 35+ charge states (inset) were selected for tandem MS analysis. (E) MS/MS spectrum showing the individual subunits stripped from the CSN complex. In addition to the dissociation of CSN6, CSN7b, and CSN8, we could also assign peaks corresponding in mass to CSNAP, indicating that it interacts with the CSN complex. The different species are denoted with labeled circles.
Figure 2
Figure 2. The short isoform of the Myeov2 gene, CSNAP, interacts with the CSN complex.
(A) Schematic representation of the two alternatively spliced products of the Myeov2 gene. Amino acid residues colored in red represent the CSNAP sequence (57 amino acids). The long Myeov2 protein (252 amino acids, My2-L) contains the entire sequence of the short transcript except for glutamine 57, as well as additional sequence stretches in internal and end regions (shown in black). (B) Native PAGE separation (6%) of the purified CSN complex. The position of the complex is denoted by an arrow; the absence of additional bands in the gel indicates the high integrity of the complex. Proteins extracted from the labeled band were subjected to proteomic LC-MS/MS analysis. Identified proteins with sequence coverage ≥ 30% are listed. (C) HEK293T FLAG-CSN2 cell extract was subjected to Superdex 200 gel-filtration chromatography. Fractions were collected and analyzed by SDS-PAGE and immunoblotting. CSNAP co-fractionated with the CSN complex, unlike Myeov2-L, that eluted in lower molecular weight fractions. (D) Whole-cell lysates (L) from HEK293T cells stably expressing FLAG-CSN2, or HEK293 cells transiently expressing CSNAP-FLAG (left panel), as well as lysates from HeLa cells transiently expressing CSNAP-FLAG (right panel), were subjected to immunoprecipitation (IP) using FLAG affinity gel (IP-F) or anti-CSN3 antibody (IP-3). Pulldowns were analyzed by Western blots, using antibodies against CSN subunits, CSNAP, and FLAG. The results show that CSNAP, but not the long version of Myeov2, co-immunoprecipitate with the CSN complex. As controls, WT HEK293 and HeLa lysates were used. To rule out non-specific interactions, lysates were also incubated with Protein G Sepharose, without the addition of the primary antibodies (NS). (E) CSN was co-immunoprecipitated from HEK293 stably expressing FLAG-CSN2, using an anti-CSN3 antibody or anti-FLAG resin. The whole-cell lysates (L) bound (IP) and unbound (UB) fractions were analyzed by Western blots using antibodies against CSNAP and FLAG. GAPDH and My2-L were used as negative controls. The depletion of CSN2 and CSNAP from the unbound fraction not only suggests that the majority of CSN complexes are bound to CSNAP, but also that this small protein is not part of another protein complex. In all Western blots, molecular weights are indicated in kDa units. All experiments were repeated at least 3 times. (F) CSN was subjected to targeted proteomic analysis by selective reaction monitoring (SRM) mass spectrometry and stable, isotopically labeled peptide standards. Absolute quantification was done by referencing the native peptide intensities to the heavy labeled standards, and then normalizing against a representative peptide. Results indicate that CSN subunits and CSNAP are present in equimolar amounts. Data shown are the result of three biological replicates, with two technical replicates each. Error bars indicate the standard deviations of all six measurements.
Figure 3
Figure 3. The F/D-rich C-terminal domain of CSNAP, specifically Phe44 and Phe51, are involved in its interaction with the CSN complex.
(A) Schematic representation of the different CSNAP constructs used in this experiment. (B) Cellular proteins extracted from the different fluorescently tagged HEK293 cell lines were immunoprecipitated, using anti-GFP and anti-CSN3 antibodies. As control, lysate from HEK293 cells stably expressing FLAG-CSN2 was used. Lysates (L) were run side-by-side with their corresponding immunoprecipitated proteins (IP), and visualized using various antibodies, as indicated (IB). Results show that CSNAP-ΔC-Cer did not interact with the CSN, indicating that the C-terminal domain is responsible for its interaction with the complex. (C) Helical wheel representation of the CSNAP C-terminal region. Hydrophilic and hydrophobic residues are colored blue and green, respectively. Distribution of the residues on either side of the helix suggests amphipathic properties for this structure. (D) Lysates (L) from HEK293 cells expressing ΔN-CSNAP-Cer (WT) and its mutational variants, consisting of single (F44A and F51A) and double (F44A-F51A) amino acid substitutions, were immunoprecipitated by either anti-GFP or anti-CSN3 (IP). Pulldowns were analyzed by Western blot, using antibodies against GFP and CSN subunits. Findings show that while Phe44 displacement yielded results similar to those of the WT construct, the F51A mutant extensively weakened the interaction of ΔN-CSNAP with the CSN. The most pronounced effect was observed for the F44A-F51A double mutant, which entirely abolished the ΔN-CSNAP/CSN interaction.
Figure 4
Figure 4. Live cellular analyses indicate that CSNAP is an integral CSN subunit.
(A) HeLa cells were fractionated into cytoplasmic, nuclear soluble, and chromatin-associated fractions, with or without prior exposure to UV light. Fractions were separated on tricine-SDS gels, and blots were probed with anti-CSN1, CSN8 and CSNAP antibodies. As controls, anti-tubulin and anti-histone 3 antibodies were used. Like CSN subunits, CSNAP, but not Myeov2-L (My2-L), is recruited to the nucleoplasmic and chromatin fractions following DNA damage induction. (B) FRAP curves of full-length CSNAP-Cer, as well as its deletion mutants, ΔN-CSNAP-Cer and CSNAP-ΔC-Cer, were compared to those obtained for free Cerulean and fluorescently labeled CSN3 and DDB2. Each plot constitutes an average of at least 40 cells, normalized to pre-bleach intensity. To better display the mobility differences between the measured cell lines, the regions within the dashed squares were enlarged (insets).
Figure 5
Figure 5. CSNAP interacts with CSN3, CSN5 and CSN6.
(A) FLAG-tagged CSN was purified from HEK293T cells and cross-linked with BS3. As a control for specific CSNAP association, FLAG-CSN was denatured with 1% SDS and boiled for 5 minutes, prior to addition of the cross-linker. After quenching the reaction, the complex was precipitated with acetone, followed by Western blot analysis with antibodies against CSNAP and CSN subunits. The data revealed that CSNAP forms a cross-link with CSN3, CSN5 and CSN6. (B) An overall view of the CSN crystal structure, showing the surfaces of the eight subunits(Lingaraju et al., 2014). The black frame delineates the region where CSN3, CSN5, and CSN6 are found in close proximity. This region enlarged in (C) and (D), includes the C-terminal helices of CSN3 and CSN6, and the loop 284-295 of CSN5, which connects its two C-terminal helices. (C) The electrostatic potential on the surfaces of CSN3, CSN5 and CSN6: blue for positive, red for negative, and white for neutral. The highly positive patch of CSN3 is seen at the top left. Exposed lysine residues which may be involved in cross-linking are indicated: K237, K243, K254, and K312 of CSN3; K191, K194, and K299 of CSN5; and K306 of CSN6. The positive patch includes several hydrophobic pockets, which are preferred anchoring sites of Phe residues, as predicted by ANCHORSmap. Anchored Phe side chains with ΔG<-4 Kcal/mol are shown in yellow. (D) Superposition of the PCI domain of PCID2 (brown) in the complex with DSS1 (Ellisdon et al., 2012), onto the PCI domain of CSN3 (gray). The F/D-rich region of DSS1 (golden coil) binds to the front face of PCID2, which corresponds to the positive patch of CSN3.
Figure 6
Figure 6. CSNAP-depleted cells display a distinctive phenotype.
(A) The CSN complex was FLAG-affinity purified from wild-type (WT) or from CSNAP knockout cells (ΔCSNAP), stably expressing FLAG-CSN1. CSNAP was detected by Western blot using an anti-CSNAP antibody only in the complex isolated from WT but not ΔCSNAP cells. (B) The WT CSN complex is saturated with endogenous CSNAP. Lysates from WT and ΔCSNAP cells stably expressing FLAG-CSN1 were passed through Aminolink beads coupled to a CSNAP-peptide. Only the CSN complex from the ΔCSNAP but not from the WT lysate, could bind to the beads. (C) WT and ΔCSNAP cells exhibit a similar rate of deneddylation. Deneddylation was monitored at different time points. A representative deneddylation assay (top panel) and a plot demonstrating the average activity of three independent experiments (bottom panel). As a negative control (NC), lysates were denatured (boiled) prior to the assay. Bars represent standard errors. (D) ΔCSNAP cells exhibit lower proliferation rates, as measured using the resazurin proliferation assay. Plot represents the average proliferation rate of three independent experiments. Measurements were subjected to T-test analysis; * indicates p<0.05. (E) ΔCSNAP cells are flatter and larger than WT cells. Cells plated at a low density were imaged using a confocal microscope. Partially dispersed cells displaying distinct cellular borders, were used to measure the cellular area of WT (n=277) and ΔCSNAP cells (n=263). Bars represent standard errors. Measurements were subjected to T-test analysis; *** indicates p<10-15. (F) Size distribution of WT and ΔCSNAP cell areas, represented as percent of the total population. (G) A representative confocal image of WT and ΔCSNAP cells. Bar represents 20 μm.
Figure 7
Figure 7. DSS1 and CSNAP are intrinsically disordered proteins that share sequential and functional homology.
Schematic illustration of the one-to-one sequence homology between the CSN and 19S proteasome lid complexes. CSNAP may represent the missing homologous partner of DSS1. The percentage of sequence identity between the subunits is labeled for each pair.

Similar articles

Cited by

References

    1. Adler AS, Lin M, Horlings H, Nuyten DS, van de Vijver MJ, Chang HY. Genetic regulators of large-scale transcriptional signatures in cancer. Nat Genet. 2006;38:421–430. - PMC - PubMed
    1. Adler AS, Littlepage LE, Lin M, Kawahara TL, Wong DJ, Werb Z, Chang HY. CSN5 isopeptidase activity links COP9 signalosome activation to breast cancer progression. Cancer Res. 2008;68:506–515. - PMC - PubMed
    1. Aravind L, Ponting CP. Homologues of 26S proteasome subunits are regulators of transcription and translation. Protein science. 1998:1250–1254. - PMC - PubMed
    1. Beck F, Unverdorben P, Bohn S, Schweitzer A, Pfeifer G, Sakata E, Nickell S, Plitzko JM, Villa E, Baumeister W, et al. Near-atomic resolution structural model of the yeast 26S proteasome. Proc Natl Acad Sci USA. 2012;109:14870–14875. 1. - PMC - PubMed
    1. Ben-Shimon A, Eisenstein M. Computational mapping of anchoring spots on protein surfaces. J Mol Biol. 2010;402:259–277. - PubMed

Publication types

MeSH terms