. 2015 Oct 20;13(3):533-545.
doi: 10.1016/j.celrep.2015.09.023. Epub 2015 Oct 8.

Lethal Cardiomyopathy in Mice Lacking Transferrin Receptor in the Heart

Affiliations

Lethal Cardiomyopathy in Mice Lacking Transferrin Receptor in the Heart

Wenjing Xu et al. Cell Rep. .

Abstract

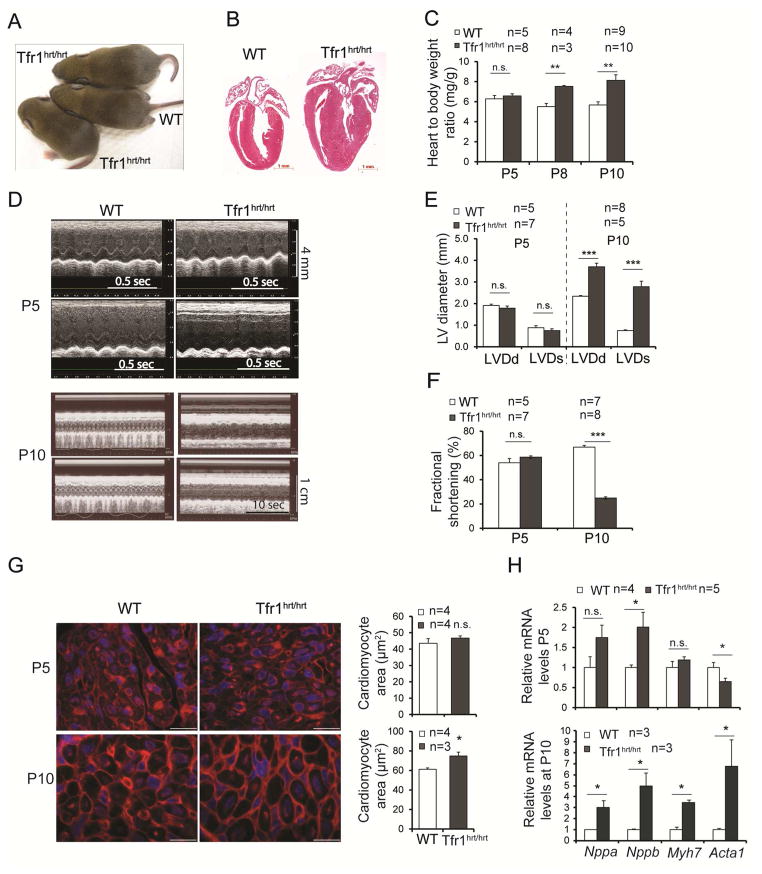
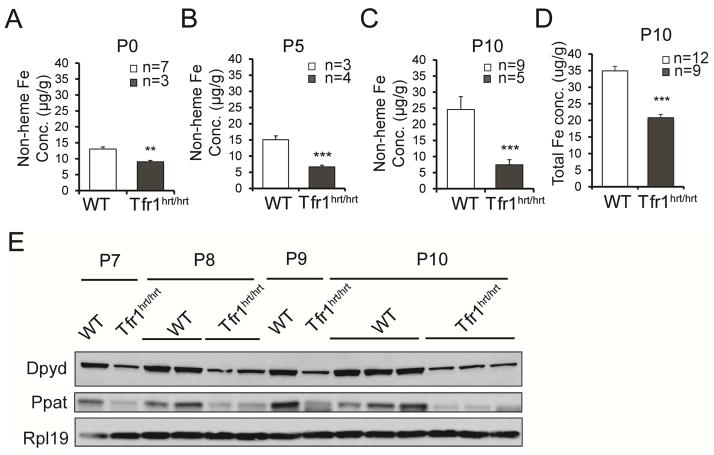
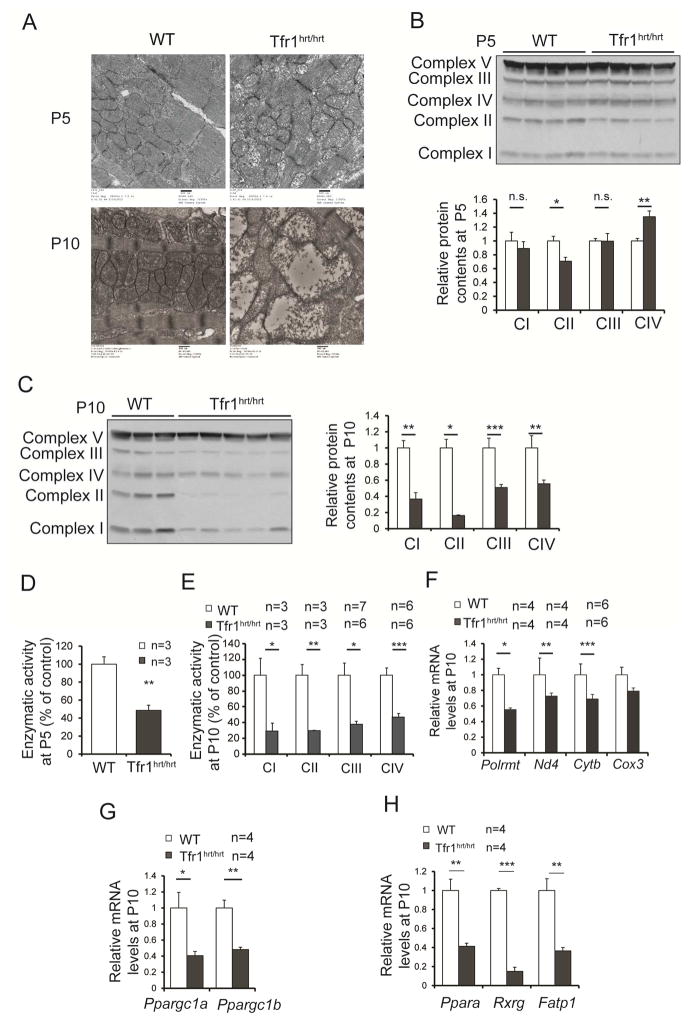
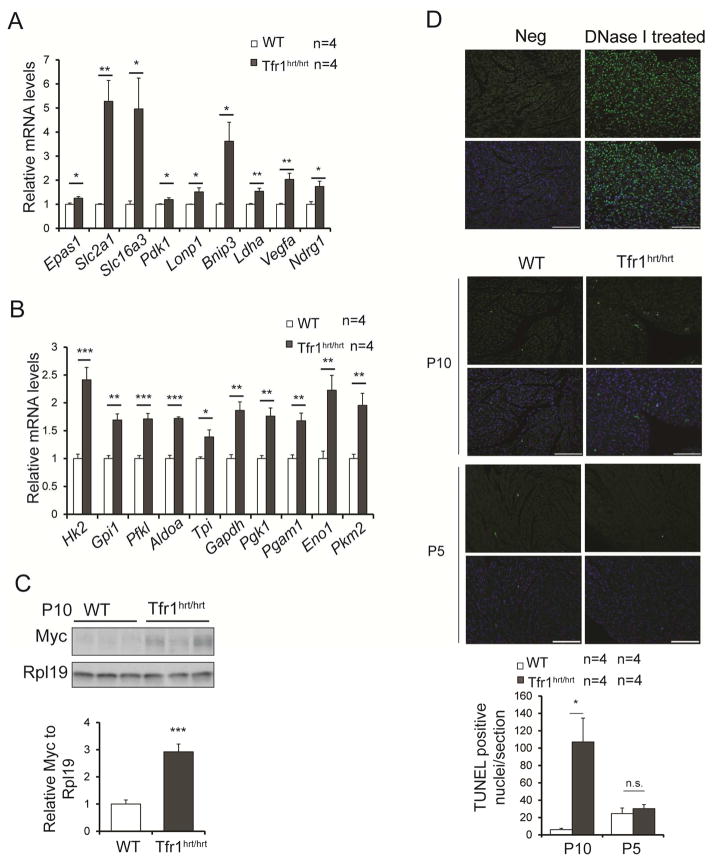
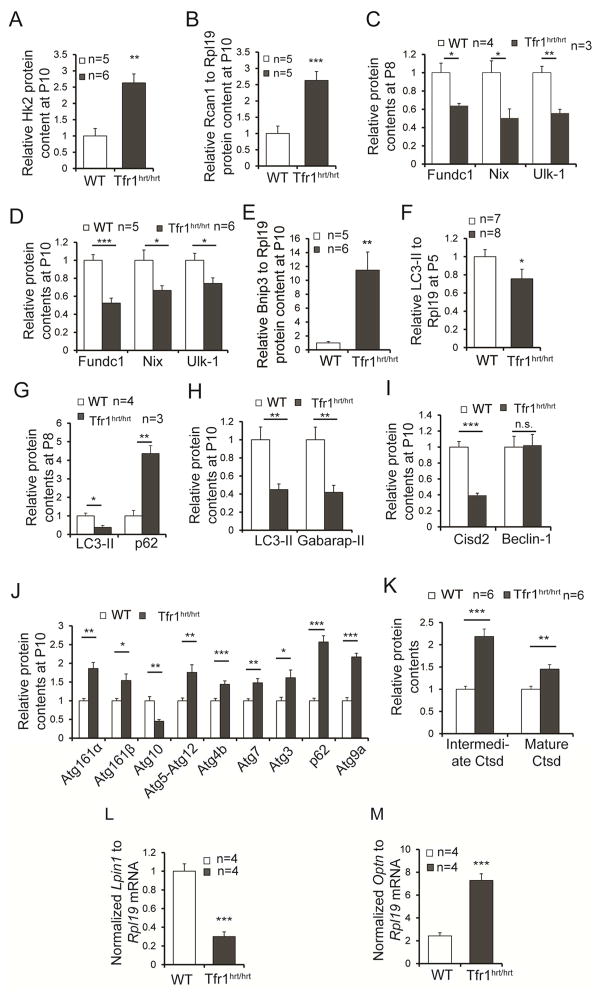
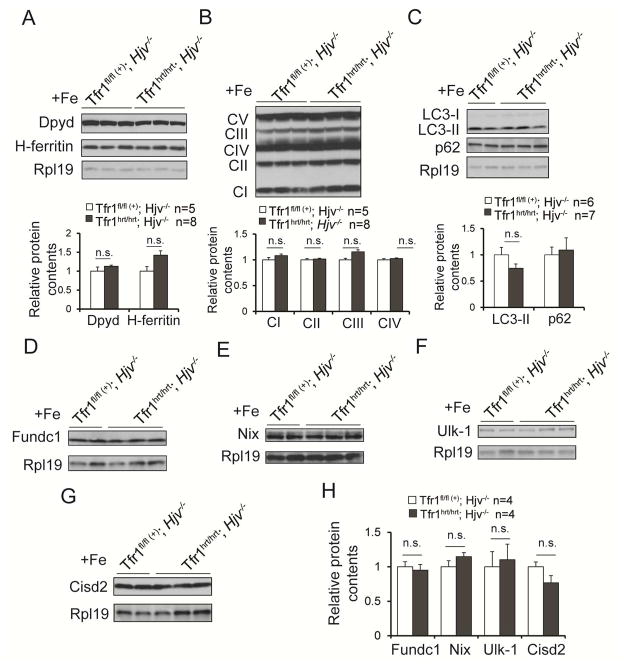
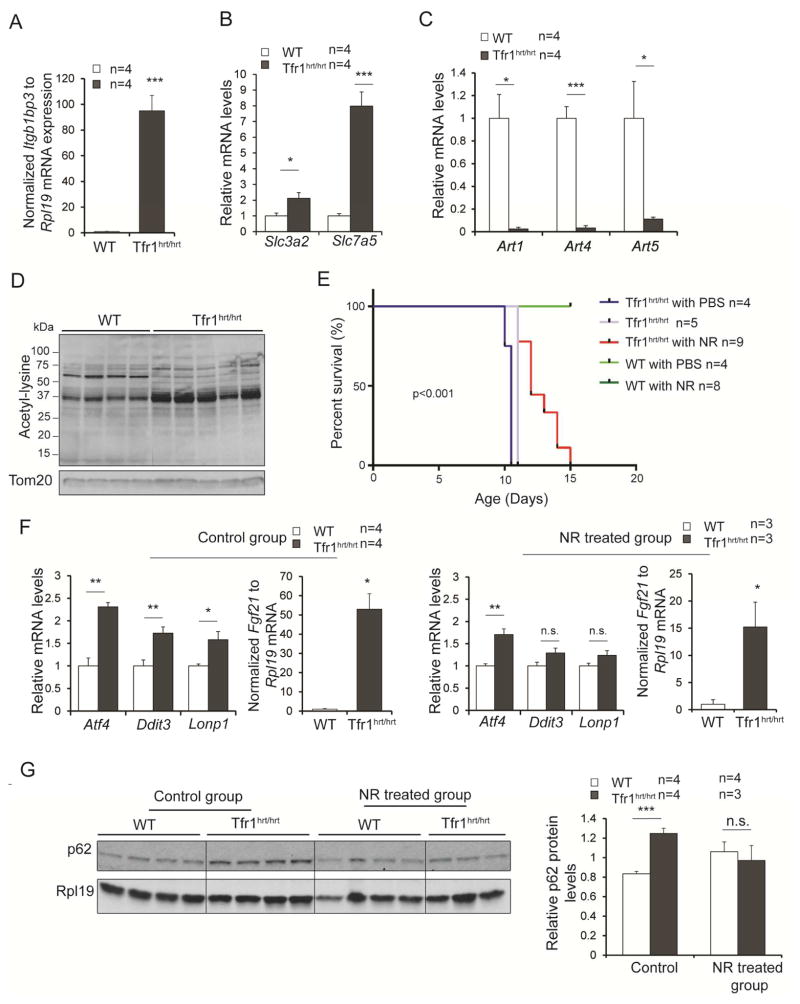
Both iron overload and iron deficiency have been associated with cardiomyopathy and heart failure, but cardiac iron utilization is incompletely understood. We hypothesized that the transferrin receptor (Tfr1) might play a role in cardiac iron uptake and used gene targeting to examine the role of Tfr1 in vivo. Surprisingly, we found that decreased iron, due to inactivation of Tfr1, was associated with severe cardiac consequences. Mice lacking Tfr1 in the heart died in the second week of life and had cardiomegaly, poor cardiac function, failure of mitochondrial respiration, and ineffective mitophagy. The phenotype could only be rescued by aggressive iron therapy, but it was ameliorated by administration of nicotinamide riboside, an NAD precursor. Our findings underscore the importance of both Tfr1 and iron in the heart, and may inform therapy for patients with heart failure.


Figures

Figure 1
Figure 1. Loss of Tfr1 in cardiomyocytes causes cardiomyopathy
(A) Tfr1hrt/hrt mice appeared grossly similar to WT at P10. (B) H&E staining of heart sections at P10, demonstrating cardiomegaly in Tfr1hrt/hrt mice. Scale bars=1 mm. (C) Tfr1hrt/hrt mice had normal heart to body ratios at P5, but cardiomegaly was apparent at P8 and P10. (D) Echocardiograms from representative Tfr1hrt/hrt and WT littermates at P5 (top) and P10 (bottom). For each age, upper panel, short axis; lower panel, long axis. Tfr1hrt/hrt mice have markedly impaired cardiac function at P10. (E) ,(F) Left ventricular diameter and fractional shortening were normal at P5 but abnormal in Tfr1hrt/hrt mice at P10. LVDd=left ventricular diameter in diastole; LVDs=left ventricular diameter in systole. (G) Representative images of WGA staining for cardiomyocyte morphometrics and quantitation showing Tfr1hrt/hrt cardiomyocyte area similar to WT at P5 (top) and enlarged Tfr1hrt/hrt cardiomyocytes at P10 (bottom). Scale bars=15 μm. (H) mRNA levels of cardiac hypertrophy biomarkers at P5 and P10 as described in the text. Data are presented as means ± SEM. Sample size (n) is indicated. *p < 0.05; **p < 0.01; ***p<0.001 by one-way ANOVA. See also Figure S1.
Figure 2
Figure 2. Iron deficiency and Fe-S cluster insufficiency in Tfr1hrt/hrt mice
(A–C) Non-heme iron levels in WT and mutant heart at P0 (A), P5 (B) and P10 (C). (D) Total iron concentration at P10. (E) Decreased Fe-S cluster proteins Dpyd and Ppat in hearts from Tfr1hrt/hrt mice; Rpl19 control. Ages and genotypes are shown at the top. Data are presented as means ± SEM. Sample size (n) is indicated. ***p<0.001 by one-way ANOVA.
Figure 3
Figure 3. Abnormal mitochondrial morphology and function in hearts from Tfr1hrt/hrt mice
(A) Electron micrographs comparing mitochondria in WT and Tfr1hrt/hrt hearts. Tfr1hrt/hrt mitochondria were slightly abnormal at P5 (top) but markedly enlarged and disrupted at P10 (bottom). Scale bars=500 nm. (B) Representative protein levels for ETC complexes by immunoblot at P5 using complex V as the standard. (C) Representative protein levels for ETC complexes by immunoblot at P10 using complex V as the standard. (D) Enzymatic activity of complex II of ETC from P5 Tfr1hrt/hrt and WT littermates (E) Enzymatic activity of complexes I to IV of ETC from P10 Tfr1hrt/hrt and WT littermates. (F) Relative mRNA levels of Polrmt and mitochondria-encoded genes at P10. (G) Relative mRNA levels of PGC1-α (Ppargc1a) and PGC1-β (Ppargc1b) at P10. (H) Relative mRNA levels of PPARα (Ppara), Rxr gamma (Rxrg), and fatty acid transport protein (Fatp1) at P10. Data are presented as means ± SEM. Sample size (n) is indicated. *p < 0.05; **p < 0.01; ***p<0.001 by one-way ANOVA. See also Figure S2.
Figure 4
Figure 4. Metabolic changes and increased apoptosis in hearts from Tfr1hrt/hrt mice at P10
(A) Relative mRNA levels of transcripts induced by hypoxia. (B) Relative mRNA levels of transcripts encoding enzymes of glycolysis. (C) Representative protein levels for Myc by immunoblot at P10. (D) TUNEL staining for apoptosis at both P10 and P5. Top row without DAPI staining of nuclei; bottom row with DAPI staining. Vertical pairs of panels from left to right: negative control, positive control, WT and Tfr1hrt/hrt at P10 and P5 respectively. Bright green fluorescent nuclei represent apoptotic cells; scale bars=100 μm. Results are quantified on the right; data are presented as means ± SEM. Sample size (n) is indicated;*p < 0.05; **p < 0.01; ***p<0.001 by one-way ANOVA. See also Figure S3.
Figure 5
Figure 5. Altered expression of molecules involved in autophagy and mitophagy in hearts from Tfr1hrt/hrt mice
Multiple autophagy- and mitophagy-related genes were examined in P10 (A,B,D,E,H–J), P8 (C,G), and P5 (F) heart samples for protein levels, as indicated in each panel. Differences suggested stimulation of autophagy but failure to complete autophagy in Tfr1hrt/hrt hearts. Sample sizes for WT and Tfr1hrt/hrt not shown in the figure panels: (H) 14 WT, 6 Tfr1hrt/hrt mice; (I) 3 WT and 5 Tfr1hrt/hrt mice for Cisd2; 5 mice each for Beclin1; (J) 5–6 mice of each genotype except for Atg4B (11 mice) and Atg3 (16 mice). (K) Lysosomal cathepsin D (Ctsd) and its cleaved intermediate were elevated in hearts from Tfr1hrt/hrt mice, indicating normal lysosomal function. (L) Lpin1 mRNA was decreased in hearts from Tfr1hrt/hrt mice. (M) Optineurin (Optn) mRNA was increased in hearts from Tfr1hrt/hrt mice. Data are presented as means ± SEM. Sample size (n) is indicated; *p < 0.05; **p < 0.01; ***p<0.001 by one-way ANOVA; n.s., not significant. See also Figure S4.
Figure 6
Figure 6. Rescue of Tfr1hrt/hrt mice with continuous iron
Iron overload achieved by Fe dextran administration to mutant animals and WT littermates at P3 and an Hjv−/− hemochromatosis background provided sufficient iron to fully rescue Tfr1hrt/hrt mice. (A) Dpyd and H-ferritin levels at 10 weeks. (B) Proteins representative of ETC complexes at 10 weeks. (C–H) Markers of autophagy, as indicated in the panels, at 10 weeks of age. Data are presented as means ± SEM. Sample size (n) is indicated; n.s., not significant by one-way ANOVA. See also Figure S5.
Figure 7
Figure 7. Transient rescue of Tfr1hrt/hrt mice by treatment with NR
(A) mRNA encoding Nmrk2/Itgb1bp3 was massively increased in Tfr1hrt/hrt mice. (B) mRNAs encoding Slc3a2 and Slc7a5, components of the uptake system for tryptophan, an NAD precursor, were increased in Tfr1hrt/hrt mice. (C) mRNAs encoding ADP-ribosyltransferases Art1, Art4 and Art5 were markedly decreased in Tfr1hrt/hrt mice. (D) Proteins from mitochondria isolated from Tfr1hrt/hrt heart showed increased lysine acetylation. (E) Administration of NR, an NAD precursor and Nmrk2 substrate, extended the lifespan of Tfr1hrt/hrt mice for up to 5 days. (F) Levels of UPRMT mRNAs in hearts from WT and Tfr1hrt/hrt mice that were untreated (control group, on left) or treated with NR (right). NR treatment appears to have blunted the UPRMT response. (G) p62 protein levels in hearts from WT and Tfr1hrt/hrt mice that were untreated or treated with NR. Data are presented as means ± SEM. P-values for (A) to (C) and (F) were determined by one-way ANOVA. Sample size (n) is indicated; P-value for (E) was determined by Logrank test as described in Supplemental Data; P-value for (G) was determined by two-way ANOVA followed by Bonferroni correction; *p < 0.05; **p<0.01; ***p<0.001.

Similar articles

Cited by

References

    1. Agah R, Frenkel PA, French BA, Michael LH, Overbeek PA, Schneider MD. Gene recombination in postmitotic cells. Targeted expression of Cre recombinase provokes cardiac-restricted, site-specific rearrangement in adult ventricular muscle in vivo. J Clin Invest. 1997;100:169–179. - PMC - PubMed
    1. Arany Z, He H, Lin J, Hoyer K, Handschin C, Toka O, Ahmad F, Matsui T, Chin S, Wu PH, et al. Transcriptional coactivator PGC-1 alpha controls the energy state and contractile function of cardiac muscle. Cell Metab. 2005;1:259–271. - PubMed
    1. Barger PM, Brandt JM, Leone TC, Weinheimer CJ, Kelly DP. Deactivation of peroxisome proliferator-activated receptor-alpha during cardiac hypertrophic growth. J Clin Invest. 2000;105:1723–1730. - PMC - PubMed
    1. Boado RJ, Li JY, Nagaya M, Zhang C, Pardridge WM. Selective expression of the large neutral amino acid transporter at the blood-brain barrier. Proc Natl Acad Sci U S A. 1999;96:12079–12084. - PMC - PubMed
    1. Bruick RK. Expression of the gene encoding the proapoptotic Nip3 protein is induced by hypoxia. Proc Natl Acad Sci U S A. 2000;97:9082–9087. - PMC - PubMed

Publication types