. 2015 Nov 2;125(11):4239-54.
doi: 10.1172/JCI81203. Epub 2015 Oct 12.

STK4 regulates TLR pathways and protects against chronic inflammation-related hepatocellular carcinoma

STK4 regulates TLR pathways and protects against chronic inflammation-related hepatocellular carcinoma

Weiyun Li et al. J Clin Invest. .

Abstract

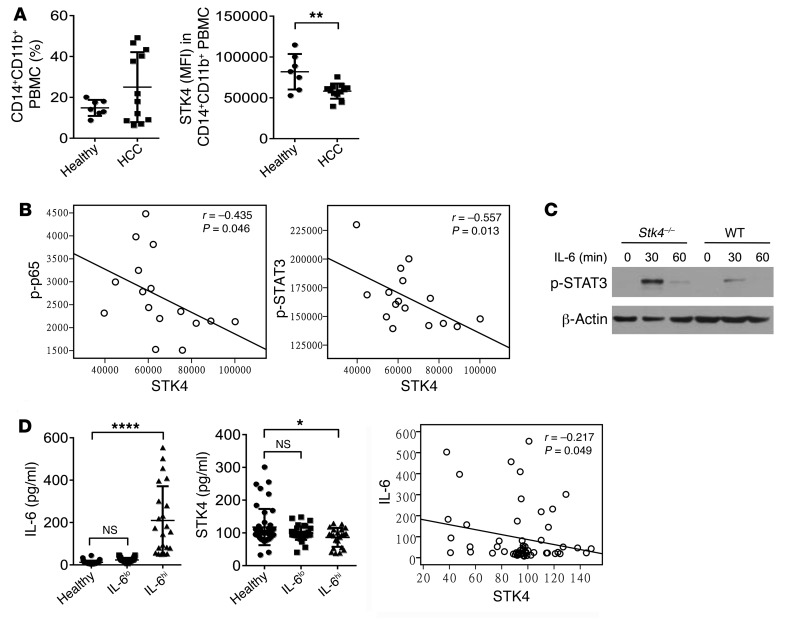
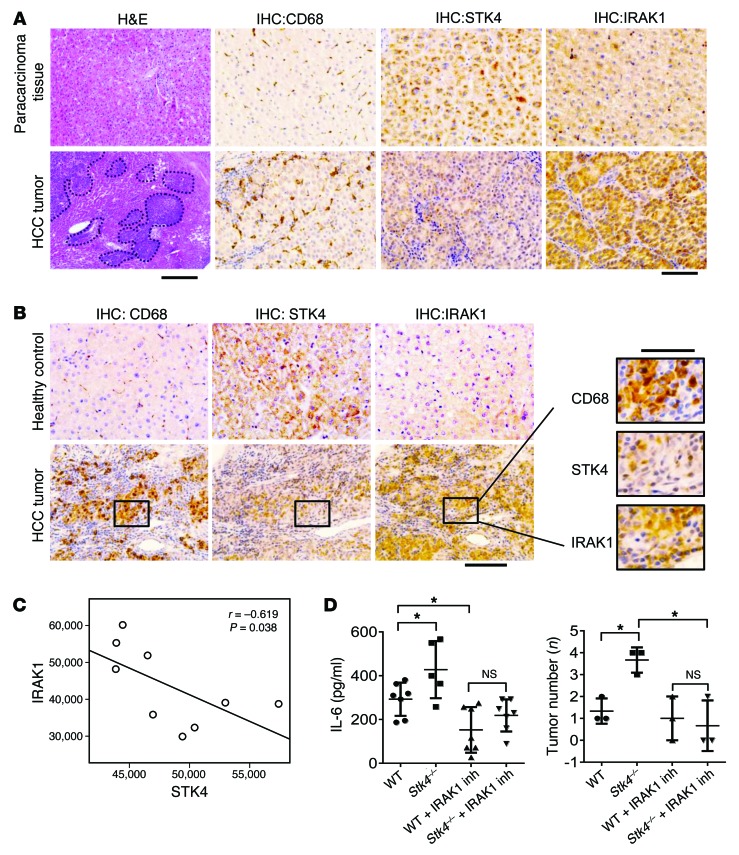
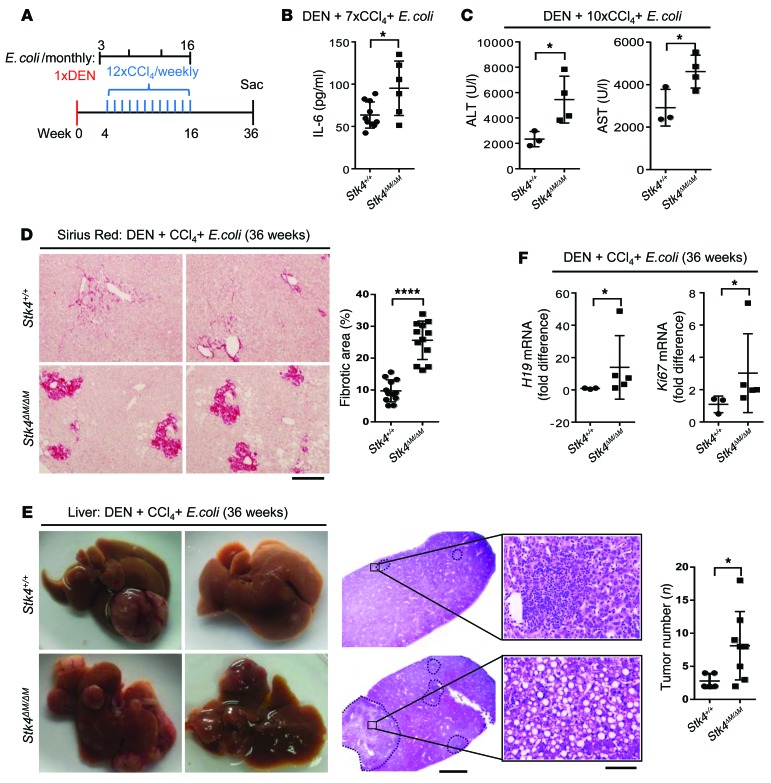
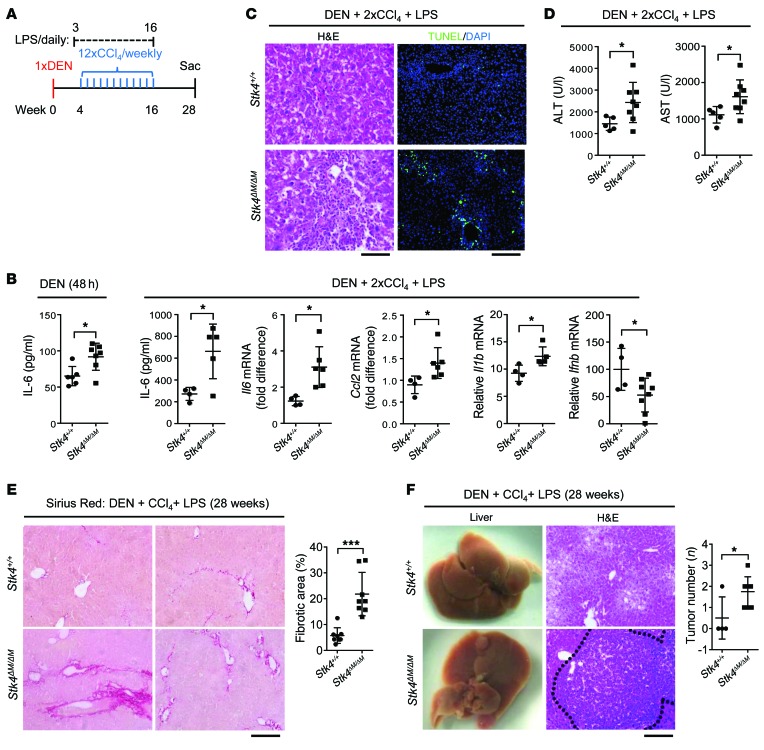
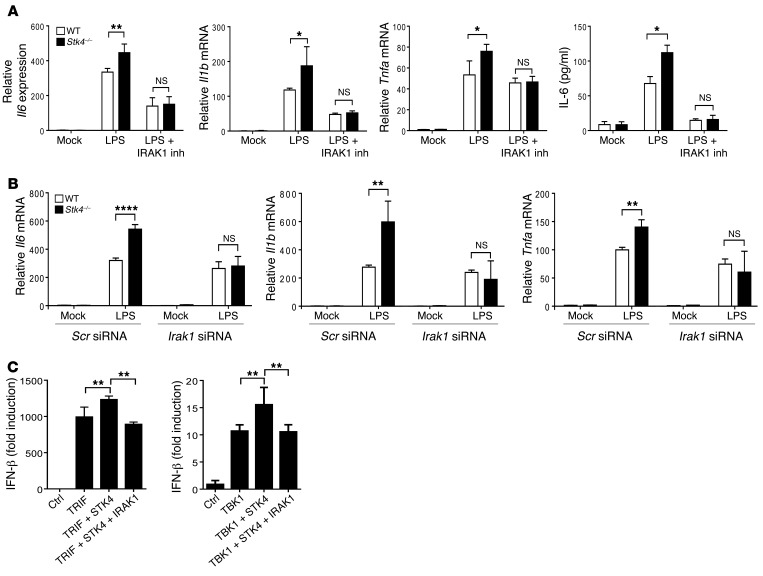
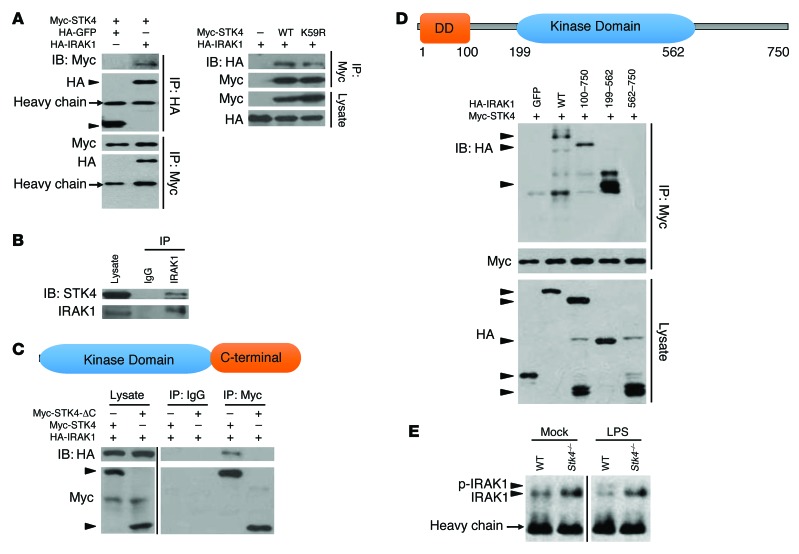
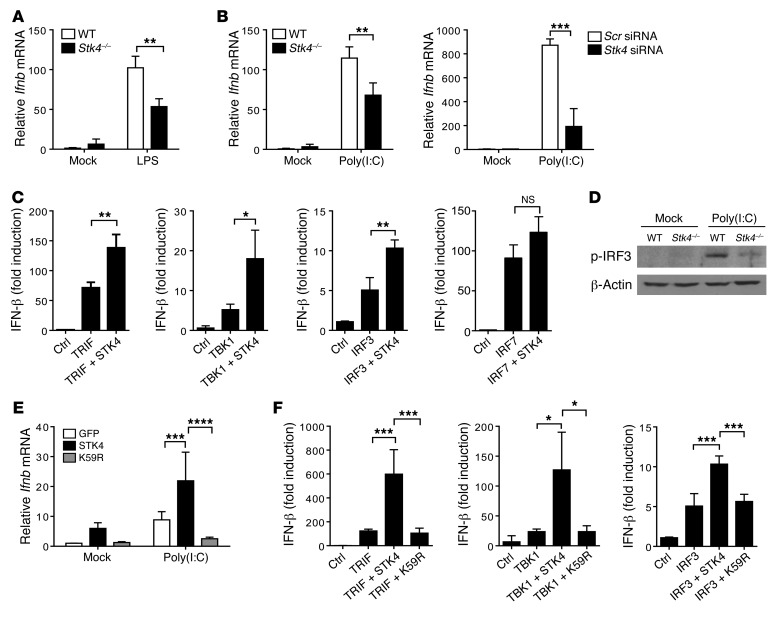
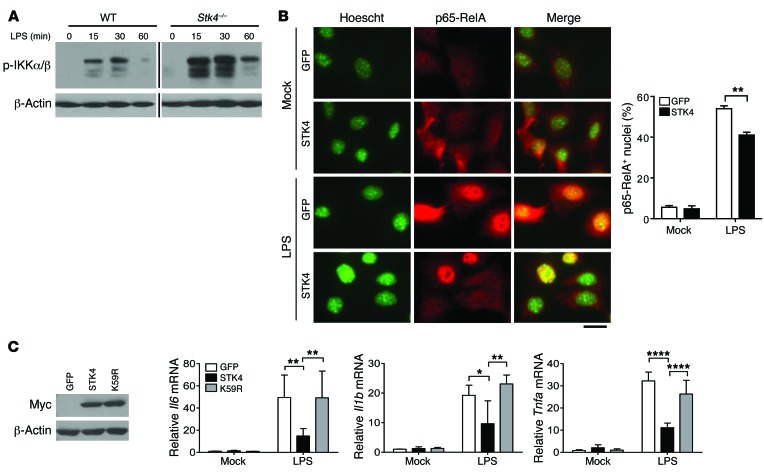
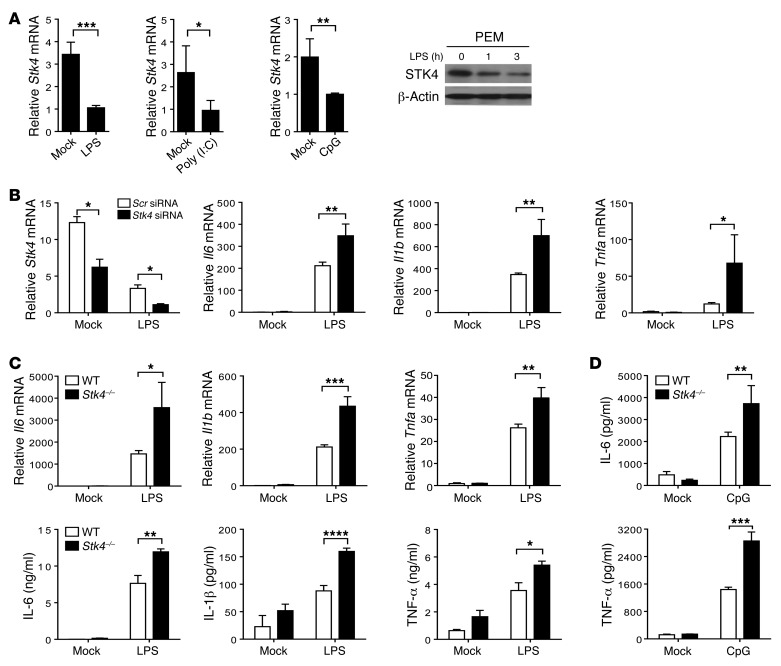
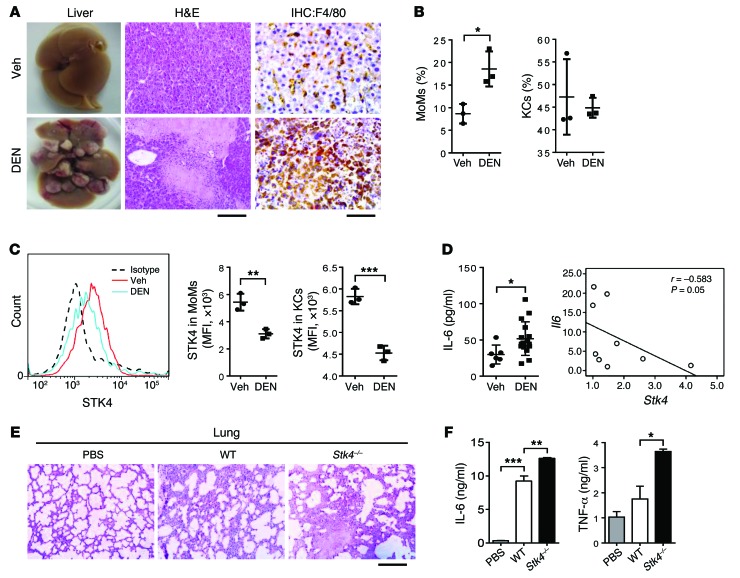
Hepatocellular carcinoma (HCC) is frequently associated with pathogen infection-induced chronic inflammation. Large numbers of innate immune cells are present in HCCs and can influence disease outcome. Here, we demonstrated that the tumor suppressor serine/threonine-protein kinase 4 (STK4) differentially regulates TLR3/4/9-mediated inflammatory responses in macrophages and thereby is protective against chronic inflammation-associated HCC. STK4 dampened TLR4/9-induced proinflammatory cytokine secretion but enhanced TLR3/4-triggered IFN-β production via binding to and phosphorylating IL-1 receptor-associated kinase 1 (IRAK1), leading to IRAK1 degradation. Notably, macrophage-specific Stk4 deletion resulted in chronic inflammation, liver fibrosis, and HCC in mice treated with a combination of diethylnitrosamine (DEN) and CCl4, along with either LPS or E. coli infection. STK4 expression was markedly reduced in macrophages isolated from human HCC patients and was inversely associated with the levels of IRAK1, IL-6, and phospho-p65 or phospho-STAT3. Moreover, serum STK4 levels were specifically decreased in HCC patients with high levels of IL-6. In STK4-deficient mice, treatment with an IRAK1/4 inhibitor after DEN administration reduced serum IL-6 levels and liver tumor numbers to levels similar to those observed in the control mice. Together, our results suggest that STK4 has potential as a diagnostic biomarker and therapeutic target for inflammation-induced HCC.


Figures

Figure 10
Figure 10. STK4 expression is inversely correlated with the levels of p-p65 and p-STAT3 in macrophages from human HCC samples.
(A and B) PBMCs from healthy (n = 7) and HCC patients (n = 12) were stained with anti-CD11b, anti-CD14, anti-STK4, anti-phospho65, and anti-phosphoSTAT3 for FACS analysis (2-tailed, unpaired Student’s t test), and their correlation (n = 16) was determined by Pearson’s test. (C) p-STAT3 levels were examined by immunoblotting in WT and Stk4–/– BMMs after IL-6 (100 ng/ml) treatment. (D) Plasma IL-6 and STK4 concentrations were evaluated from healthy (n = 40) and HCC patients (n = 59) to analyze their correlation using Pearson’s test. One-way ANOVA with Holm-Sidak’s multiple comparisons test was used. Data represent mean ± SD. *P < 0.05, **P < 0.01, and ****P < 0.0001.
Figure 9
Figure 9. The inverse correlation of STK4 expression with IRAK1 levels in macrophages from human HCC samples.
(A) HE staining (scale bar: 100 μm) and IHC staining (scale bar: 50 μm) with anti-CD68, anti-STK4, and anti-IRAK1 of human liver sections from paracarcinoma tissue and tumors of HCC patients. (B) The adjacent sections from human HCC tumors or healthy livers were stained with anti-CD68, anti-STK4, or anti-IRAK1 (scale bars: 50 μm). (C) IRAK1 and STK4 expression in liver-infiltrated macrophages from HCC patients was examined by FACS (n = 9), and their correlation was assessed with Pearson’s test. (D) Mice were i.p. injected the IRAK1/4 inhibitor (3 mg/kg, twice a week), starting 1 week before the first CCl4 injection. Serum IL-6 levels (WT [n = 7], Stk4–/– [n = 5], WT+IRAK1 Inh [n = 7], and Stk4–/– +IRAK1 Inh [n = 7]) were checked 6 weeks after DEN treatment (left panel), and liver tumor formation (n = 3) was detected by micro-CT imaging 18 weeks after DEN treatment (right panel). One-way ANOVA with Newman-Keuls or Holm-Sidak’s multiple comparisons test was used. Data represent mean ± SD. *P < 0.05.
Figure 8
Figure 8. STK4 protects mice from DEN and bacterial infection–induced HCC in vivo.
(A) Scheme of the DEN, CCl4, and E. coli–induced HCC model. Stk4+/+ and Stk4ΔM/ΔM mice were injected with DEN (100 mg/kg, i.p.). Four weeks later, these mice received 12 weekly injections of CCl4 (0.5 ml/kg, i.p.), plus 4 monthly E. coli infection (5,000 CFU i.v., starting 1 week before the first CCl4 injection). Mice were sacrificed 36 weeks after DEN treatment. (B) Serum IL-6 concentrations were determined from Stk4+/+ (n = 10) and Stk4ΔM/ΔM (n = 6) mice, which were treated with DEN, plus 7 injections of CCl4 and monthly E. coli infection. (C) Stk4+/+ (n = 3) and Stk4ΔM/ΔM (n = 4) male mice were treated with DEN, plus 10 injections of CCl4 and monthly E. coli infection. Serum ALT and AST levels were measured to assess liver injury. (DF) Stk4+/+ (n ≥ 3) and Stk4ΔM/ΔM (n > 5) mice were treated with DEN, plus 12 injections of CCl4 and monthly E. coli infection, and sacrificed at 36 weeks. Sirius Red staining (D, scale bar: 100 μm) or HE staining (E, scale bars: 2 mm [left], 50 μm [right]) of liver sections were shown. qRT-PCR was performed to assess mRNA levels of H19 and Ki67 in livers (F) (n ≥ 3). Data represent mean ± SD. *P < 0.05 and ****P < 0.0001 using 2-tailed, unpaired Student’s t test.
Figure 7
Figure 7. STK4 protects mice from DEN- and LPS-induced HCC in vivo.
(A) Scheme of the DEN-, CCl4-, and LPS-induced HCC model. Mice carrying macrophage-specific Stk4 deletion (Stk4ΔM/ΔM) and their littermate control (Stk4+/+) were i.p. injected with DEN (100 mg/kg). Four weeks later, these mice received weekly i.p. injections of CCl4 (0.5 ml/kg), plus daily subcutaneous injection of LPS (300 μg/kg, starting 1 week before the first CCl4 injection) for 12 weeks. Mice were sacrificed 28 weeks after DEN treatment. (B) Stk4+/+ (n ≥ 4) and Stk4ΔM/ΔM (n > 5) mice were treated with DEN for 48 hours, plus 2 weekly injections of CCl4 and daily injection of LPS. Serum IL-6 levels and mRNA levels of Il6, Il1b, Ccl2, and Ifnb in livers were determined. (C and D) Stk4+/+ (n = 5) and Stk4ΔM/ΔM (n = 8) mice were treated with DEN, plus 2 weekly injections of CCl4 and daily injection of LPS. HE staining (scale bars: 50 μm) and TUNEL assays (scale bar: 100 μm) of liver sections (C) or serum ALT and AST levels (D) were assessed. (E and F) Stk4+/+ (n = 4) and Stk4ΔM/ΔM mice (n = 8) were treated as described in (A) and sacrificed 28 weeks after DEN treatment. Sirius Red staining (E) or HE staining (F) of liver sections were performed (scale bars: 100 μm). Data represent mean ± SD. *P < 0.05 and ***P < 0.001 using 2-tailed, unpaired Student’s t test.
Figure 6
Figure 6. STK4 regulates the TLR3/4 pathways via IRAK1.
(A) WT and Stk4–/– BMMs were preincubated with the IRAK1/4 inhibitor or (B) PEMs were transfected with the scramble siRNA or Irak1 siRNA, followed by LPS treatment for 3 hours to measure mRNA levels of Il6, Il1b, and Tnfa by qRT-PCR or IL-6 concentrations in the supernatants by ELISA. 2-tailed, unpaired Student’s t test was used. (C) STK4, IRAK1, TRIF, and TBK1 were transfected with the IFN-β luciferase reporter into HEK293T cells to measure IFN-β luciferase activity. One-way ANOVA with Holm-Sidak’s multiple comparisons test was used. Data represent mean ± SD (n ≥ 4). *P < 0.05, **P < 0.01, and ****P < 0.0001.
Figure 5
Figure 5. STK4 binds to and phosphorylates IRAK1.
(A) HEK293T cells overexpressing HA-GFP, HA-IRAK1, Myc-STK4, or Myc-K59R were prepared for immunoprecipitation and immunoblotting with the indicated antibodies. (B) Immunoprecipitation was performed using anti-IRAK1 antibody from RAW264.7 cells, followed by immunoblotting with anti-IRAK1 or anti-STK4 antibodies. (C) HEK293T cells were transfected with HA-IRAK1 and Myc-STK4 or the C-terminal deletion mutant Myc-STK4-ΔC, followed by immunoprecipitation and immunoblotting with the indicated antibodies. (D) HEK293T cells were transfected with Myc-STK4 and HA-IRAK1 or its truncated mutants, including the N-terminal fragment (100-750aa), the kinase domain (199-562aa), and the C-terminal end (562-750aa). Immunoprecipitation using anti-Myc antibody was performed followed by immumoblotting. (E) Immunoprecipitation using anti-IRAK1 antibody was performed from WT and Stk4–/– BMMs, followed by anti-IRAK1 immunoblotting. Samples were run on the same gel but not contiguous, as indicated by the black line. (AE). Data represent the representative experiments from at least 3 independent experiments.
Figure 4
Figure 4. STK4 increases TLR3/4-induced IFN-β production in macrophages.
(A) WT and Stk4–/– BMMs were stimulated with LPS for 3 hours to evaluate mRNA levels of Ifnb by qRT-PCR. (B) WT and Stk4–/– BMMs (left), or PEMs transfected with Stk4 siRNA or scramble siRNA (right) were exposed to poly(I:C) for 3 hours to assess Ifnb mRNA levels. (C) TRIF, TBK1, IRF3, or IRF7 were overexpressed with STK4 and the IFN-β luciferase reporter plasmid in HEK293T cells to measure IFN-β luciferase activity. The cotransfected Renilla was used as an internal control. (D) IRF-3 phosphorylation levels in poly(I:C)-treated WT or Stk4–/– BMMs were checked by immunoblotting analysis. (E) Primary MEF cells overexpressing GFP, STK4, or the K59R mutant were stimulated with poly(I:C) to determine Ifnb mRNA levels. (F) TRIF, TBK1, and IRF3 were transfected with STK4 or K59R and the IFN-β luciferase reporter plasmid into HEK293T cells to measure IFN-β luciferase activity. Data represent mean ± SD (n ≥ 3). *P < 0.05, **P < 0.01, ***P < 0.001, and ****P < 0.0001 using 2-tailed, unpaired Student’s t test (AC), 2-way ANOVA (E), or 1-way (F) with Holm-Sidak’s multiple comparisons test.
Figure 3
Figure 3. STK4 kinase activity is critical to inhibit TLR4/NF-κB activation.
(A) The levels of phosphorylated IKKα/β in LPS-stimulated WT and Stk4–/– BMMs were detected by immunoblotting analysis. Samples were run on the same gel but not contiguous, as indicated by the black line. (B) Primary MEF cells overexpressing GFP or STK4 were treated with or without LPS, followed by immunostaining with Hoechst and anti–p65-RelA (scale bar: 20 μm, representative images). The number of p65-RelA+ nuclei was counted from >50 cells (mean ± SD using 2-tailed, unpaired Student’s t test). (C) Primary MEFs overexpressing GFP, STK4, or the K59R mutant were stimulated with LPS to detect mRNA levels of Il6, Il1b, and Tnfa. Values were normalized for β-actin mRNA levels (mean ± SD, n = 4, 2-way ANOVA with Holm-Sidak’s multiple comparisons test). *P < 0.05, **P < 0.01, and ***P < 0.0001.
Figure 2
Figure 2. STK4 dampens TLR4/9-induced proinflammatory cytokine production.
(A) Stk4 expression at mRNA level or protein level was assessed in PEMs, which were stimulated with 1 μg/ml LPS, 10 μg/ml poly(I:C), or 2 μg/ml CpG ODN for 6 hours. (B) PEMs were transfected with Stk4 siRNA or the scramble control (40 nM) followed by LPS stimulation for 6 hours to assess mRNA levels of Stk4, Il6, Il1b, and Tnfa. (C and D) WT and Stk4–/– BMMs were stimulated with 1 μg/ml LPS (C) or 2 μg/ml CpG ODN (D) for 6 hours to detect IL-6, IL-1β, and TNF-α expression by qRT-PCR or ELISA. Data represent mean ± SD (n ≥ 4). *P < 0.05, **P < 0.01, ***P < 0.001, and ****P < 0.0001 using 2-tailed, unpaired Student’s t test.
Figure 1
Figure 1. Reduced STK4 expression is associated with DEN-induced HCC and excessive inflammation.
(AC) WT male mice were treated with controls (Veh) or DEN (50 mg/kg) to induce HCC and were sacrificed 11 months after DEN injection (n = 3). (A) HE staining (scale bar: 100 μm) or IHC staining with anti-F4/80 (scale bar: 50 μm) of mouse livers. (B and C) Percentages of intrahepatic MoMs or KCs, and STK4 expression levels were analyzed by FACS. (D) Eleven months after Veh (n > 4) or DEN (n > 7) treatment, serum IL-6 concentrations were detected by ELISA. The correlation of Il6 and Stk4 mRNA levels in intrahepatic immune cells were analyzed by Spearman’s test (n = 9). (E and F) Ten hours after LPS challenge (3 mg/mouse, i.p.) of WT (n = 3) and Stk4–/– mice (n = 3), HE staining of lungs (scale bar: 100 μm) or serum IL-6 and TNF-α concentrations were measured. Values are mean ± SD from 2 independent experiments. Data represent mean ± SD. *P < 0.05, **P < 0.01, and ***P < 0.001, using 2-tailed, unpaired Student’s t test (BD) or 1-way ANOVA with Holm-Sidak’s multiple comparisons test (F).

References

    1. Hussain SP, Harris CC. Inflammation and cancer: an ancient link with novel potentials. Int J Cancer. 2007;121(11):2373–2380. doi: 10.1002/ijc.23173. - DOI - PubMed
    1. Yang L, Karin M. Roles of tumor suppressors in regulating tumor-associated inflammation. Cell Death Differ. 2014;21(11):1677–1686. doi: 10.1038/cdd.2014.131. - DOI - PMC - PubMed
    1. Dapito DH, et al. Promotion of hepatocellular carcinoma by the intestinal microbiota and TLR4. Cancer Cell. 2012;21(4):504–516. doi: 10.1016/j.ccr.2012.02.007. - DOI - PMC - PubMed
    1. Aksoy E, et al. The p110delta isoform of the kinase PI(3)K controls the subcellular compartmentalization of TLR4 signaling and protects from endotoxic shock. Nat Immunol. 2012;13(11):1045–1054. doi: 10.1038/ni.2426. - DOI - PMC - PubMed
    1. Liew FY, Xu D, Brint EK, O’Neill LA. Negative regulation of toll-like receptor-mediated immune responses. Nat Rev Immunol. 2005;5(6):446–458. doi: 10.1038/nri1630. - DOI - PubMed

Publication types

MeSH terms

Substances