. 2015 Nov;21(11):1307-17.
doi: 10.1038/nm.3960. Epub 2015 Oct 12.

PAR1 signaling regulates the retention and recruitment of EPCR-expressing bone marrow hematopoietic stem cells

Affiliations

PAR1 signaling regulates the retention and recruitment of EPCR-expressing bone marrow hematopoietic stem cells

Shiri Gur-Cohen et al. Nat Med. 2015 Nov.

Erratum in

Abstract

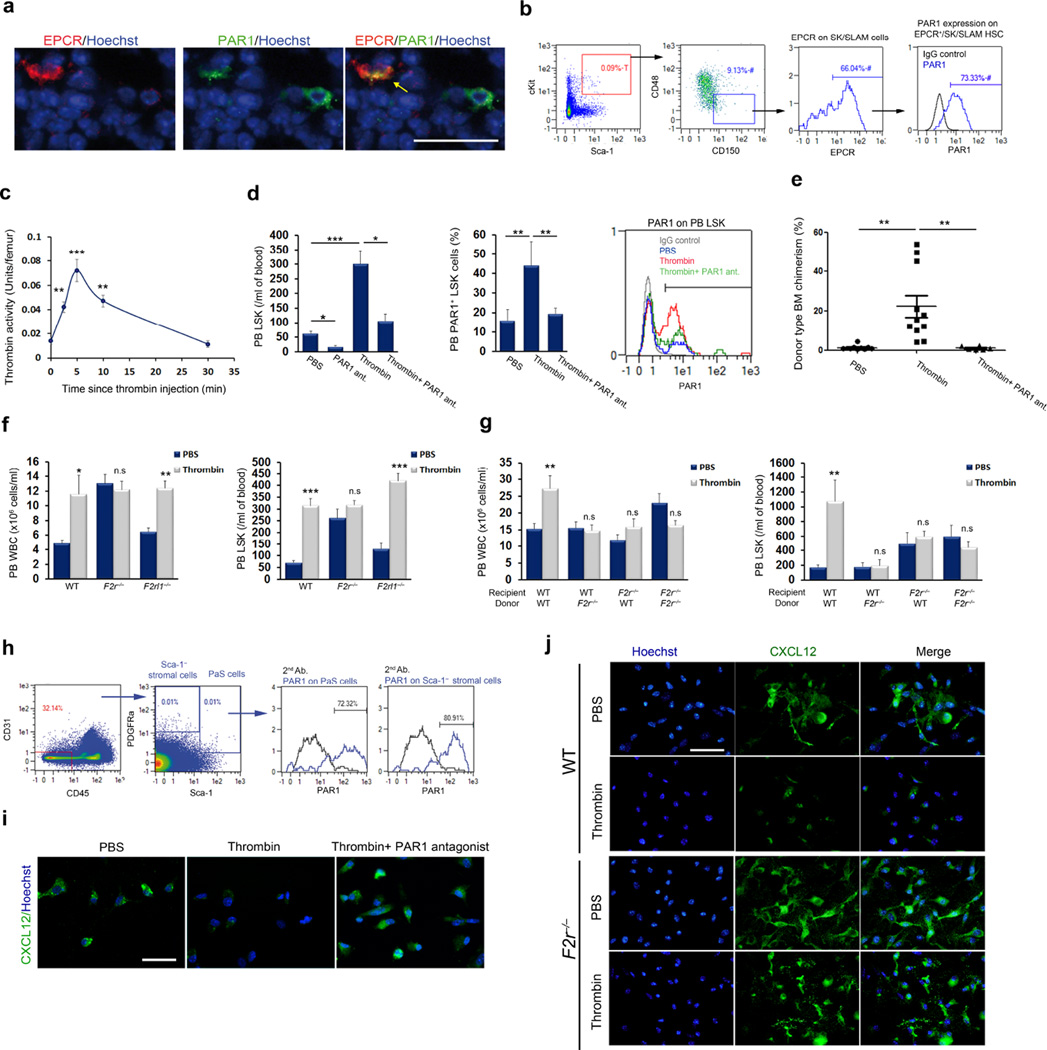
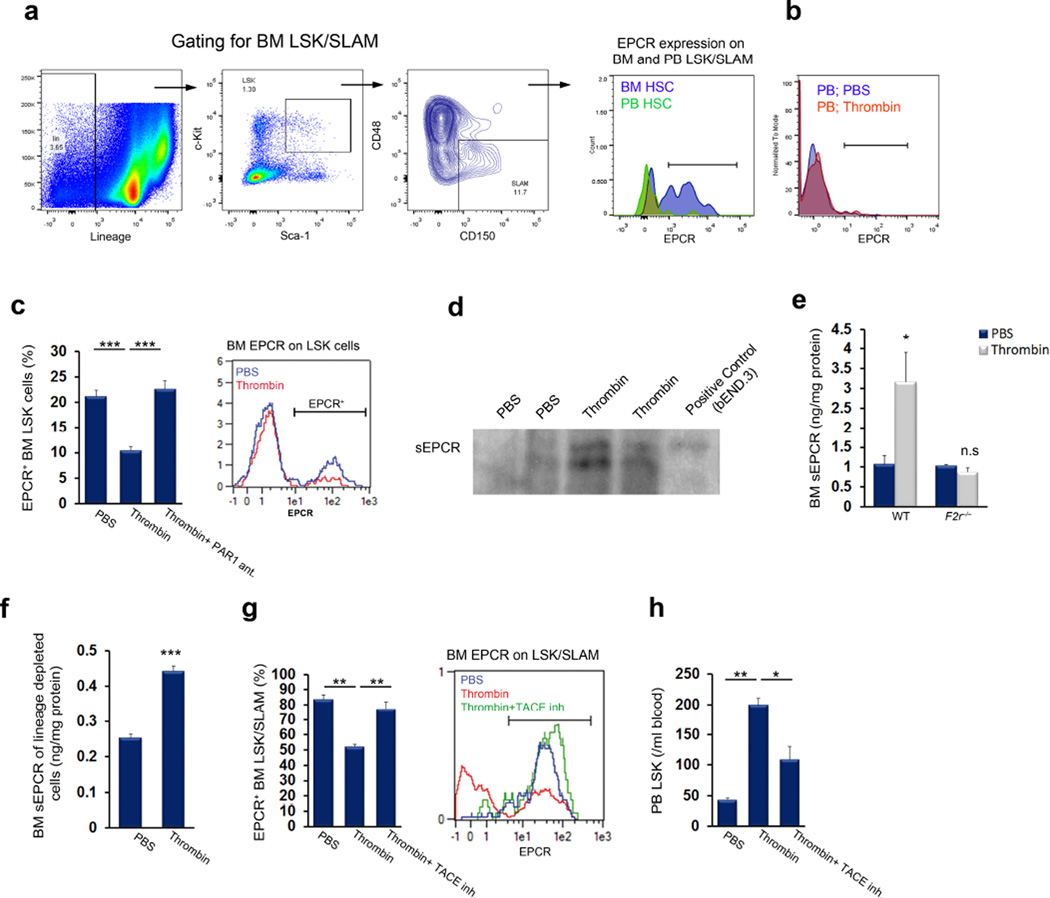
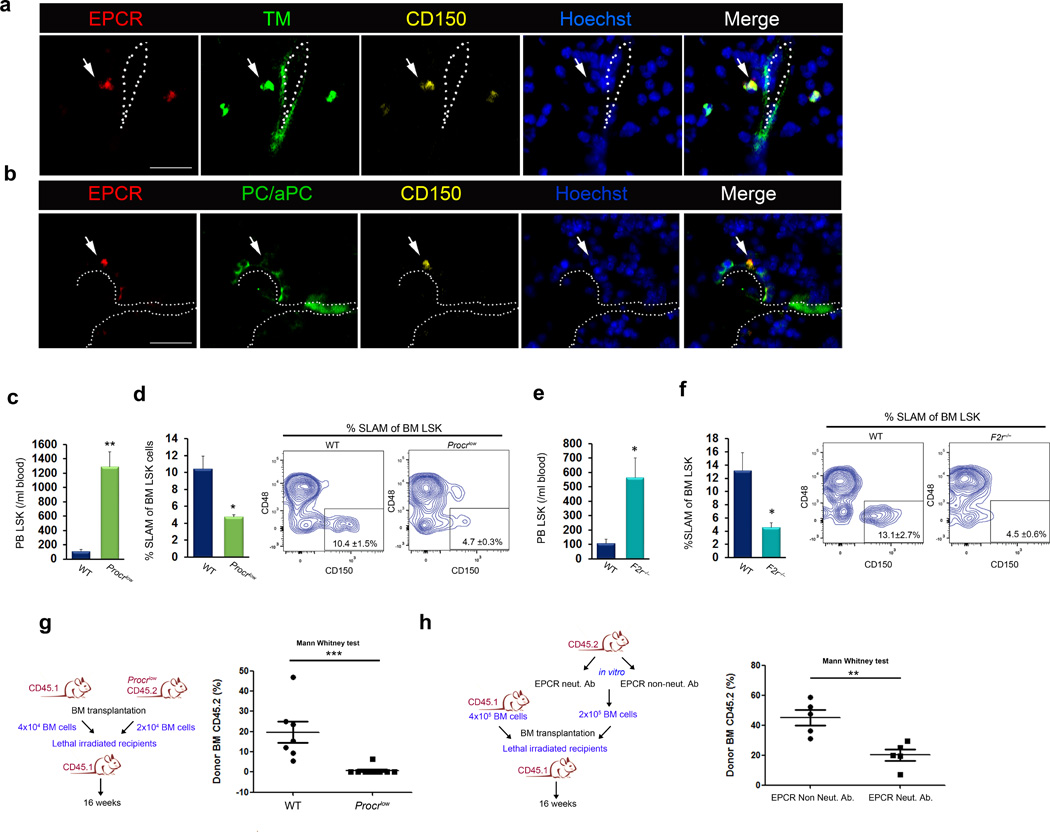
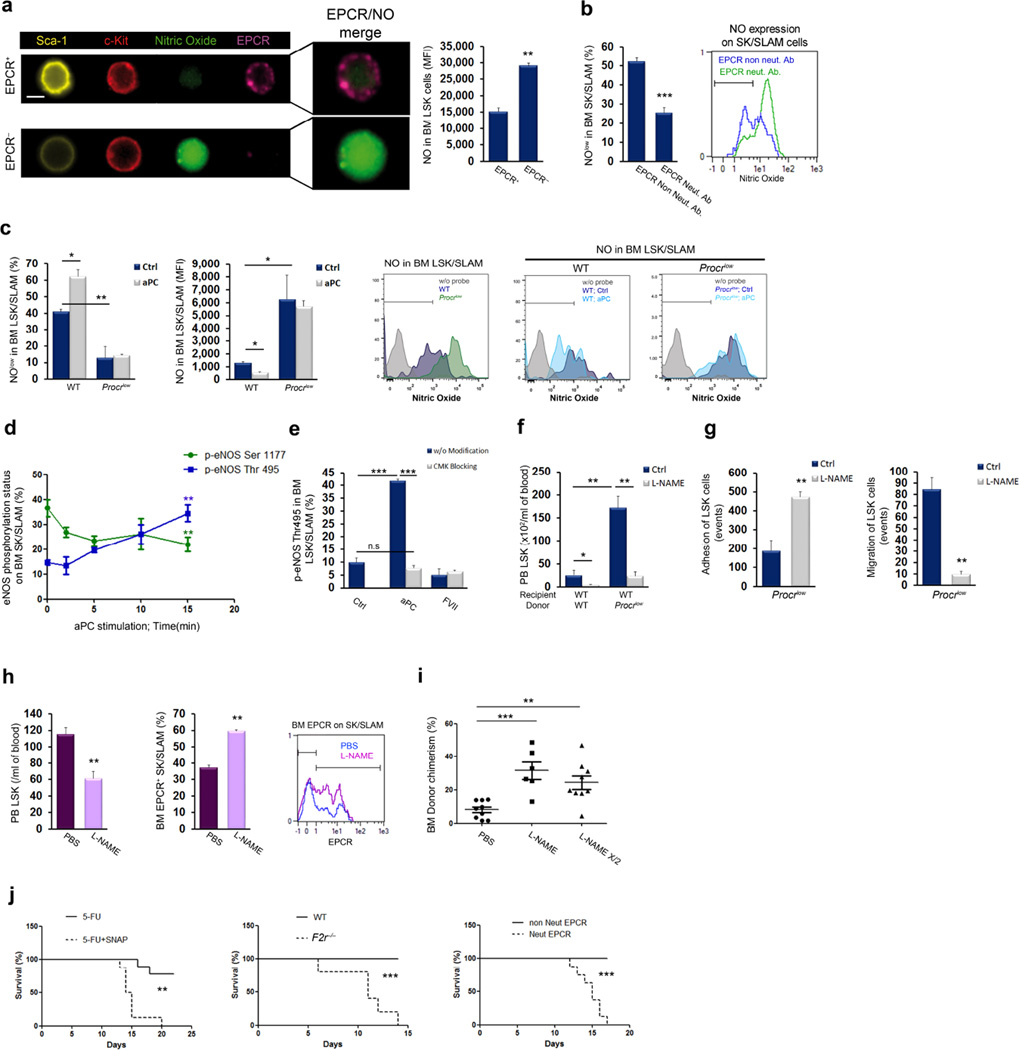
Retention of long-term repopulating hematopoietic stem cells (LT-HSCs) in the bone marrow is essential for hematopoiesis and for protection from myelotoxic injury. We report that signaling cascades that are traditionally viewed as coagulation related also control retention of endothelial protein C receptor-positive (EPCR(+)) LT-HSCs in the bone marrow and their recruitment to the blood via two pathways mediated by protease activated receptor 1 (PAR1). Thrombin-PAR1 signaling induces nitric oxide (NO) production, leading to EPCR shedding mediated by tumor necrosis factor-α-converting enzyme (TACE), enhanced CXCL12-CXCR4-induced motility and rapid stem and progenitor cell mobilization. Conversely, bone marrow blood vessels provide a microenvironment enriched with activated protein C (aPC) that retains EPCR(+) LT-HSCs by limiting NO generation, reducing Cdc42 activity and enhancing integrin VLA4 affinity and adhesion. Inhibition of NO production by aPC-EPCR-PAR1 signaling reduces progenitor cell egress from the bone marrow, increases retention of bone marrow NO(low) EPCR(+) LT-HSCs and protects mice from chemotherapy-induced hematological failure and death. Our study reveals new roles for PAR1 and EPCR in controlling NO production to balance maintenance and recruitment of bone marrow EPCR(+) LT-HSCs, with potential clinical relevance for stem cell transplantation.


Figures

Figure 1
Figure 1. Thrombin-PAR1 signaling induces HSC recruitment
(a) Immunohistochemistry for EPCR (red), PAR1 (green) and nuclei (blue) in bone marrow of wild-type mice; scale bar, 20 µm. (b) FACS analysis of PAR1 expression by bone marrow EPCR+ SK/SLAM cells. The letter ‘T’ represents percentage out of total population and the ‘#’ symbol represents percentage out of the previous gate. (c) Thrombin activity in the bone marrow measured at the indicated times following thrombin injection; n = 5. (d) Peripheral blood (PB) LSK and PAR1+ LSK cells (n = 4) following thrombin injection with (n = 8) or without (n = 14) PAR1 antagonist; P values, one-way ANOVA with Tukey’s post-test. (e) Long-term competitive reconstitution assays of thrombin-mobilized HSCs, with or without PAR1 antagonist, versus PBS control. Donor cell chimerism 16 weeks after transplantation is plotted; each dot represents one mouse. P values, one-way ANOVA with Tukey’s post-test. (f) Circulating white blood cells (WBC) and LSK cells in wild-type (WT), F2r−/− or F2rl1−/− mice following thrombin injection; n = 4, P values, two-way ANOVA with Tukey’s post-test. (g) Circulating WBC and LSK cells following thrombin treatment of wild-type (n = 8) or F2r−/− bone marrow chimeras; n = 8 for hematopoietic F2r−/− chimeras and n = 4 for stromal F2r−/− chimeras. P values, two-way ANOVA with Bonferroni post-test. (h) FACS analysis of PAR1 expression by PDGFRα+Sca1+CD45CD31 PαS cells and Sca-1 stromal cells isolated from the bone marrow of wild-type mice. (i) Immunohistochemistry staining of CXCL12 (green) and nuclei (blue) in stromal cultures of wild-type bone marrow, stimulated with thrombin with or without PAR1 antagonist; scale bar, 20 µm. (j) Immunohistochemistry staining of CXCL12 (green) and nuclei (blue) in stromal cultures of wild-type or F2r−/− bone marrow with or without thrombin stimulation; scale bar, 20 µm.
Figure 2
Figure 2. Thrombin-PAR1-dependent EPCR shedding induces HSC mobilization
(a) FACS analysis of EPCR expression on circulating and bone marrow (BM) LSK SLAM cells; representative data are shown for 4 mice. (b) FACS analysis of EPCR expression on circulating LSK cells in mice treated with thrombin or PBS; representative data are shown for 4 mice. (c) Bone marrow EPCR+ LSK cells following thrombin injection with (n = 4) or without (n = 8) administration of a PAR1 antagonist; P values, one-way ANOVA with Tukey’s post-test. (d,e) Soluble EPCR (sEPCR) in bone marrow fluid 1 hour after thrombin injection, as measured by western blotting (d) or ELISA (e) in wild-type or F2r−/− mice; n = 4. (f) sEPCR ELISA following thrombin stimulation in vitro in lineage-depleted bone marrow cells; n = 4. (g,h) Bone marrow EPCR+ LSK SLAM cells (g) and peripheral blood LSK cells (h) in PBS or thrombin-treated mice, with or without pretreatment with TACE inhibitor for 1 hour before thrombin injection; n = 4; P values, one-way ANOVA with Tukey’s post-test.
Figure 3
Figure 3. A TM- and aPC-enriched bone marrow endothelial microenvironment regulates EPCR+ HSC retention
(a) Immunohistochemistry for EPCR (red), thrombomodulin (TM; green), CD150 (yellow) and nuclei (blue) in the bone marrow of wild-type mice. Scale bar, 20 µm. (b) Immunohistochemistry for EPCR (red), PC/aPC (green), CD150 (yellow) and nuclei (blue) in the bone marrow of wild-type mice. Scale bar, 20 µm. (c) Circulating LSK cells and (d) bone marrow LSK SLAM cells in wild-type or Procrlow mice; mean ± s.e.m, n = 4. (e,f) Circulating LSK cells (e) and bone marrow LSK SLAM cells (f) in wild-type or F2r−/− mice; n = 4. (g) Bone marrow competitive repopulation assay using bone marrow from wild-type and Procrlow mice. Repopulation was assessed 16 weeks following transplantation; each dot represents an individual recipient mouse. P values, one-way ANOVA with Mann-Whitney post-test. (h) Bone marrow competitive repopulation assay of wild-type bone marrow cells pretreated with either EPCR non-inhibitory or EPCR neutralizing antibody for 60 minutes. Repopulation was assessed 16 weeks following transplantation; each dot represents an individual recipient mouse. P values, one-way ANOVA with Mann-Whitney post-test.
Figure 4
Figure 4. aPC-EPCR-PAR1 signaling retains HSCs by inducing Cdc42 polarity and stabilizing VLA4
(a) Cdc42 (purple) distribution in bone marrow EPCR+ (yellow) and EPCR Lineage negative Sca-1+ (pink) c-Kit+ (red) cells. Scale bar, 7 µm; n = 4. (b) Cdc42 (green) distribution in bone marrow EPCR+ (yellow) SK SLAM cells pretreated with EPCR non-inhibitory or EPCR neutralizing antibody. Scale bar, 7 µm; n = 5. (c) Active Cdc42-GTP (green) in bone marrow EPCR+ SK SLAM (yellow) and EPCR LSK cells. Scale bar, 7 µm; n = 5. (d) Active Cdc42-GTP (green) in bone marrow EPCR+ (yellow) SK SLAM cells pretreated with EPCR non-inhibitory or EPCR neutralizing antibody. Scale bar, 7 µm; n = 4. (e) VLA4 expression on bone marrow EPCR+ or EPCR SK SLAM cells; n = 4. (f) VLA4 affinity measured by LDV probe binding to bone marrow EPCR+ SK SLAM cells following in vitro stimulation with aPC of cells that had been pretreated with EPCR neutralizing antibody or control EPCR non-inhibitory antibody for 30 minutes; n = 7. (g) VLA4 affinity of bone marrow SK SLAM cells from wild-type or Procrlow mice following in vitro treatment with aPC for 1 hour; n = 3. (h) VLA4 expression on bone marrow SK SLAM cells from wild-type or Procrlow mice; n = 3. (i) VLA4 expression on bone marrow SK SLAM cells and VLA4 affinity on bone marrow EPCR+ SK SLAM cells from wild-type or F2r−/− mice; n = 3. (j) Peripheral blood LSK and EPCR+ LSK cell frequencies following EPCR or VLA4 neutralization in vivo; n = 4, P values, one-way ANOVA with Tukey’s post-test for left panel and Dunn’s post-test for right panel.
Figure 5
Figure 5. Thrombin-PAR1 signaling induces NO production and HSC mobilization
(a) NO levels in SLAM cells obtained from the bone marrow and peripheral blood. NOlow gating represents baseline reactivity; n = 3. (b) FACS analysis of eNOS Ser1177 phosphorylation in BM LSK cells 30 minutes following thrombin injection; n = 4. (c) Kinetics of eNOS phosphorylation on Ser1177 and Thr495 in bone marrow LSK cells following in vitro thrombin stimulation; n = 4. (d) Circulating LSK cells and bone marrow EPCR+ LSK cells following thrombin injection in mice pretreated with or without l-NAME; n = 6, P values, one-way ANOVA with Tukey’s post-test. (e) Circulating LSK cells and bone marrow EPCR+ LSK cells in wild-type or Nos3−/− bone marrow chimeric mice following thrombin injection; n = 4. (f) Circulating LSK cells and bone marrow EPCR+ LSK cells 60 minutes after SNAP injection; n = 4. (g) Cdc42 (purple) distribution on bone marrow EPCR+ (yellow) LSK cells 10 minutes following in vivo thrombin treatment. Scale bar, 7 µm. (h) FACS analysis of Cdc42-GTP following in vitro thrombin treatment for 15 minutes of bone marrow SK SLAM cells that had been pretreated with or without l-NAME for 2 hours; n = 4, P values, one-way ANOVA with Tukey’s post-test. (i) Cdc42-GTP in bone marrow SK SLAM cells (left) and LDV-FITC binding to bone marrow EPCR+ SK SLAM cells (right) following in vitro treatment with SNAP for 15 minutes; n = 4.
Figure 6
Figure 6. aPC-EPCR signaling limits NO production and promotes LT-HSC retention
(a) NO (green) levels in BM LSK EPCR+ (purple) and EPCR lineage negative Sca-1+ (yellow) c-Kit+ (red) cells. Scale bar, 7 µm. (b) Percentage of NOlow SK SLAM cells following in vitro treatment of bone marrow cells with EPCR neutralizing or non-neutralizing antibody; n = 4. (c) Percentage of NOlow cells and NO levels in wild-type or Procrlow bone marrow LSK SLAM cells, with or without in vitro aPC treatment for 1 hour; n = 3, P values, two-way ANOVA with Bonferroni post-test. (d) Kinetics of eNOS phosphorylation on Ser1177 or Thr495 in bone marrow SK SLAM cells following in vitro aPC stimulation; n = 4. (e) eNOS phosphorylation on Thr495 in bone marrow LSK SLAM cells following in vitro stimulation with aPC for 15 minutes, active-site blocked aPC, FVIIa, or active-site blocked FVIIa; n = 4, P values, one-way ANOVA with Tukey’s post-test. (f) Circulating LSK cells in wild-type or Procrlow chimeric mice following prolonged l-NAME treatment for 5 days; n = 5, P values, two-way ANOVA with Bonferroni post-test. (g) Adhesion and migration of Procrlow bone marrow LSK cells following in vitro l-NAME or PBS treatment for 2 hours; n = 6. (h) Circulating LSK (n = 8), bone marrow EPCR+ SK SLAM cells (n = 4) and representative FACS plot for EPCR expression following prolonged l-NAME or PBS treatment for 5 days. (i) Competitive repopulation of bone marrow cells obtained from donors treated with l-NAME or PBS, assessed 16 weeks following transplantation; each dot represents an individual recipient mouse; P values, one-way ANOVA with Tukey’s post-test. (j) Survival after 5-FU treatment, with or without SNAP treatment (n = 9, *** P value = 0.0003), in wild-type vs F2r−/− mice (n = 5, ** P value= 0.0010) or co-treated with EPCR neutralizing or non-inhibitory antibody (n = 9, *** P value < 0.0001).

References

    1. Papayannopoulou T, Scadden DT. Stem-cell ecology and stem cells in motion. Blood. 2008;111:3923–3930. - PMC - PubMed
    1. Spiegel A, Kalinkovich A, Shivtiel S, Kollet O, Lapidot T. Stem cell regulation via dynamic interactions of the nervous and immune systems with the microenvironment. Cell Stem Cell. 2008;3:484–492. - PubMed
    1. Sugiyama T, Kohara H, Noda M, Nagasawa T. Maintenance of the hematopoietic stem cell pool by CXCL12-CXCR4 chemokine signaling in bone marrow stromal cell niches. Immunity. 2006;25:977–988. - PubMed
    1. Mendez-Ferrer S, et al. Mesenchymal and haematopoietic stem cells form a unique bone marrow niche. Nature. 2010;466:829–834. - PMC - PubMed
    1. Schajnovitz A, et al. CXCL12 secretion by bone marrow stromal cells is dependent on cell contact and mediated by connexin-43 and connexin-45 gap junctions. Nat Immunol. 2011;12:391–398. - PubMed

Publication types

MeSH terms