. 2015 Nov;21(11):1350-6.
doi: 10.1038/nm.3967. Epub 2015 Oct 12.

The consensus molecular subtypes of colorectal cancer

Affiliations

The consensus molecular subtypes of colorectal cancer

Justin Guinney et al. Nat Med. 2015 Nov.

Abstract

Colorectal cancer (CRC) is a frequently lethal disease with heterogeneous outcomes and drug responses. To resolve inconsistencies among the reported gene expression-based CRC classifications and facilitate clinical translation, we formed an international consortium dedicated to large-scale data sharing and analytics across expert groups. We show marked interconnectivity between six independent classification systems coalescing into four consensus molecular subtypes (CMSs) with distinguishing features: CMS1 (microsatellite instability immune, 14%), hypermutated, microsatellite unstable and strong immune activation; CMS2 (canonical, 37%), epithelial, marked WNT and MYC signaling activation; CMS3 (metabolic, 13%), epithelial and evident metabolic dysregulation; and CMS4 (mesenchymal, 23%), prominent transforming growth factor-β activation, stromal invasion and angiogenesis. Samples with mixed features (13%) possibly represent a transition phenotype or intratumoral heterogeneity. We consider the CMS groups the most robust classification system currently available for CRC-with clear biological interpretability-and the basis for future clinical stratification and subtype-based targeted interventions.


Figures
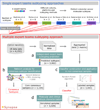
Figure 1
Figure 1. Analytical workflow of the Colorectal Cancer Subtyping Consortium
(a) Subtype classification on 18 shared data sets across six groups. (b) Concordance analysis of the six subtyping platforms, and application of a network analytical method to identify consensus subtype cluster. (c) Development of a consensus subtype classifier from an aggregated gene expression data set and the consensus subtype labels. (d) Biological and clinical characterization of the consensus subtypes.
Figure 2
Figure 2. Identification of the consensus subtypes of colorectal cancer and application of classification framework in non-consensus samples
(a) Network of CRC subtypes across six classification systems: each node corresponds to a single subtype (colored according to group) and edge width corresponds to Jaccard similarity coefficient. The four primary clusters – identified from the Markov cluster algorithm – are highlighted and correspond to the four CMS groups. (b) Per sample distribution of each of the six CRC subtyping systems (A–F), grouped by the four consensus subtyping clusters (n = 3,104), and the unlabeled non-consensus set of samples (n = 858). Colors within each row represent a different subtype. (c) Patient network: each node represents a single patient sample (n = 3,962). Network edges correspond to highly concordant (5/6 of 6) subtyping calls between samples. Nodes are colored according to their CMS, with non-consensus samples gray. (d) Final distribution of the CMS1–4 groups (solid colors), ‘mixed’ samples (gradient colors) or indeterminate samples (gray color) as per classification framework.
Figure 3
Figure 3. Molecular associations of consensus molecular subtype groups
(a) Distribution of non–synonymous somatic mutation events; and (b) somatic copy-number alterations (SCNAs), defined as non-zero GISTIC scores in TCGA data set, across consensus subtype samples (median, lower [Q1] and upper [Q3] quartiles, horizontal lines define minimum and maximum, dots define outliers). (c) Key genomic and epigenomic markers, with darker brown representing positivity for SCNA high (≥Q1 for non–zero GISTIC score events), hypermutation (≥180 events in exome sequencing), microsatellite instability (MSI) high or CpG Island Methylator Phenotype (CIMP) cluster high. (d) Mutation profile, with darker gray representing positivity for KRAS, BRAF, APC and TP53 mutations. (e) Heatmap of copy number changes of the 22 autosomes, with shades of red for gains and blue for losses. CMS1 samples have fewer SCNAs and an intermediate pattern is seen in CMS3. (f) Heatmap representation of DNA methylation beta-values of most variable probes with yellow denoting high DNA methylation and blue low methylation. CMS1 samples show a distinguished hypermethylation profile and an intermediate pattern is seen in CMS3. (g) Heatmap of top differentially expressed proteins in TCGA colored with a gradient from blue (low expression) to yellow (high expression). (h) Heatmap of top differentially expressed microRNAs in TCGA with shades of blue for downregulation and orange for upregulation. (i) Gene set mRNA enrichment analysis: signatures of special interest in CRC, ESTIMATE algorithm to infer immune and stromal cell admixture in tumor samples, canonical pathways, immune signatures and metabolic pathways. (j) Gene set enrichment analysis of proteomic TCGA data. Detailed statistics in Supplementary Tables 5, 8, 9 and 11.
Figure 4
Figure 4. Clinicopathological and prognostic associations of consensus molecular subtype groups
(a) Distribution of gender; (b) Tumor site location; (c) Stage at diagnosis; and (d) Histopathological grade across consensus subtype samples. Prognostic value of CMS groups with Kaplan-Meier survival analysis in the aggregated cohort for (e) overall survival, (f) relapse-free survival and (g) survival after relapse with hazard ratios (HR) and 95% Confidence Interval (CI) for significant pairwise comparisons in univariate analyses (log-rank test). Numbers below the x axes represent patients at risk at selected time points. Detailed statistics in Supplementary Tables 5 and 13.
Figure 5
Figure 5. Proposed taxonomy of colorectal cancer reflecting significant biological differences in the gene expression-based molecular subtypes
CIMP, CpG Island Methylator Phenotype; MSI, microsatellite instability; SCNA, somatic copy number alterations; TGF, transforming growth factor.

Comment in

References

    1. Hoadley KA, et al. Multiplatform Analysis of 12 Cancer Types Reveals Molecular Classification within and across Tissues of Origin. Cell. 2014;158:929–944. - PMC - PubMed
    1. Muzny DM, et al. Comprehensive molecular characterization of human colon and rectal cancer. Nature. 2012;487:330–337. - PMC - PubMed
    1. Roepman P, et al. Colorectal cancer intrinsic subtypes predict chemotherapy benefit, deficient mismatch repair and epithelial-to-mesenchymal transition. Int. J. Cancer. 2014;134:552–562. - PMC - PubMed
    1. Budinska E, et al. Gene expression patterns unveil a new level of molecular heterogeneity in colorectal cancer. J. Pathol. 2013;231:63–76. - PMC - PubMed
    1. Schlicker A, et al. Subtypes of primary colorectal tumors correlate with response to targeted treatment in colorectal cell lines. BMC Med. Genomics. 2012;5:66. - PMC - PubMed

Publication types

MeSH terms