. 2015 Nov 19;527(7578):336-41.
doi: 10.1038/nature15249. Epub 2015 Oct 12.

Gating machinery of InsP3R channels revealed by electron cryomicroscopy

Affiliations

Gating machinery of InsP3R channels revealed by electron cryomicroscopy

Guizhen Fan et al. Nature. .

Abstract

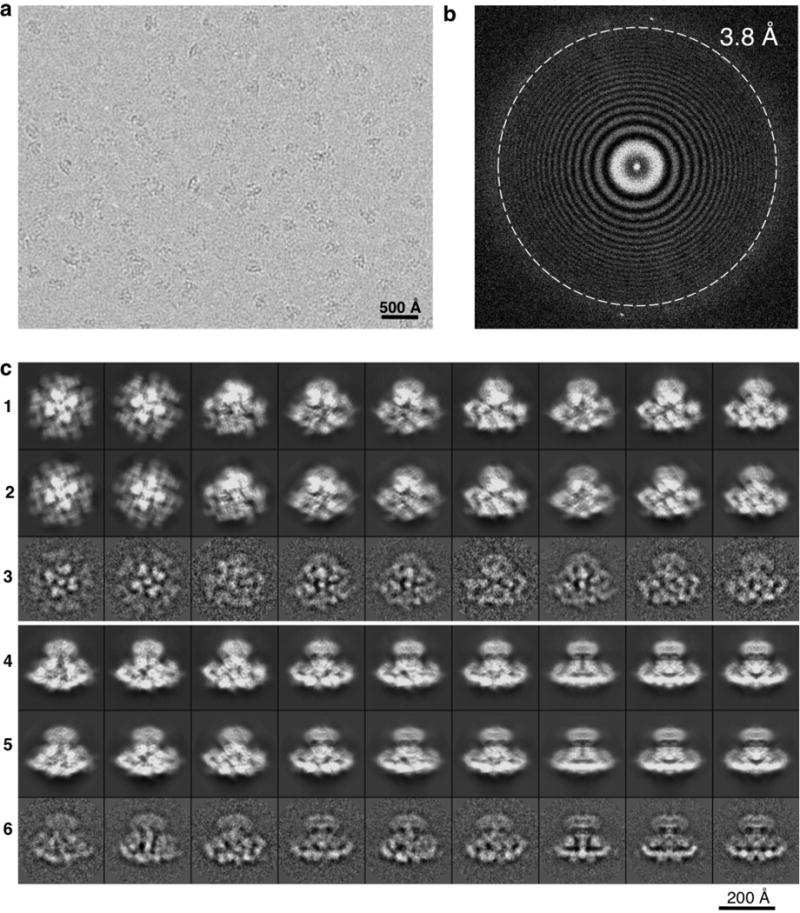
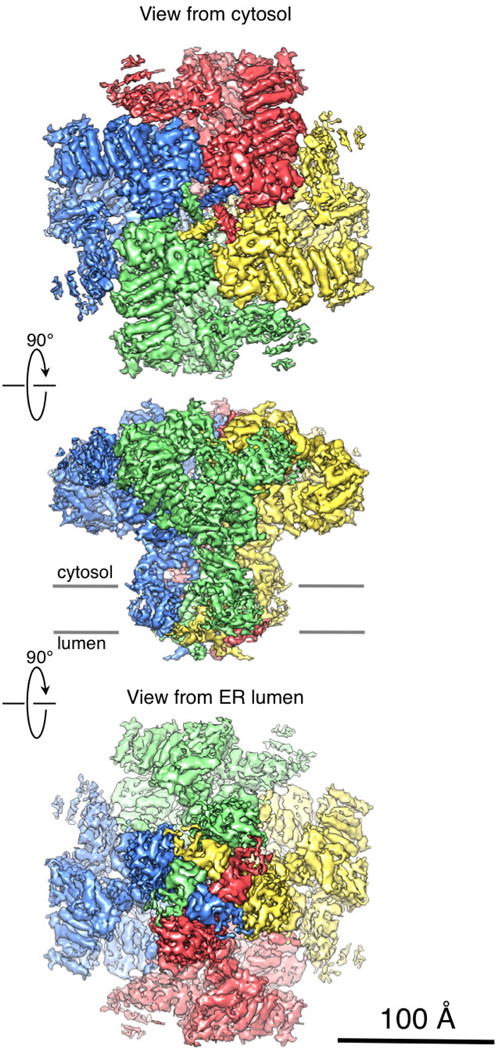
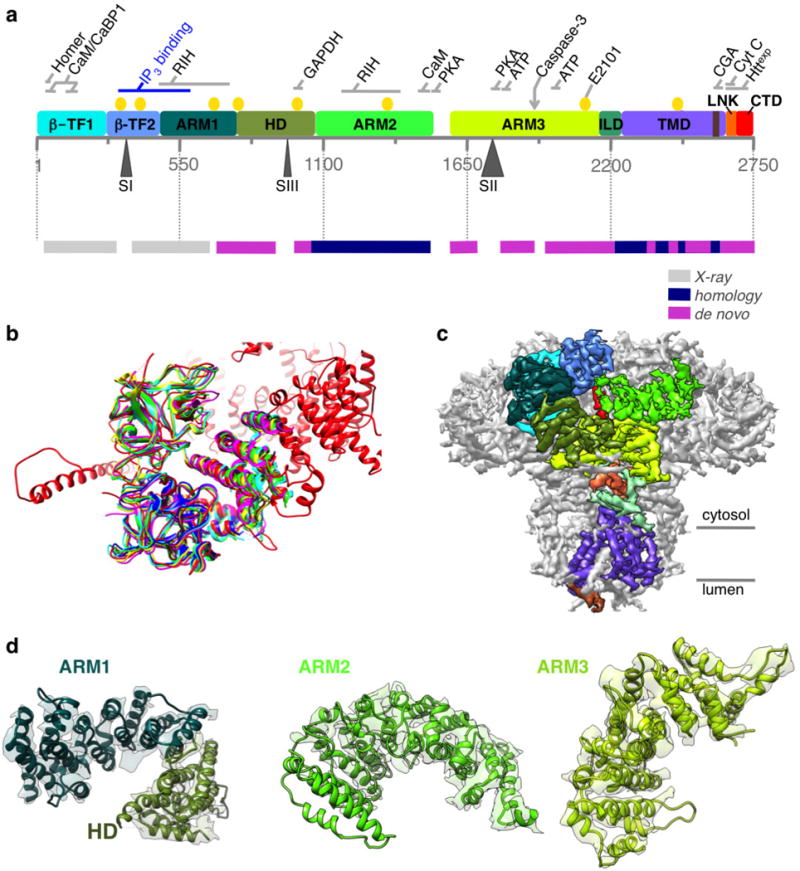
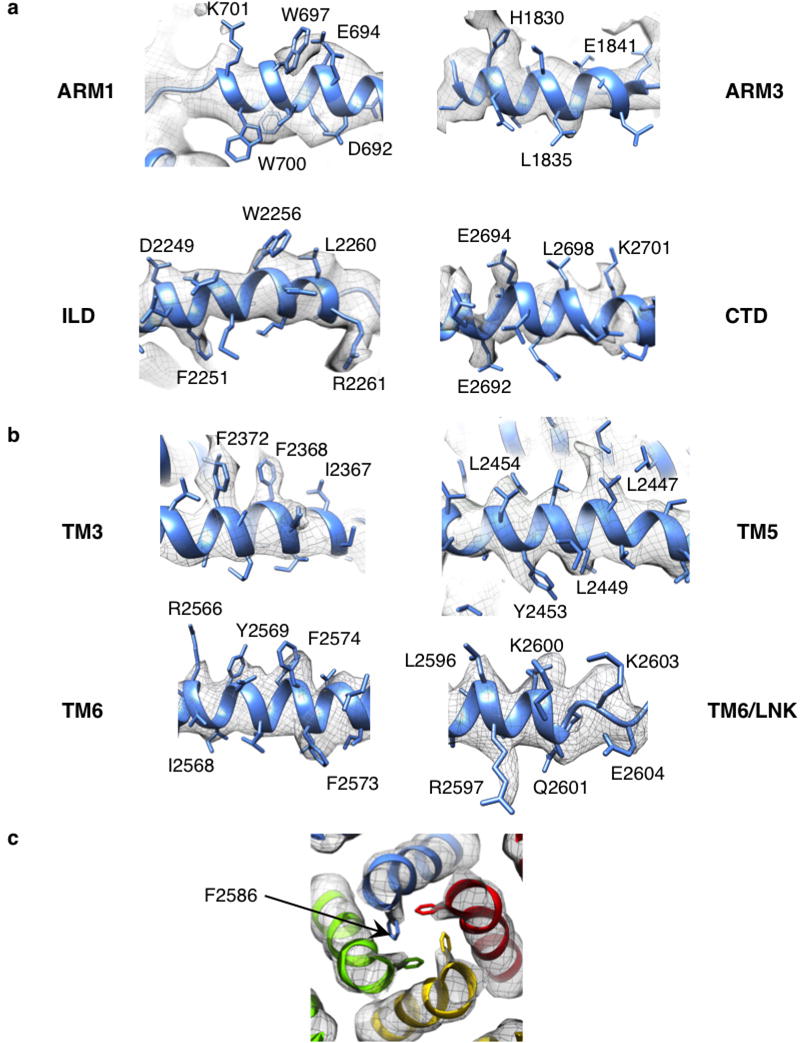
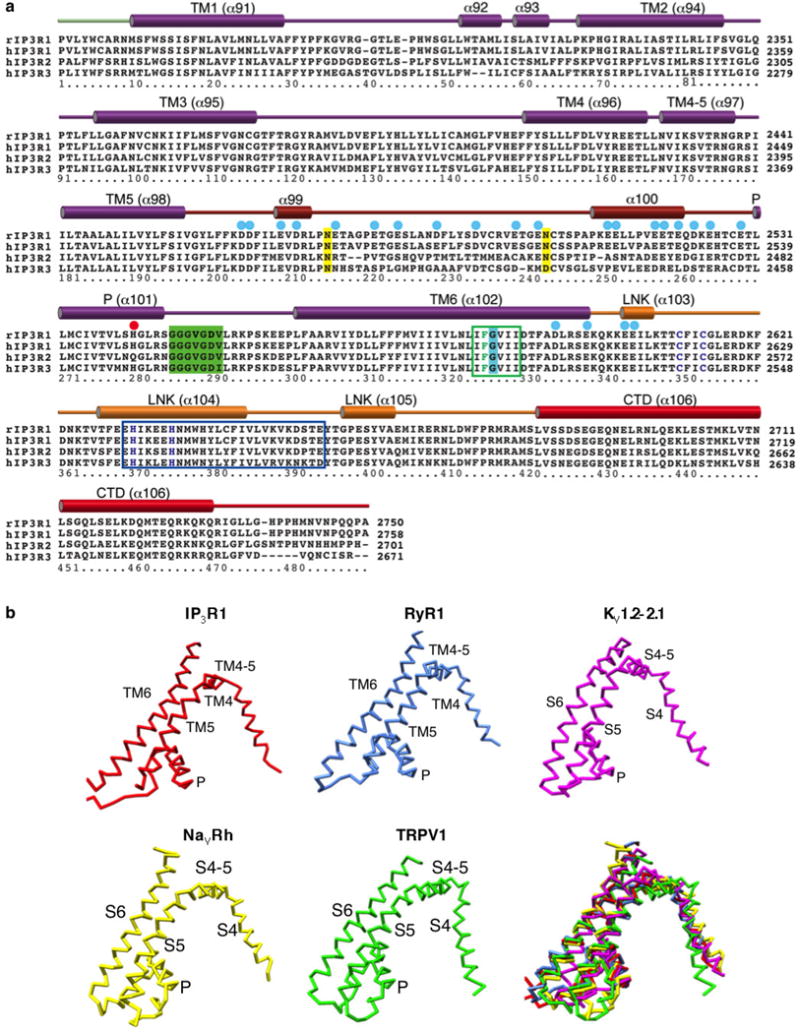
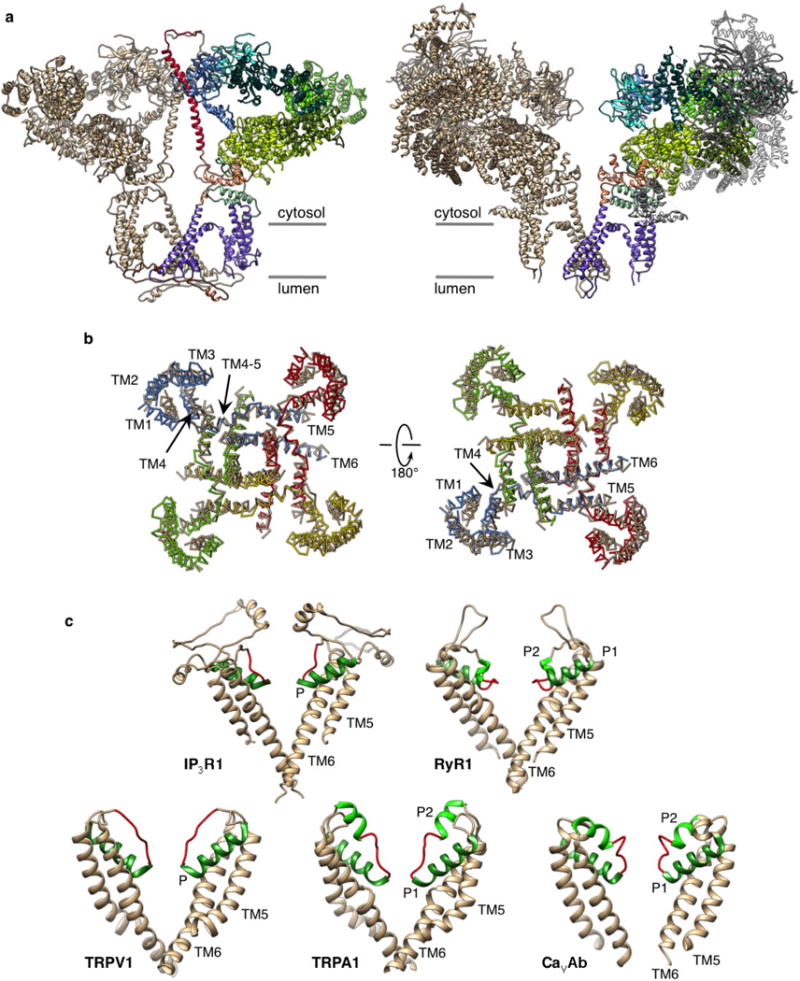
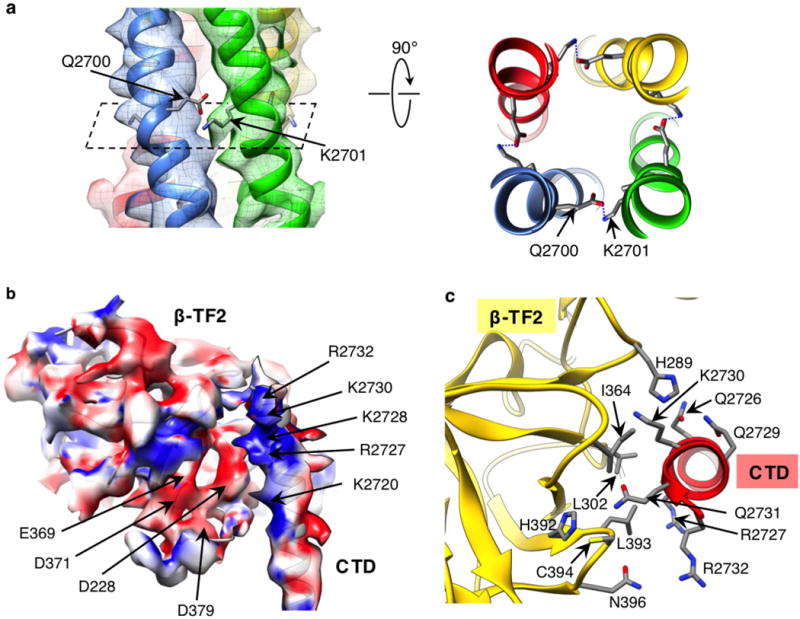
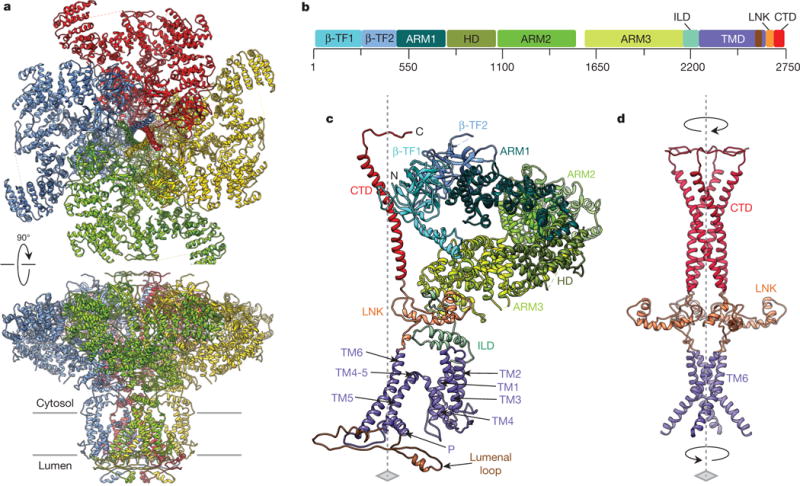
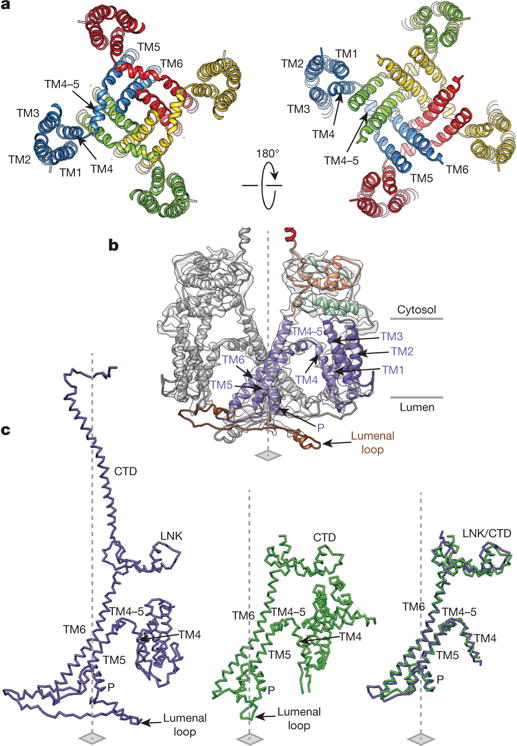
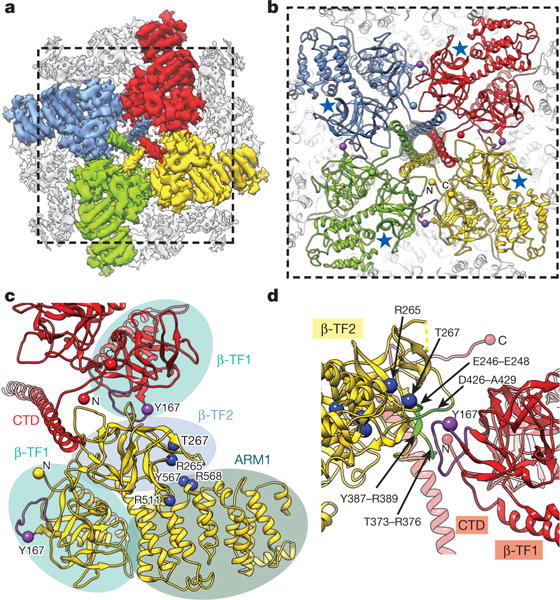
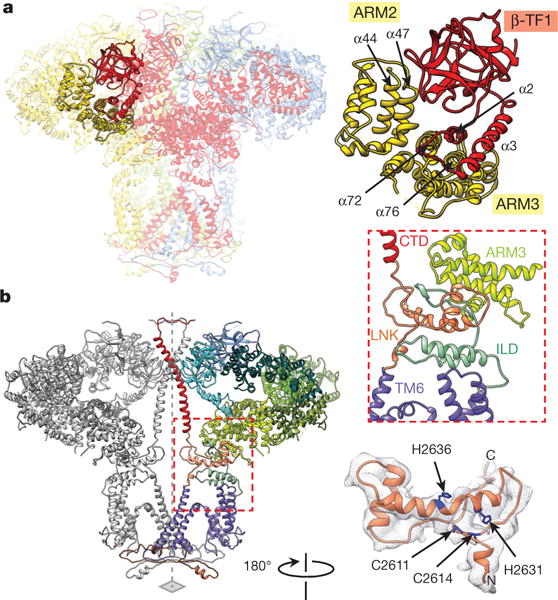
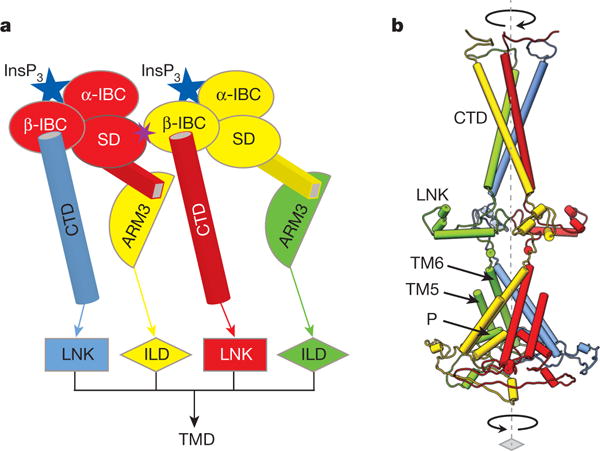
Inositol-1,4,5-trisphosphate receptors (InsP3Rs) are ubiquitous ion channels responsible for cytosolic Ca(2+) signalling and essential for a broad array of cellular processes ranging from contraction to secretion, and from proliferation to cell death. Despite decades of research on InsP3Rs, a mechanistic understanding of their structure-function relationship is lacking. Here we present the first, to our knowledge, near-atomic (4.7 Å) resolution electron cryomicroscopy structure of the tetrameric mammalian type 1 InsP3R channel in its apo-state. At this resolution, we are able to trace unambiguously ∼85% of the protein backbone, allowing us to identify the structural elements involved in gating and modulation of this 1.3-megadalton channel. Although the central Ca(2+)-conduction pathway is similar to other ion channels, including the closely related ryanodine receptor, the cytosolic carboxy termini are uniquely arranged in a left-handed α-helical bundle, directly interacting with the amino-terminal domains of adjacent subunits. This configuration suggests a molecular mechanism for allosteric regulation of channel gating by intracellular signals.


Conflict of interest statement

The authors declare no competing financial interests. Readers are welcome to comment on the online version of the paper.

Figures

Extended Data Figure 1
Extended Data Figure 1. Cryo-EM of the purified InsP3R1
a, Representative electron image of ice-embedded InsP3R1 taken at a defocus of 2.1 μm and recorded using the K2 Summit camera. Shown image is motion-corrected. b, Fourier power spectrum of the micrograph shown in a with Thon rings extending to 3.8 Å. c, 2D projections of the InsP3R1 map from the last iteration of refinement by RELION1.3 (rows 1 and 4) and EMAN2.1 (rows 2 and 5) are shown with corresponding 2D class averages (rows 3 and 6).
Extended Data Figure 2
Extended Data Figure 2. Resolution estimation of cryo-EM 3D reconstruction
a, The gold-standard FSC curve for the final cryo-EM 3D reconstruction generated with RELION1.3 (black) and EMAN2.1 (green). The overall resolution is 4.7 Å using the FSC cut-off = 0.143. b, Shown is the FSC curve between the cryo-EM density map generated with RELION1.3 and the molecular model (blue, FSC cut-off is 0.5) and the FSC curve between the 3D reconstructions generated with EMAN2.1 and RELION1.3 (red, FSC cut-off is 0.25). c, The cryo-EM density map of InsP3R1 generated with RELION1.3 is colour-coded based on ResMap (Methods). The map is depicted as viewed along the membrane plane (left) or as a slab of the density (dashed box in left panel) coincident with the four-fold channel axis (right). The cryo-EM density map exhibits local resolution variation ranging from 3.6 Å to 6.5 Å with the most highly resolved densities in the TMD, while parts of the peripheral densities in the cytoplasmic region are of lower resolution. The low resolution peripheral density in the transmembrane region is attributed to detergent bound to the protein. d, Euler angle distribution of all particles used for the final 3D reconstruction. Each view is represented by a sphere, for which the size is proportional to the number of particles for this specific view.
Extended Data Figure 3
Extended Data Figure 3. 3D cryo-EM density map of the tetrameric InsP3R1 visualized in three orthogonal orientations
InsP3R1 viewed from the cytosol (top), along the membrane plane (middle) and from the lumen (bottom). Four individual subunits are colour-coded. The map is rendered at a threshold level corresponding to a molecular mass of ~1.3 MDa.
Extended Data Figure 4
Extended Data Figure 4. Building an atomic model of InsP3R1
a, Linear representation of a primary structure of InsP3R1 protein (GI accession 17380349). Ten domains identified in the cryo-EM density map are colour-coded. Three sites of alternative splicing (residues 318–332/SI, 918–926/SIII and 1692–1731/SII) are indicated below the sequence bar. Putative binding sites for several channel-specific ligands are indicated above the domains (ATP, ATP-binding CaM/CaBP, calmodulin/Ca2+ binding protein; CGA, chromogranin A; cyt c, cytochrome c; Httexp, huntingtin; PKA, protein kinase A; RIH, RyR/InsP3R homology; yellow circles denote Ca2+-binding). The panel below shows a linear diagram of the protein sequence colour-coded based on the approach used for modelling different regions in the primary structure. The spaces between the bars correspond to unmodelled sequence (see also Extended Data Fig. 5). b, The structure of the N-terminal domain (NTD) based on cryo-EM density map (red) is shown overlapped with the X-ray crystal structures of NTD (r.m.s.d. values 5 1.3–1.4 Å): 1XZZ (blue); 3T8Sa (cyan); 3T8Sb (green); 3UJ4 (yellow); and 3UJ0 (magenta). c, Cryo-EM density map is viewed along the membrane plane. Densities corresponding to the individual domains of one subunit of InsP3R1 are colour-coded as in a. d, Models for solenoid-like α-helical domains are shown superimposed on their corresponding cryo-EM densities. ARM1–ARM3, armadillo repeat domains1–3; HD, α-helical domain. The densities of ARM2 domain are less resolved than those of ARM1 and ARM3 but are sufficient to trace the backbone.
Extended Data Figure 5
Extended Data Figure 5. Sequence alignment of selected InsP3R channels
rInsP3R1, Rattus norvegicus (GI accession 17380349); hInsP3R1, Homo sapiens (GI accession 519668682); hInsP3R2, Homo sapiens (GI accession 259016258); hInsP3R3, Homo sapiens (GI accession 209572633); the primary sequence numbering includes the first methionine. The numbering of residues is given below the sequences, secondary structure elements are indicated above the sequences and colour-coded in correspondence to the domains shown in Fig. 1b; dashed lines indicate regions that were not sufficiently resolved to be modelled. Given the enormous size of InsP3R proteins, the full-length sequence alignment was divided into two panels: sequence alignment for the transmembrane domains is shown in Extended Data Fig. 7a (note, overlap at the loop between the helices α90 and α91).
Extended Data Figure 6
Extended Data Figure 6. Representative cryo-EM densities
ac, The cryo-EM densities for some regions are shown overlaid with the corresponding model: cytosolic helices (a); transmembrane helices (b); the constriction point at Phe2586 within the ion conduction pathway (c), view from the cytosol along the four-fold axis, colour-coded by subunit.
Extended Data Figure 7
Extended Data Figure 7. Structural conservation of the pore among tetrameric cation channels
a, Alignment of the channel-forming domains; residues discussed in the text are labelled as following: blue circles, negatively charged residues; red circles, positively charged His2541; yellow highlight, N-glycosylation sites (Asn2476 and Asn2504); green highlight, selectivity filter; blue highlight, conserved Gly2587; green box, hydrophobic constriction region and Phe2586 shown in green; dark blue, Zn2+-finger-like residues Cys2611/Cys2614 and His2631/His2636; blue box, tetramerization region. b, Structural comparison of pore-forming elements of InsP3R1, RyR1, Kv1.2–2.1, NavRh, TRPV1 (PDB accessions: 3J8H, 2R9R, 4DXW and 3J5P, respectively). Note substantial overlap between structures.
Extended Data Figure 8
Extended Data Figure 8. Comparison of InsP3R1 and RyR1 structures
a, Two opposing subunits of InsP3R1 and RyR1 (PDB accession 3J8H) are viewed along the membrane plane. One InsP3R1 subunit is colour-coded by domain (left). Structurally consistent domains in one RyR1 subunit are colour-coded using InsP3R1 domain architecture. Domains of RyR1 not in common are shown in grey. b, TMDs of RyR1 (tan) and InsP3R1 (coloured by subunit) are superimposed using Chimera’s Matchmaker and viewed from the cytosol (left) and lumen (right). The r.m.s.d. between 80 atom pairs is 2.0 Å. For clarity, P-helices are not shown. c, Structural comparison of the selectivity filter (red) in InsP3R1 with that in some tetrameric cation channels: RyR1, TRPV1, TRPA1, CavAb (PDB accessions: 3J8H, 3J5Q, 3J9P and 4MS2, respectively). Two opposing subunits are shown; TM5 and TM6 helices are coloured tan, P-helices are in green.
Extended Data Figure 9
Extended Data Figure 9. The putative cytosolic Ca2+ sensor in InsP3R1
a, Cut-open side view of the cryo-EM density map of InsP3R1 is shown with the structures of the Ca2+ sensor region for InsP3R1 (residues 1952–2270) and RyR1 (residues 3877–4251; PDB accession 3J8H); the EF-hand of RyR1 includes residues 4071–4130. b, Close-up view of the overlapped Ca2+ sensor structures for InsP3R1 (colour-coded by domain as in Fig. 1) and RyR1 (tan). The conserved Glu2101/InsP3R1 and Glu4032/RyR1 are shown in red. c, Sequence alignment of the predicted Ca2+ sensor regions comprising the conserved Glu2101/InsP3R1 and Glu4032/RyR1 (red) (rInsP3R1/GI code:17380349; hInsP3R1/GI code: 519668682; hInsP3R2/GI code: 259016258; hInsP3R3/GI code: 209572633; RyR1/GI code: 134134; RyR2/GI code: 308153559; RyR3/GI code: 75074791); green highlight denotes completely conserved residues; yellow highlight denotes identical residues.
Extended Data Figure 10
Extended Data Figure 10. Structural coupling in the CTD
a, A bundle of the CTD helices is viewed perpendicular to the channel axis at the position of a predicted inter-subunit saltbridge between residues Gln2700 and Lys2701. The right panel shows the predicted salt bridge normal to the channel axis. Helices are colour-coded per subunit. b, Structures of the CTD and β-TF2 domains are superimposed on their corresponding cryo-EM densities and the surfaces are colour-coded according to electrostatic charges calculated for the model: blue denotes positive charges; red denotes negative charges. Shown is a side view with the cytoplasmic side facing up. c, Close-up view of the interface between the CTD and β-TF2 domains of two neighbouring subunits; viewed from cytosol perpendicular to the membrane plane.
Figure 1
Figure 1. Overview of InsP3R1 structure
a, Structure of InsP3R1 visualized in two orthogonal orientations: view from cytosol and side view along the membrane plane. Subunits are colour-coded. b, Linear representation of InsP3R1 structural domains (GI accession 17380349): domains are annotated in the text, HD is the α-helical domain. c, An individual subunit colour-coded by domain. d, Central core structure of tetrameric InsP3R1. Four-fold axis is indicated by the dashed line; arrows indicate the bundle handedness.
Figure 2
Figure 2. Structure of the transmembrane domains
a, Arrangement of transmembrane helices in tetrameric InsP3R1; subunits are colour-coded and viewed from cytosol (left) and lumen (right). b, The structures of two opposing TMDs are superimposed on cryo-EM densities; view is along the membrane plane. One subunit is colour-coded by domain. c, Structural comparison of TMDs from InsP3R1 (left) and RyR1 (PDB accession 3J8H, middle); structurally conserved domains are shown overlapped (right); a root mean squared deviation (r.m.s.d.) value between the TMDs is 1.135 Å for 77 atom pairs.
Figure 3
Figure 3. Detailed structure of the Ca2+ conduction pathway
a, A bundle of TM6 helices shape the ion permeation pathway. A series of hydrophobic residues within a constriction region of the channel pore are labelled. The wire cage is the void-density along the ion conduction pathway; colour-coded by hydrophobicity (right). b, The lumenal vestibule lined by P-helices and selectivity filter (SF) loops viewed along the four-fold axis from the lumen; insert shows the close-up view.
Figure 4
Figure 4. Structural coupling between the CTD and InsP3-binding domains
a, Cryo-EM density map of InsP3R1 viewed from the cytosol with LBDs and CTDs colour-coded by subunit. b, InsP3R1 model corresponding to the region marked in a; blue stars denote InsP3-binding sites; purple spheres denote Tyr167. c, Contacts between LBD and CTD of adjacent subunits. Domains are denoted as ellipses colour-coded as in Fig. 1b. Residues involved in InsP3 binding are rendered as blue spheres. d, The interface between β-TF2 and β-TF1 of neighbouring subunits viewed orthogonally with respect to c. Residues on β-TF2 domain within 5 Å from hotspot loop of β-TF1 are coloured green.
Figure 5
Figure 5. Cytosolic intra- and inter-subunit interactions
a, Inter-subunit contacts of β-TF1 with ARM2 and ARM3 domains; subunits are colour-coded. b, Two opposing subunits are viewed along the membrane plane; domains of one subunit are colour-coded. Transmembrane–cytosolic domain interface is indicated with a red dashed line (left), and its close-up view is shown in insert (middle right). The structure of LNK domain is superimposed on cryo-EM densities (bottom right); residues of the C2H2 Zn2+-finger-like motif are coloured blue.
Figure 6
Figure 6. Model for coupling mechanism of InsP3R1 activation by InsP3
a, Schematic representation of inter-subunit contacts involved in propagation of InsP3-binding signal to the pore (colour-coded by subunit): from β-IBC to CTD/LNK domains and from the suppressor domain (SD) to ARM3/ILD domains of neighbouring subunits. b, The InsP3-induced changes in the LBDs can cause the helices in the cytosolic bundle to rearrange and trigger the motions of the LNKs, that may force the transmembrane bundle to adopt a conformation permeable for Ca2+; colour-coded by subunit.

References

    1. Serysheva II, Ludtke SJ. 3D structure of IP3 receptor. Curr Topics Memb. 2010;66C:171–189. - PubMed
    1. Ludtke SJ, et al. Flexible architecture of IP3R1 by Cryo-EM. Structure. 2011;19:1192–1199. - PMC - PubMed
    1. Murray SC, et al. Validation of cryo-EM structure of IP3R1 channel. Structure. 2013;21:900–909. - PMC - PubMed
    1. Bosanac I, et al. Structure of the inositol 1,4,5-trisphosphate receptor binding core in complex with its ligand. Nature. 2002;420:696–700. - PubMed
    1. Bosanac I, et al. Crystal structure of the ligand binding suppressor domain of type 1 inositol 1,4,5-trisphosphate receptor. Mol Cell. 2005;17:193–203. - PubMed

Publication types

MeSH terms

Associated data