. 2016 Mar-Apr;37(2):164-76.
doi: 10.1097/AUD.0000000000000234.

Text as a Supplement to Speech in Young and Older Adults

Affiliations

Text as a Supplement to Speech in Young and Older Adults

Vidya Krull et al. Ear Hear. 2016 Mar-Apr.

Abstract

Objective: The purpose of this experiment was to quantify the contribution of visual text to auditory speech recognition in background noise. Specifically, the authors tested the hypothesis that partially accurate visual text from an automatic speech recognizer could be used successfully to supplement speech understanding in difficult listening conditions in older adults, with normal or impaired hearing. The working hypotheses were based on what is known regarding audiovisual speech perception in the elderly from speechreading literature. We hypothesized that (1) combining auditory and visual text information will result in improved recognition accuracy compared with auditory or visual text information alone, (2) benefit from supplementing speech with visual text (auditory and visual enhancement) in young adults will be greater than that in older adults, and (3) individual differences in performance on perceptual measures would be associated with cognitive abilities.

Design: Fifteen young adults with normal hearing, 15 older adults with normal hearing, and 15 older adults with hearing loss participated in this study. All participants completed sentence recognition tasks in auditory-only, text-only, and combined auditory-text conditions. The auditory sentence stimuli were spectrally shaped to restore audibility for the older participants with impaired hearing. All participants also completed various cognitive measures, including measures of working memory, processing speed, verbal comprehension, perceptual and cognitive speed, processing efficiency, inhibition, and the ability to form wholes from parts. Group effects were examined for each of the perceptual and cognitive measures. Audiovisual benefit was calculated relative to performance on auditory- and visual-text only conditions. Finally, the relationship between perceptual measures and other independent measures were examined using principal-component factor analyses, followed by regression analyses.

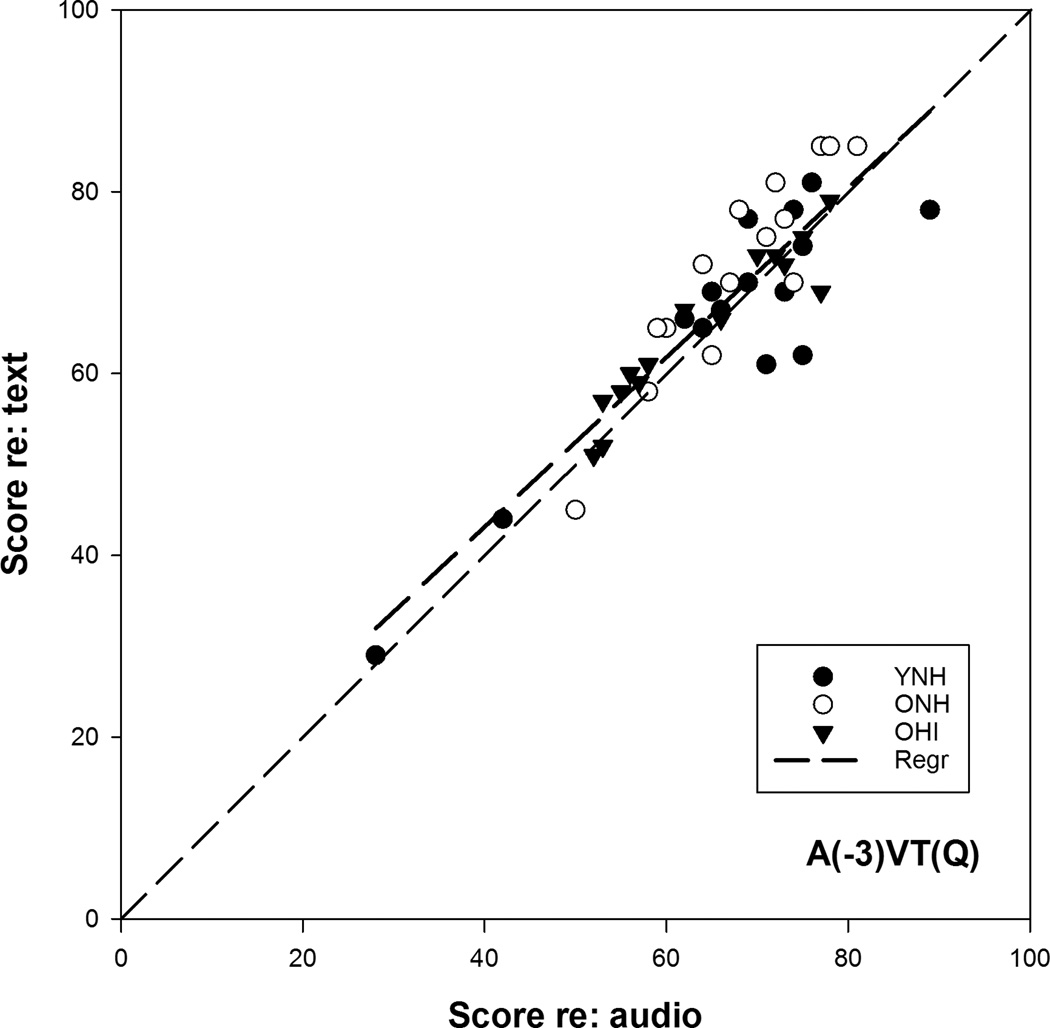
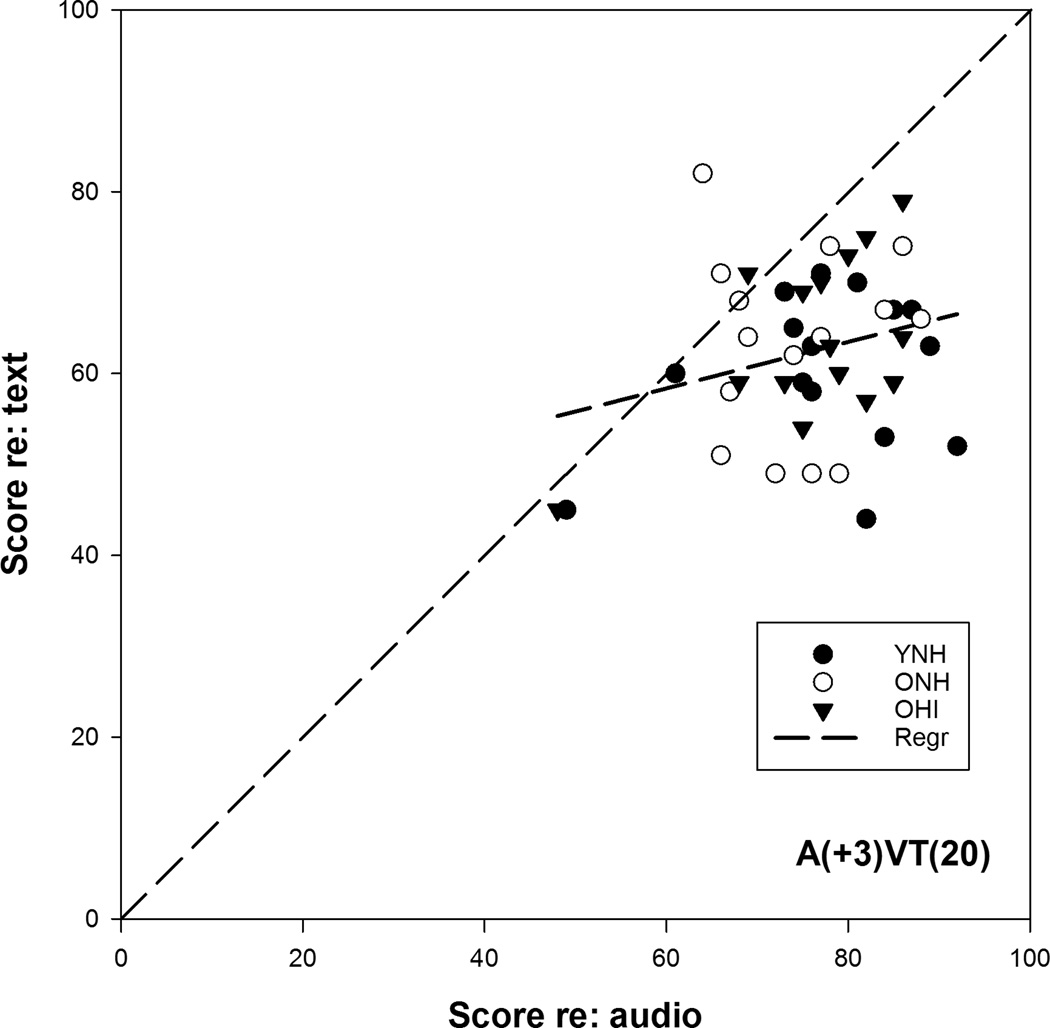
Results: Both young and older adults performed similarly on 9 out of 10 perceptual measures (auditory, visual, and combined measures). Combining degraded speech with partially correct text from an automatic speech recognizer improved the understanding of speech in both young and older adults, relative to both auditory- and text-only performance. In all subjects, cognition emerged as a key predictor for a general speech-text integration ability.

Conclusions: These results suggest that neither age nor hearing loss affected the ability of subjects to benefit from text when used to support speech, after ensuring audibility through spectral shaping. These results also suggest that the benefit obtained by supplementing auditory input with partially accurate text is modulated by cognitive ability, specifically lexical and verbal skills.


Figures

Figure 1
Figure 1
Average hearing thresholds (in dB SPL) for young normal-hearing (YNH; filled circles), older normal-hearing (ONH; filled inverted triangles), and older hearing-impaired (OHI; filled squares) subjects at 1/3 octave band intervals between 125 and 8000 Hz. Unshaped long-term RMS speech spectra for YNH and ONH (filled diamonds) and shaped spectra for OHI (filled triangles) are also shown.
Figure 2
Figure 2
Mean recognition performance in rationalized arcsine transform units for young normal-hearing (YNH), older normal-hearing (ONH) and older hearing impaired (OHI) groups for each of the ten perceptual measures. The perceptual measures consisted of auditory-only measures at three different levels of background noise (−3 dB SNR (A(−3)), +3 dB SNR (A(+3)), and in quiet (A(Q))), text-only measures at three different levels of text accuracy (text processed with input speech at +20 dB SNR (VT(+20)) and in quiet (VT(Q)), and an intact transcript of the auditory input (VT(intact))), and all combinations of auditory and text conditions that were degraded (A(−3)VT(+20), A(−3)VT(Q), A(+3)VT(+20), and A(+3)VT(Q).
Figure 3
Figure 3
A: Mean recognition performance in the WAIS and AQT tests for young normal-hearing (YNH), older normal-hearing (ONH) and older hearing impaired (OHI) groups. The vocabulary, digit-symbol coding, and letter-number sequencing subscales of the Wechsler Adult Intelligence Scale – III (WAIS-R) were tested. The Alzheimer’s Quick Test (AQT) is a timed test for naming colors (C), forms (F), a combination of colors and forms (CF). Overhead, a measure of processing efficiency is calculated from these measurements [CF-(C+F)]. B: Mean recognition performance in the Stroop and TRT tests for young normal-hearing (YNH), older normal-hearing (ONH) and older hearing impaired (OHI) groups. The Stroop test (Golden 1975) consists of three basic scores: 1) The Raw Word Score is the number of items completed on the Word Page; 2) The Raw Color score is the number of items completed on the Color page; and 3) The Raw Color-Word Score is the number of items completed on the Color-Word page. The Interference score is a score derived from these measures and is suggested as a measure of inhibition. The Text Reception Threshold (TRT; Zekveld et al. 2007) test is a visual analogue of the speech reception threshold test (SRT) and measured the ability to make wholes from parts when 50% of the text was masked by a bar pattern.
Figure 3
Figure 3
A: Mean recognition performance in the WAIS and AQT tests for young normal-hearing (YNH), older normal-hearing (ONH) and older hearing impaired (OHI) groups. The vocabulary, digit-symbol coding, and letter-number sequencing subscales of the Wechsler Adult Intelligence Scale – III (WAIS-R) were tested. The Alzheimer’s Quick Test (AQT) is a timed test for naming colors (C), forms (F), a combination of colors and forms (CF). Overhead, a measure of processing efficiency is calculated from these measurements [CF-(C+F)]. B: Mean recognition performance in the Stroop and TRT tests for young normal-hearing (YNH), older normal-hearing (ONH) and older hearing impaired (OHI) groups. The Stroop test (Golden 1975) consists of three basic scores: 1) The Raw Word Score is the number of items completed on the Word Page; 2) The Raw Color score is the number of items completed on the Color page; and 3) The Raw Color-Word Score is the number of items completed on the Color-Word page. The Interference score is a score derived from these measures and is suggested as a measure of inhibition. The Text Reception Threshold (TRT; Zekveld et al. 2007) test is a visual analogue of the speech reception threshold test (SRT) and measured the ability to make wholes from parts when 50% of the text was masked by a bar pattern.
Figure 4
Figure 4
A: Mean auditory enhancement (AE) in each of the combined measures is shown for the young normal-hearing (YNH), older normal-hearing (ONH) and older hearing impaired (OHI) groups. AE is measured as the improvement in performance for the combined measure (AVT) relative to performance in the corresponding visual text-only (VT) condition. B: Mean visual enhancement (AE) in each of the combined measures is shown for the young normal-hearing (YNH), older normal-hearing (ONH) and older hearing impaired (OHI) groups. VE is measured as the improvement in the combined measure (AVT) relative to performance in the corresponding auditory-only (A) condition.
Figure 4
Figure 4
A: Mean auditory enhancement (AE) in each of the combined measures is shown for the young normal-hearing (YNH), older normal-hearing (ONH) and older hearing impaired (OHI) groups. AE is measured as the improvement in performance for the combined measure (AVT) relative to performance in the corresponding visual text-only (VT) condition. B: Mean visual enhancement (AE) in each of the combined measures is shown for the young normal-hearing (YNH), older normal-hearing (ONH) and older hearing impaired (OHI) groups. VE is measured as the improvement in the combined measure (AVT) relative to performance in the corresponding auditory-only (A) condition.
Figure 5
Figure 5
Individual performance for young normal-hearing (YNH; filled circles), older normal-hearing (ONH; open circles) and older hearing impaired (OHI; filled triangles) subjects scored as a function of words correctly repeated from the auditory input (x-axis), and the text input (y-axis). Performance in each of the combined conditions is plotted separately (5A: (A(−3)VT(+20), 5B: A(−3)VT(Q), 5C: A(+3)VT(+20), and 5D: A(+3)VT(Q)). Each plot contains a single (linear first order) dashed regression line plotted for all data.
Figure 5
Figure 5
Individual performance for young normal-hearing (YNH; filled circles), older normal-hearing (ONH; open circles) and older hearing impaired (OHI; filled triangles) subjects scored as a function of words correctly repeated from the auditory input (x-axis), and the text input (y-axis). Performance in each of the combined conditions is plotted separately (5A: (A(−3)VT(+20), 5B: A(−3)VT(Q), 5C: A(+3)VT(+20), and 5D: A(+3)VT(Q)). Each plot contains a single (linear first order) dashed regression line plotted for all data.

References

    1. Agrawal Y, Platz EA, Niparki JK. Prevalence of Hearing Loss and Differences by demographic characteristics among US Adults. Archives of Internal Medicine. 2008;168:1522–1530. - PubMed
    1. Alsius A, Navarra J, Campbell J, Soto-Faraco S. Audiovisual integration of speech falters under high attention demands. Current Biology. 2005;15:839–843. - PubMed
    1. American National Standards Institute. Maximum permissible ambient noise levels for audiometric test rooms. New York: ANSI; 1999. ANSI S3.1–1999.
    1. American National Standards Institute. Specifications for audiometers. New York: ANSI; 2010. ANSI S3.6–2010.
    1. Bain K, Basson SH, Wald M. Speech recognition in university classrooms: liberated learning project. Proceedings of the fifth international ACM conference on Assistive technologies; 2002. pp. 192–196. ACM.

Publication types