. 2015 Nov;33(11):1193-200.
doi: 10.1038/nbt.3392.

Nephron organoids derived from human pluripotent stem cells model kidney development and injury

Nephron organoids derived from human pluripotent stem cells model kidney development and injury

Ryuji Morizane et al. Nat Biotechnol. 2015 Nov.

Abstract

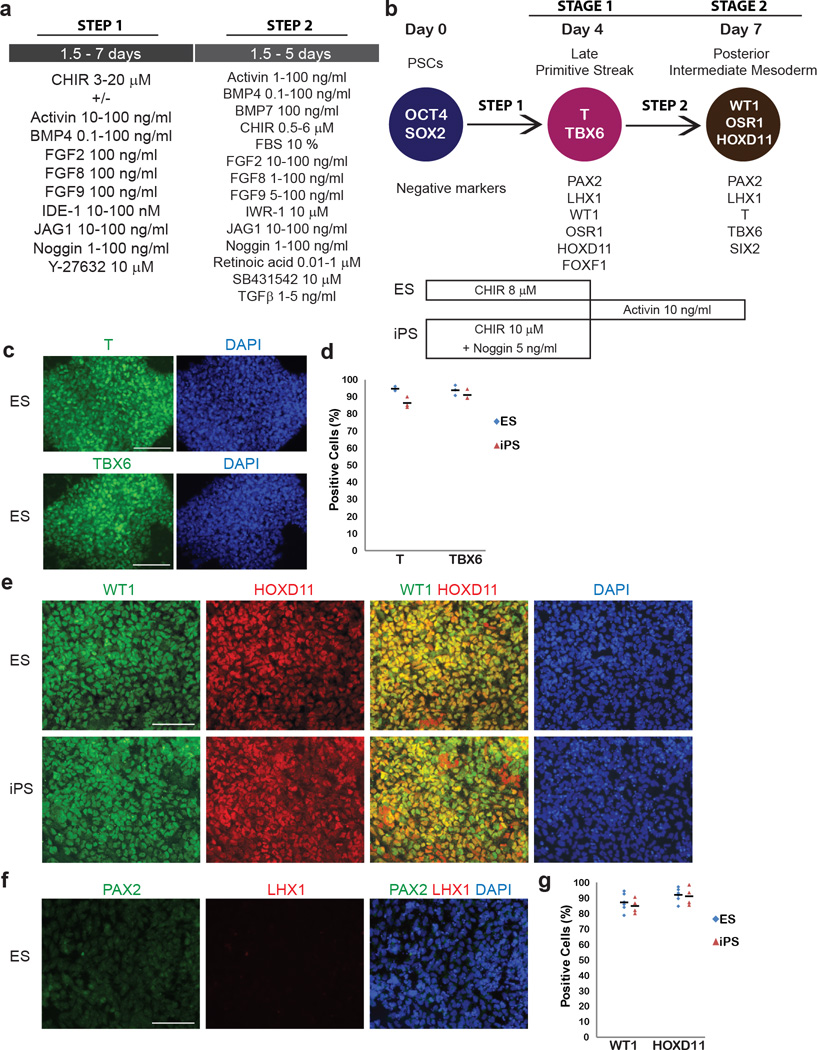
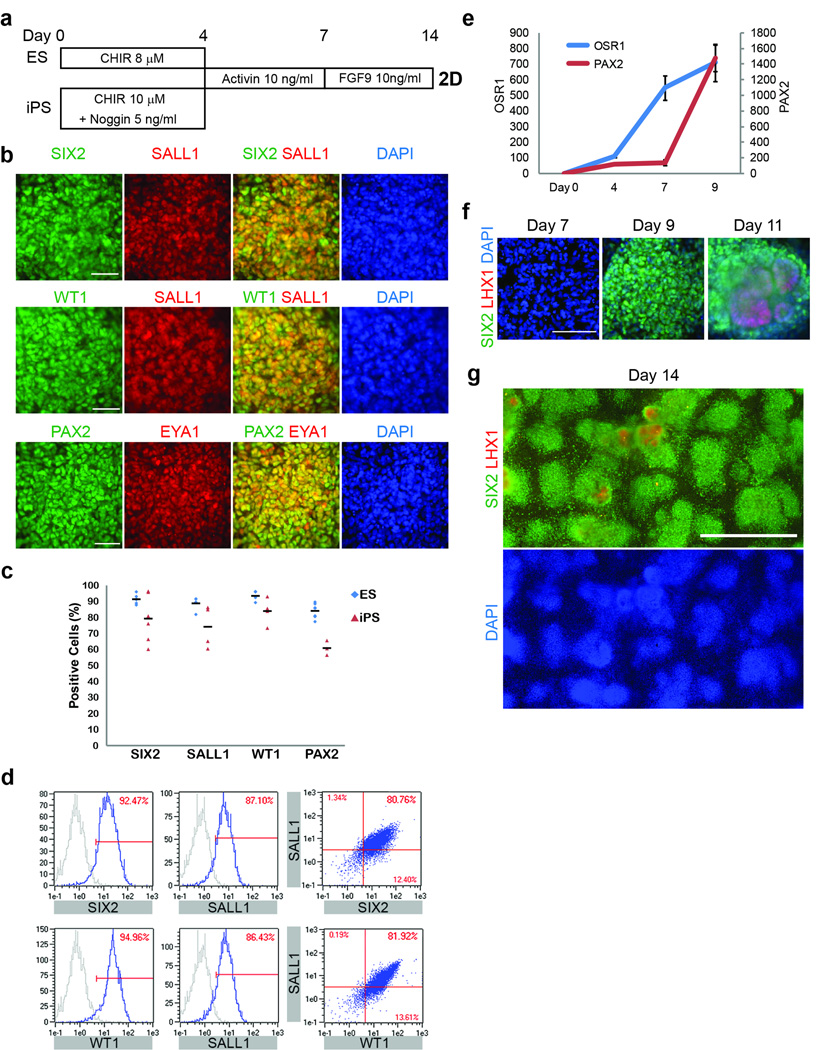
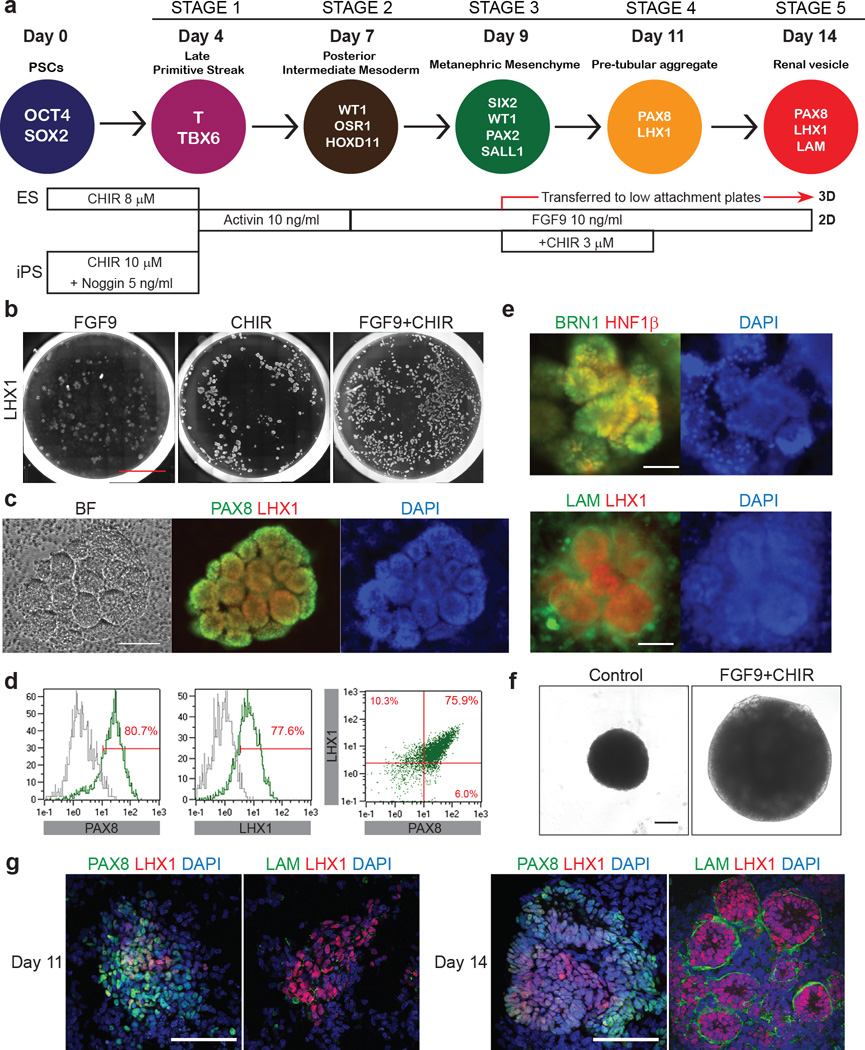
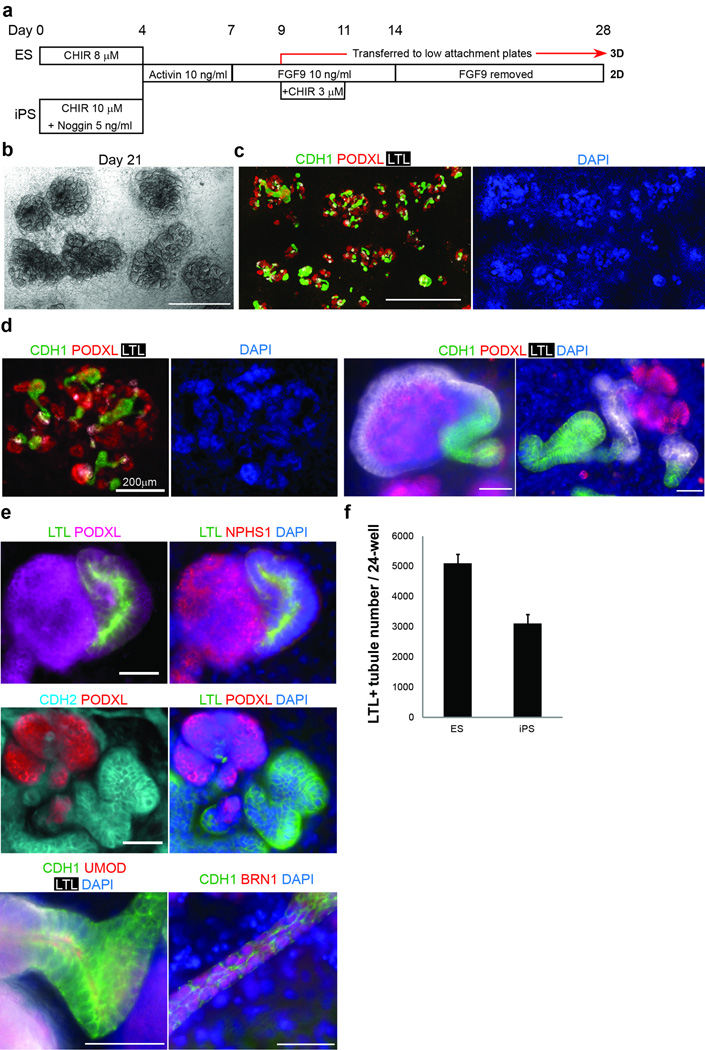
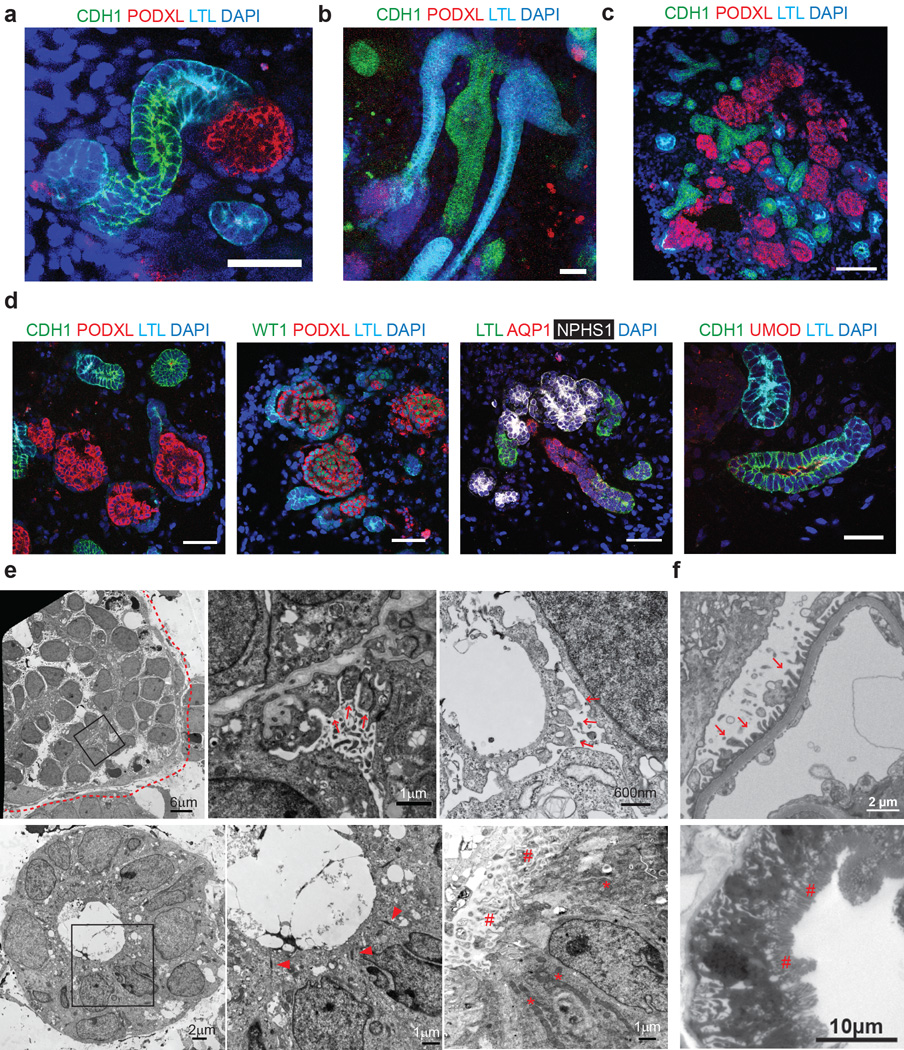
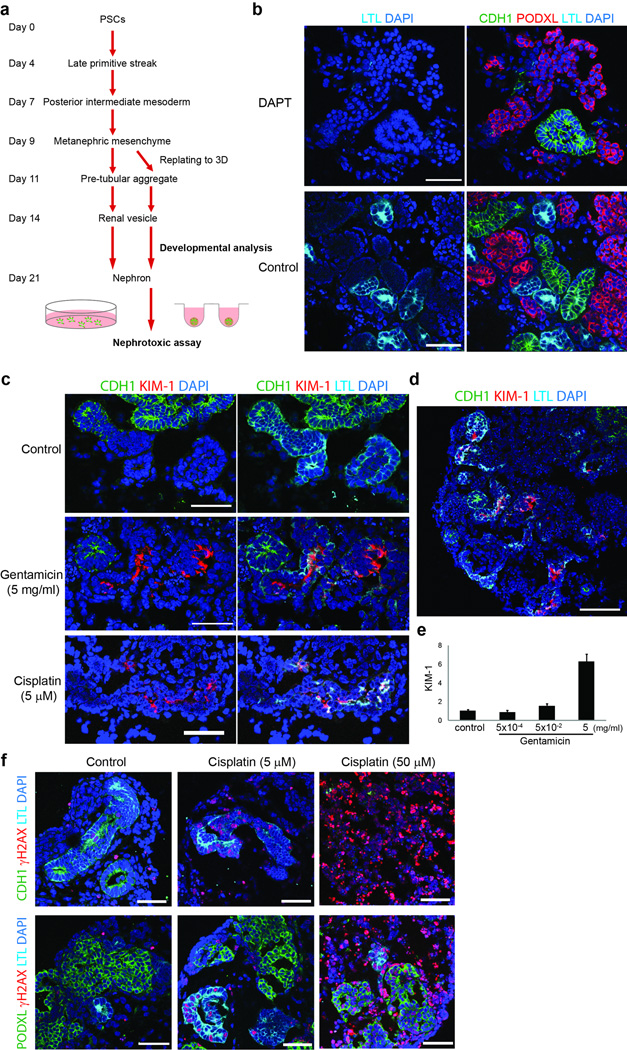
Kidney cells and tissues derived from human pluripotent stem cells (hPSCs) may enable organ regeneration, disease modeling and drug screening. We report an efficient, chemically defined protocol for differentiating hPSCs into multipotent nephron progenitor cells (NPCs) that can form nephron-like structures. By recapitulating metanephric kidney development in vitro, we generate SIX2+ SALL1+ WT1+ PAX2+ NPCs with 90% efficiency within 9 days of differentiation. The NPCs possess the developmental potential of their in vivo counterparts and form PAX8+ LHX1+ renal vesicles that self-organize into nephron structures. In both two- and three-dimensional culture, NPCs form kidney organoids containing epithelial nephron-like structures expressing markers of podocytes, proximal tubules, loops of Henle and distal tubules in an organized, continuous arrangement that resembles the nephron in vivo. We also show that this organoid culture system can be used to study mechanisms of human kidney development and toxicity.


Figures

Figure 1
Figure 1. Differentiation of hPSCs into posterior intermediate mesoderm
(a) Agents that were tested for the induction of late primitive streak and posterior IM. (b) Diagram and the protocol of differentiation of hPSCs sequentially into late primitive streak and posterior intermediate mesoderm (IM) with markers identifying both states by their presence or absence. In the protocol for posterior IM hESCs and hiPSCs were differentiated with CHIR 8 µM and 10 µM respectively. For hiPSCs Noggin 5 ng/ml was also required. (c) Immunocytochemistry for T and TBX6 in hESCs on day 4 of the differentiation with CHIR 8 µM. (d) Percentage of T or TBX6 positive cells in hESCs and hiPSCs on day 4. Black bars indicate mean values. n= 3 for hESCs; n=3 for hiPSCs. (e) Immunocytochemistry for WT1 and HOXD11, posterior IM markers, in hESCs and hiPSCs on day 7. (f) Immunocytochemistry for PAX2 and LHX1, anterior IM markers in hESCs on day 7. (g) Percentage of WT1 or HOXD11 positive cells in hESCs and hiPSCs on day 7. Black bars indicate mean values. n=7 for hESCs; n=4 for hiPSCs. Scale bars: 100 µm.
Figure 2
Figure 2. Differentiation into nephron progenitor cells and spontaneous formation of renal vesicles
(a) The protocol for the induction of nephron progenitor cells. (b) Immunocytochemistry for SIX2, SALL1, WT1, PAX2 and EYA1, markers of nephron progenitor cells, on day 9 in cells differentiated from hPSCs using protocol depicted in (a). Scale bars: 50 µm. (c) Percentage of cells positive for SIX2, SALL1, WT1 or PAX2 in hESCs and hiPSCs on day 9. n=7, 5, 4 or 7 for SIX2, SALL1, WT1 or PAX2 respectively in hESCs. n=6, 4, 4, or 3 for SIX2, SALL1, WT1 or PAX2 respectively in hiPSCs. Black bars indicate mean values. (d) Flow cytometry for SIX2, SALL1 and WT1 in hESCs on day 8. Samples stained with secondary antibodies alone were used as controls (gray). (e) Time course of gene expression of OSR1 and PAX2 in hESCs from day 0 to 9. OSR1 was upregulated on days 7 and 9 while PAX2 was upregulated on day 9. n=2. Data represent mean +/− SEM. (f, g) Time course of SIX2 and LHX1 expression from day 7 to 14 in hESCs treated with FGF9 10 ng/ml. (g) When FGF9 was continued to day 14, SIX2 expression was sustained, but spontaneous induction of LHX1+ cells was consistent with maturation to renal vesicles. The images are representative of the density of renal vesicle formation in the culture dishes. Scale bars: 100 µm (f), 1 mm (g).
Figure 3
Figure 3. Induction of pre-tubular aggregates and renal vesicles from nephron progenitor cells
(a) Diagram of differentiation into renal vesicles. (b) Whole-well scan for LHX1 in 24-well on day 14 of differentiation. The combination of FGF9 10 ng/ml and transient CHIR 3 µM treatment enhanced LHX1 expression. n=2. Scale bar: 5 mm. (c) Representative images of brightfield and immunocytochemistry for PAX8 and LHX1 in hESCs on day 14. Scale bar: 100 µm. (d) Flow cytometry for PAX8 and LHX1 in hESCs on day 14. Samples treated with secondary antibodies alone were used as controls (gray). (e) Immunocytochemistry for BRN1, HNF1β and LAM (Laminin) on day 14 of differentiation. n=6. 50 µm (the lower panel). (f) Brightfield imaging of the organoids that formed in culture after cells were resuspended on day 9, transferred to ultra-low attachment 96-well plates and studied on day 14. Controls were cultured in the basic differentiation medium (ARPMI) after resuspension. FGF9 and CHIR increased the size of the organoids. Scale bar: 100 µm. (g) Whole-mount staining of the organoids on day 11 and 14. Polarized structures surrounded by Laminin were found on day 14, suggesting the differentiation into renal vesicles. n=2. Scale bars: 100 µm.
Figure 4
Figure 4. Self-organizing nephron formation in 2D culture
(a) The protocol for the induction of nephrons. (b) Representative brightfield images on day 21 of differentiation. Scale bar: 1 mm. (c) Immunocytochemistry for CDH1, PODXL and LTL on day 21. Scale bar: 1mm. (d, e) Immunocytochemistry for podocyte (PODXL, NPHS1) proximal tubule (CDH2, LTL), loop of Henle (CDH1, UMOD) and distal tubule (CDH1, BRN1) markers on days 21–28. n=7. Scale bars: 50 µm unless otherwise indicated. (f) The number of LTL+ tubules in structures derived from hESCs and hiPSCs on day 21; n=2. Values were calculated from 10 fields (1 mm2/field) in each sample. Data represent mean +/− SEM. CDH1: Cadherin-1 (E-cadherin). PODXL: Podocalyxin-like (Podocalyxin). LTL: lotus tetragonolobus lectin. NPHS1: Nephrin. UMOD: Uromodulin. CDH2: Cadherin-2 (N-cadherin).
Figure 5
Figure 5. Self-organizing nephron formation in 3D culture
(a, b) Whole-mount staining for CDH1, PODXL and LTL on day 28 (a) and 35 (b) using protocol in Figure 4a. Scale bar: 50 µm. (c, d) Representative immunohistochemistry in structures derived from hESCs and hiPSCs on day 21–28. n=5. Scale bars: 50 µm. CDH1: Cadherin-1 (E-cadherin). PODXL: Podocalyxin-like (Podocalyxin). LTL: lotus tetragonolobus lectin. AQP1: aquaporin1. NPHS1: Nephrin. UMOD: Uromodulin. (c) Low magnification. (d) High magnification. (e) Representative electron microscopy images of glomerulus-like and tubule regions of kidney organoids derived from hESCs. Middle panels represent higher magnification enlargement of the square-enclosed regions within left panels. n=5. Samples were taken at 21 days with the exception of the top right panel which was taken at day 18 and did not have transient CHIR treatment. Dotted lines: Bowman’s capsule. Arrows: foot process. Allow heads: tight-junction. Asterisks: mitochondria. Hashes: brush border-like structures. (f) Electron microscopy images of normal human kidneys showing foot processes (upper panel) and brush borders (lower panel).
Figure 6
Figure 6. Modeling kidney development and injury in kidney organoids
(a) Schematic for kidney development analysis and nephrotoxicity assay. (b) Representative images of immunohistochemistry in structures derived from hESCs treated with DAPT 10 µM from day 14 to 21. n=4. Notch inhibition suppressed proximal tubule formation. Scale bars: 50 µm. (c) Representative immunohistochemistry in structures treated with gentamicin (5 mg/ml) from day 21 to 23 or cisplatin (5 µM) from day 21 to 22. n=6. Scale bars: 50 µm. Gentamicin and cisplatin induced the upregulation of KIM-1, and cisplatin suppressed CDH1 expression. (d) A low magnification image of gentamicin-treated organoids. Scale bar: 100 µm. CDH1: Cadherin-1 (E-cadherin). PODXL: Podocalyxin-like (Podocalyxin). LTL: lotus tetragonolobus lectin. KIM-1: kidney injury molecule-1. (e) Real-time quantitative PCR of KIM-1 in kidney organoids treated with gentamicin at indicated doses. Data is expressed as mean +/− SEM (n=10). (f) Representative immunohistochemistry of organoids treated with cisplatin (5 or 50 µM) from day 23 to 24 (24 hours). n=4. Scale bars: 50 µm.

References

    1. Coresh J, et al. Prevalence of chronic kidney disease in the United States. Jama. 2007;298:2038–2047. - PubMed
    1. Herzlinger D, Koseki C, Mikawa T, al-Awqati Q. Metanephric mesenchyme contains multipotent stem cells whose fate is restricted after induction. Development. 1992;114:565–572. - PubMed
    1. Self M, et al. Six2 is required for suppression of nephrogenesis and progenitor renewal in the developing kidney. The EMBO journal. 2006;25:5214–5228. - PMC - PubMed
    1. Kobayashi A, et al. Six2 defines and regulates a multipotent self-renewing nephron progenitor population throughout mammalian kidney development. Cell Stem Cell. 2008;3:169–181. - PMC - PubMed
    1. Boyle S, et al. Fate mapping using Cited1-CreERT2 mice demonstrates that the cap mesenchyme contains self-renewing progenitor cells and gives rise exclusively to nephronic epithelia. Developmental biology. 2008;313:234–245. - PMC - PubMed

Methods-only references

    1. Freedman BS, et al. Reduced ciliary polycystin-2 in induced pluripotent stem cells from polycystic kidney disease patients with PKD1 mutations. Journal of the American Society of Nephrology : JASN. 2013;24:1571–1586. - PMC - PubMed

Publication types