. 2015 Oct 13:5:14748.
doi: 10.1038/srep14748.

Extracellular microvesicles and invadopodia mediate non-overlapping modes of tumor cell invasion

Affiliations

Extracellular microvesicles and invadopodia mediate non-overlapping modes of tumor cell invasion

Alanna E Sedgwick et al. Sci Rep. .

Abstract

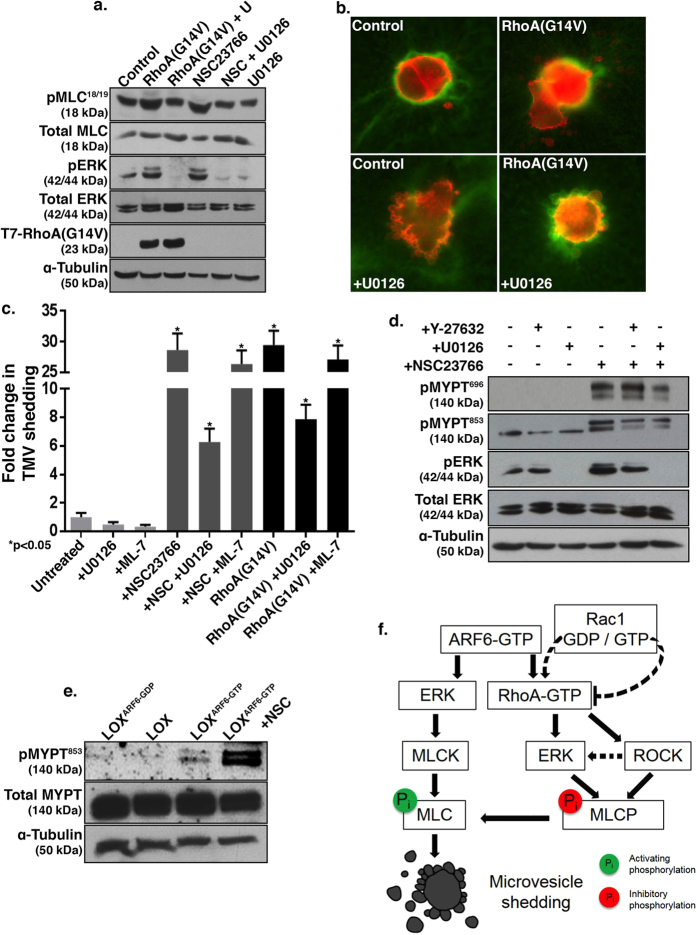
Tumor cell invasion requires the molecular and physical adaptation of both the cell and its microenvironment. Here we show that tumor cells are able to switch between the use of microvesicles and invadopodia to facilitate invasion through the extracellular matrix. Invadopodia formation accompanies the mesenchymal mode of migration on firm matrices and is facilitated by Rac1 activation. On the other hand, during invasion through compliant and deformable environments, tumor cells adopt an amoeboid phenotype and release microvesicles. Notably, firm matrices do not support microvesicle release, whereas compliant matrices are not conducive to invadopodia biogenesis. Furthermore, Rac1 activation is required for invadopodia function, while its inactivation promotes RhoA activation and actomyosin contractility required for microvesicle shedding. Suppression of RhoA signaling blocks microvesicle formation but enhances the formation of invadopodia. Finally, we describe Rho-mediated pathways involved in microvesicle biogenesis through the regulation of myosin light chain phosphatase. Our findings suggest that the ability of tumor cells to switch between the aforementioned qualitatively distinct modes of invasion may allow for dissemination across different microenvironments.


Figures

Figure 1
Figure 1. Matrix characteristics modulate microvesicle release.
(A) LOX cells were grown on thick FITC-gelatin matrix prior to fixation and staining to visualize β1 integrin (red) and actin (blue). Arrows indicate microvesicles. XY axes shown. (B) LOX cells were grown on thin FITC-gelatin matrix prior to fixation and staining to visualize β1 integrin (red) and cortactin (blue). Enlarged panel of merged image shown with arrows to indicate colocalization of cortactin at sites of degradation. XY axes shown. (C) LOX cells were grown on thick FITC-gelatin matrix and stained as in A. XZ axis shown. (D) LOX cells were grown on thin FITC-gelatin matrix and stained as in B. Arrows indicate colocalization of cortactin at sites of degradation. XZ axis shown (E) Microvesicles released from cells grown on thin or thick matrices were quantified by microscopy, as described in Methods. 140 cells were counted per condition and the data shown represents the fold change in average number of TMVs shed per cell. Error bars represent the standard error of the mean. (F) Conditioned media was harvested from 50,000 cells grown in thin or thick FITC-gelatin and analyzed by nanoparticle tracking as in the Methods. (G) SW480 and PC-3 cells were grown on thin or thick FITC-gelatin and demonstrate invadopodia formation or microvesicle release, respectively. Cells on thin gelatin were stained for β1 integrin (red) and cortactin (blue), and those on thick gelatin were stained for β1 integrin (red) and actin (blue).
Figure 2
Figure 2. Matrix stiffness modulates cell morphology and mode of invasion.
(A) Cells transiently transfected to express cytoplasmic mCherry were grown on thin FITC-gelatin and imaged live using confocal fluorescence microscopy. A sequence of time-lapse images taken from Supplementary movie 1 is shown. Arrowheads indicate the leading edge of the cell, and arrows indicate forming proteolytic puncta. Scale bar = 20 μm. (B) Cells transiently transfected to express cytoplasmic mCherry were grown in thick FITC-gelatin and imaged as in A. Scale bar = 20 μm. (C) Cells were grown on approximately 50 μm of gelatin in concentrations from 1 to 5%. The cells are shown both live using phase contrast microscopy (top), and fixed at higher magnification after staining for β1 integrin (green, bottom). Arrows indicate shed microvesicles.
Figure 3
Figure 3. Rac1 activation suppresses TMV shedding.
(A) LOX cells transiently transfected with T7-Rac1(G12V) were seeded on a thick layer of FITC-gelatin prior to fixation and staining to visualize β1 integrin (red) and the T7 tag (blue). Scale bars = 20 μm. (B) Microvesicles released from the cells under experimental conditions described in A and C were quantified by microscopy, as described in the Methods. 140 cells were counted per condition and the data shown represents the fold change in the average number of TMVs shed per cell. Error bars represent the standard error of the mean. (C) Cells were transiently transfected with T7-Rac1(T17N) or treated with 50 μM NSC23766 and grown on a thick layer of FITC-gelatin prior to fixation and staining to visualize β1 integrin (red). (D) Cells transiently transfected with T7-Rac1(T17N) were grown on thin FITC-gelatin prior to fixation and staining to visualize the T7 tag (blue) and β1 integrin (red). An optical section along the dorsal cell surface is shown and transfected cells displayed small plasma membrane blebs (arrows), however TMV release was not observed. (E,F) Cells were treated with 50 μM NSC23766 and grown on a thin layer of FITC-gelatin prior to fixation and staining to visualize β1 integrin (red). Optical sections along the adherent surface of the cells are shown. 100 cells were counted per condition and the percentage of cells over degraded matrix was quantified. The error bars represent the standard error of the mean. (G) Cells were treated with 50 μM NSC23766 and grown on thin FITC-gelatin prior to fixation and staining to visualize paxillin (red) as a marker of focal adhesions. Magnified areas along the cell periphery are shown. Unlike untreated control cells (upper panel), cells treated with Rac1 inhibitor (lower panel) display increased focal contacts that appear to pull on the matrix, which gets doubled-over resulting in more intense FITC puncta (arrows). This is distinct from invadopodia-mediated proteolysis in the upper panel.
Figure 4
Figure 4. Matrix properties guide the activation of Rac1 and RhoA.
(A) Cells were grown on a thin or thick gelatin matrix prior to incubation with PAK-PBD or Rhotekin-RBD beads in effector pulldown assays to assess the levels of active Rac1 and RhoA, respectively. A sample of the total cell lysate was blotted for total Rac1 or RhoA. (B) Microvesicles and exosomes were isolated from cells via serial centrifugation and lysed for western blotting. Equal amounts of protein were loaded for each fraction. ARF6 is shown as a marker for microvesicles and CD63 for exosomes. RhoA is enriched in shed microvesicles but is not present on exosomes. All western blot film images were cropped to show the proteins of interest, and all blots were run using the same experimental conditions.
Figure 5
Figure 5. RhoA activation promotes TMV formation.
(A,B) Cells transiently transfected with T7-tagged RhoA(G14V) or RhoA(T19N) were grown on a thick layer of FITC-gelatin prior to fixation and staining to visualize β1 integrin (red) and the T7 tag (pseudocolored cyan). Scale bars =20 μm. (B) Microvesicles released from cells were quantified as detailed in the Methods, and the data shown represents the fold change in the average number of TMVs shed per cell. Error bars represent the standard error of the mean. (C) Cells were grown on a thick layer of FITC-gelatin and treated with 10 μM Y-27632 prior to fixation and staining to visualize F-actin (red) and β1 integrin (blue). (D) Cells transiently transfected with T7-tagged RhoA(G14V) were grown on a thin layer of FITC-gelatin prior to fixation and staining for β1 integrin (red) and the T7 tag (blue). Cells expressing active RhoA form blebs (arrows) but do not release TMVs on firm matrix. (E,F) Cells were grown on a thin layer of FITC-gelatin and treated with 10 μM Y-27632 prior to fixation and staining to visualize β1 integrin (blue) and F-actin (red). 100 cells per experimental condition were counted, and the percentage of cells over proteolysed matrix was quantified. The percentage of invading cells over degradation per condition is shown. The error bars represent the standard error of the mean. (G) Cells were grown on a thick gelatin matrix in the presence of 50 μM NSC23766 prior to lysis and Rhotekin-RBD effector pulldown assay to assess the levels of RhoA-GTP. Total cell lysate was blotted for total RhoA. (H) Microvesicles released from cells grown in thick FITC-gelatin and treated with 50 μM NSC23766 (NSC) and/or 10 μM Y-27632 (Y) were quantified as detailed in the Methods. 140 cells were counted per condition and the data shown represents the fold change in the average number of TMVs shed per cell. Error bars represent the standard error of the mean. All western blot film images were cropped to show the proteins of interest, and all blots were run using the same experimental conditions.
Figure 6
Figure 6. RhoA is activated downstream of ARF6 during TMV shedding.
(A) LOX and LOXARF6-GTP were assessed for levels of RhoA-GTP using a Rhotekin-RBD effector pulldown assay. Cell lysates were also probed for total levels of RhoA and α-tubulin, and HA to confirm the identity of the HA-tagged ARF6 mutant. (B) Microvesicles released from LOXARF6-GTP and LOXARF6-GTP treated with the ROCK inhibitor Y-27632 were quantified by microscopy as detailed in the Methods, and the data shown represents the fold change in the average number of TMVs shed per cell. The error bars represent the standard error of the mean. C. LOX cells that stably express LOXARF6-GDP were transiently transfected to express T7-tagged RhoA(G14V) (arrow) and grown on a thick FITC-gelatin matrix prior to fixation and staining to visualize the T7 tag on RhoA (pseudocolored cyan) and β1 integrin (red). All western blot film images were cropped to show the proteins of interest, and all blots were run using the same experimental conditions.
Figure 7
Figure 7. ERK and ROCK-mediated regulation of myosin light chain phosphatase during TMV shedding.
(A) Untransfected cells or those transfected with T7-tagged RhoA(G14V) were grown on a thick gelatin matrix and treated with either 50 μM NSC23766 (NSC), 20 μM U0126 (U), or both, prior to western blotting for total and phospho-MLC18/19, total and phospho-ERK202/204, the T7 tag, and α-tubulin. (B) Untransfected cells and those transiently transfected with RhoA(G14V) were grown on a thick FITC-gelatin matrix and treated with 20 μM U0126 prior to fixation and staining to visualize β1 integrin (red). (C) Control cells and those transiently transfected to express RhoA(G14V) were grown on a thick FITC-gelatin matrix and treated with U0126, ML-7, or NSC23766, as indicated prior to fixation and staining to visualize β1 integrin and the T7-tagged mutants. Released microvesicles were quantified as described in the Methods, and the error bars represent the standard error of the mean. (D) Cells were grown on thick gelatin matrix and treated with U0126, Y-27632, NSC23766, or a combination thereof as indicated, prior to western blotting to assess phospho-MYPT1 Thr696, phospho-MYPT1 Thr853, phospho-ERK202/204, total ERK, and α-tubulin. (E) LOX, LOXARF6-GDP, LOXARF6-GTP, and LOXARF6-GTP treated with 50 μM NSC23766 (NSC) were grown on a thick gelatin matrix prior to lysis and western blotting for total and phospho-MYPT1853 and α-tubulin. (F) Schematic representation of signaling pathways that lead to MLC phosphorylation to promote TMV shedding. In addition to the ARF6-ERK-MLCK pathway previously described, RhoA signaling also promotes TMV shedding by activation of ERK and ROCK leading to the inhibitory phosphorylation of the MYPT1 subunit of myosin phosphatase. ARF6 activation and Rac1 inhibition feed into pathways that promote RhoA activation. All western blot film images were cropped to show the proteins of interest. All protein gels were run using 12% acrylamide, except for MYPT1 blots which were run using 8% acrylamide.

Similar articles

Cited by

References

    1. Nguyen D. X., Bos P. D. & Massague J. Metastasis: from dissemination to organ-specific colonization. Nat Rev Can 9, 274–284 (2009). - PubMed
    1. Chaffer C. L. & Weinberg R. A. A perspective on cancer cell metastasis. Science 331, 1559–1564 (2011). - PubMed
    1. Spano D., Heck C., De Antonellis P., Christofori G. & Zollo M. Molecular networks that regulate cancer metastasis. Semin Can Biol 22, 234–249 (2012). - PubMed
    1. Yilmaz M. & Christofori G. EMT, the cytoskeleton, and cancer cell invasion. Cancer Metast Rev 28, 15–33 (2009). - PubMed
    1. Orgaz J. L. et al. Diverse matrix metalloproteinase functions regulate cancer amoeboid migration. Nat Commun 5, 4255 (2014). - PMC - PubMed

Publication types

MeSH terms