. 2015 Oct 13:6:8490.
doi: 10.1038/ncomms9490.

Neuronal uptake and propagation of a rare phosphorylated high-molecular-weight tau derived from Alzheimer's disease brain

Affiliations

Neuronal uptake and propagation of a rare phosphorylated high-molecular-weight tau derived from Alzheimer's disease brain

Shuko Takeda et al. Nat Commun. .

Abstract

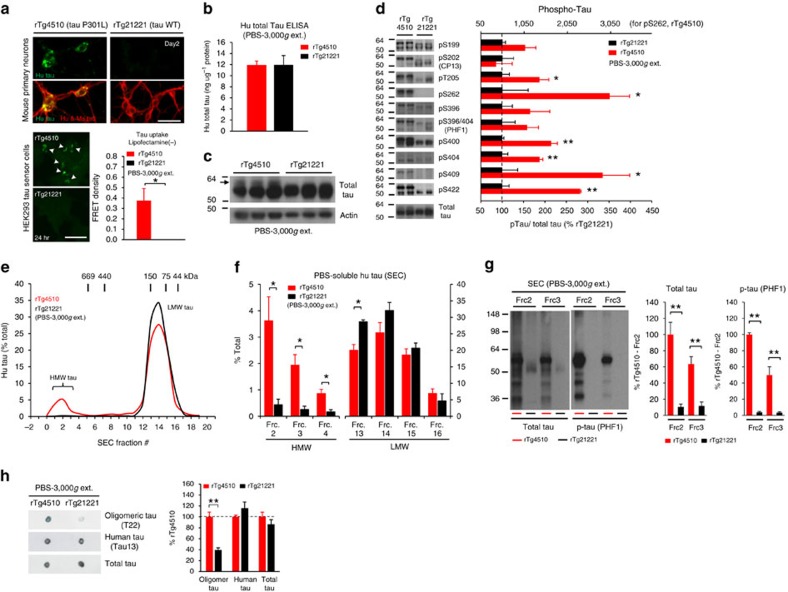
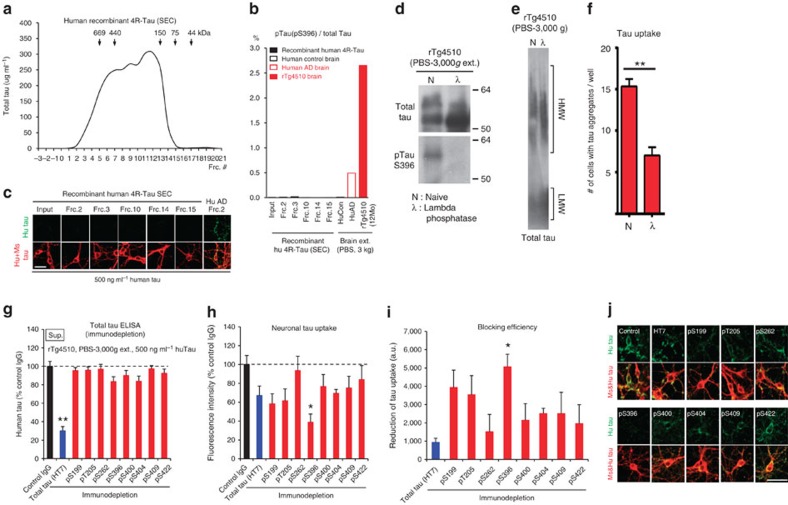
Tau pathology is known to spread in a hierarchical pattern in Alzheimer's disease (AD) brain during disease progression, likely by trans-synaptic tau transfer between neurons. However, the tau species involved in inter-neuron propagation remains unclear. To identify tau species responsible for propagation, we examined uptake and propagation properties of different tau species derived from postmortem cortical extracts and brain interstitial fluid of tau-transgenic mice, as well as human AD cortices. Here we show that PBS-soluble phosphorylated high-molecular-weight (HMW) tau, though very low in abundance, is taken up, axonally transported, and passed on to synaptically connected neurons. Our findings suggest that a rare species of soluble phosphorylated HMW tau is the endogenous form of tau involved in propagation and could be a target for therapeutic intervention and biomarker development.


Figures

Figure 1
Figure 1. Neuronal uptake of HMW tau from brain extract of rTg4510 tau-transgenic mouse.
(a) Primary neurons were incubated with PBS-soluble brain extracts (3,000–150,000g centrifugation supernatant, 500 ng ml−1 human tau) from a 12-month-old rTg4510 mouse. (a, left) Immunostaining with human tau-specific antibody (green) and total (human and mouse) tau antibody (red, as a neuronal marker). (a, right) Quantification of human tau uptake. (n=9–12). One-way ANOVA. (b) Neurons were incubated with brain extracts (500 ng ml−1 human tau) for 2 and 5 days. (c) Tau uptake assay in HEK-tau-biosensor cells. Brain extracts (1 μg protein) were applied to the cells (lipofectamie (−)). (n=4). Mann–Whitney U-test. (d,e) SEC of PBS-soluble brain extracts. (d) Representative graph of human tau levels (ELISA) in SEC-separated samples. (e) Mean human tau levels of HMW (Frc. 2–4), middle molecular weight (Frc. 9–10) and LMW (Frc. 13–16) SEC fractions. (n=3). Unpaired t-test. (f, left) Neurons were incubated with SEC fractions (100 ng ml−1 human tau) from 3,000g extract and immunostained. (f, right) Quantification of human tau uptake. (n=3–5). One-way ANOVA. (g) Tau uptake assay in HEK-tau-biosensor cells. HMW (Frc. 2)/LMW (Frc. 14) fractions were applied without lipofectamine. (n=4). Unpaired t-test. (h) AFM analysis of HMW tau isolated from rTg4510 brain (10,000g total extract, SEC Frc. 3). Full colour range corresponds to a vertical scale of 20 nm. Scale bar, 100 nm. (h, right) Size (AFM heights) distribution histogram of HMW tau. (i) Human tau taken by neurons was co-stained with Alz50 antibody or ThioS. Brain sections from rTg4510 mouse were used as positive controls for each staining. (jl) HMW tau uptake into neurons in vivo. (j) HMW (Frc. 2–3)/LMW (Frc. 13–14) SEC fractions (rTg4510, PBS-3,000g, 100 ng ml−1 human tau) or PBS were injected into the left hippocampus of pre-tangle stage rTg4510 mice (2–3 months). (k) Three weeks after the injection, the brains were collected and immunostained for tau (AT8). Scale bar, 500 μm. (l) Quantification of AT8-positive neurons in the ipsilateral dentate gyrus (Kruskal–Wallis test). Scale bar, 25 μm, except for (h) and (k). *P<0.05, **P<0.01.
Figure 2
Figure 2. Lack of PBS-soluble phosphorylated HMW tau species is associated with low tau uptake in primary neurons.
(a, top) Uptake of human tau from brain extracts from rTg4510 and rTg21221 mice by primary neurons (PBS-3,000g, 500 ng ml−1 human tau). Neurons were immunostained with human tau-specific antibody (green) and total (human and mouse) tau antibody (red). (a, bottom) Tau uptake assay in HEK-tau-biosensor cells. Brain extracts (10 μg protein) were applied to the cells (lipofectamie (−)). (n=4) Unpaired t-test. Scale bar, 50 μm. (b) Human tau levels in brain extracts (ELISA). (c) Immunoblot analysis of PBS-soluble extracts with total tau antibody (DA9). Up-shifted bands in rTg4510 brain suggest phosphorylation of tau (arrow). (d) Brain extracts were immunoblotted with phospho-tau specific antibodies recognizing different epitopes. Representative immunoblot and quantification of phospho-tau levels at each epitope. (n=3–4) Unpaired t-test. (e,f) SEC analysis of PBS-soluble tau. (e) Representative graph of human tau levels (ELISA) in SEC-separated samples (f) Mean human tau levels of HMW (Frc. 2–4) and LMW (Frc. 13–16) SEC fractions. (n=3–6) Unpaired t-test. (g) Immunoblot analysis (SDS-PAGE) of SEC-separated fractions from brain extracts (total tau, DAKO). Quantification of band density is also shown (right graphs) (n=4). Unpaired t-test. (h) Dot blot analysis of PBS-soluble brain extracts with tau oligomer-specific antibody (T22), human tau-specific antibody (Tau13), and total tau antibody. Quantification of dot blot signals is also shown (right) (n=4). Unpaired t-test. Eleven to thirteen-month-old animals were used. *P<0.05, **P<0.01.
Figure 3
Figure 3. Three-chambered microfluidic device for modelling dual-layered neurons.
(a) Schematics of a microfluidic device for culturing neurons in three distinct chambers. Mouse primary neurons are plated into the 1st and 2nd chambers (100 μm in thickness) and axon growth is guided through microgrooves (3 μm in thickness, 600 μm in length) connecting each chamber. (b, left) Axons from the 1st chamber neuron (green, DA9 as axonal marker) extend into the 2nd chamber within 4 days (neurons were plated only in the 1st chamber). No MAP2-positive dendrites (red) were found in the 2nd chamber, confirming that a 600 μm microgroove is sufficiently long to isolate axon terminals from soma and dendrites. (b, middle) Most axons from the 2nd chamber neuron extend into the 3rd chamber (neurons were plated only in the 2nd chamber). (b, right) Two sets of neurons were plated into the 1st and 2nd chamber and established synaptic contact in the 2nd chamber. (c) Neurons in the 1st and 2nd chambers were transfected with GFP and RFP, respectively. GFP positive axon from the 1st chamber neuron extended into the 2nd chamber, connecting to RFP positive 2nd chamber neuron, which projected its axon into the 3rd chamber. Scale bar, 50 μm.
Figure 4
Figure 4. Neuron-to-neuron transfer of rTg4510 mouse brain-derived human tau species in a three-chambered microfluidic device.
(a) PBS-soluble extract from rTg4510 brain (12-month-old, 500 ng ml−1 human tau) was added to the 1st chamber of a 3-chamber microfluidic device. Diffusion of brain extract from the 1st to the 2nd chamber was blocked by a hydrostatic pressure barrier. (b) Immunostaining for human tau (green) and total (human and mouse) tau (red) at day 5. Human tau positive neurons were detected in the 2nd chamber (white arrow). Neurons in the side reservoir of the 2nd chamber were negative for human tau staining (bottom). (c) A human tau positive axon (arrow) and dendrite (arrow head) extending from the 2nd chamber neuron. (d) Concentration dependency of tau uptake and propagation. rTg4510 brain extract (PBS-3,000g) was diluted in culture medium to obtain three different concentrations (6, 60 and 600 ng ml−1) of human tau and added into the 1st chamber. Neurons were immunostained for human tau and total (human and mouse) tau at day 5. (d, right) Quantification of fluorescence intensity of human tau staining in the 2nd chamber. (n=4–7). One-way ANOVA. (e) Time course of neuron-to-neuron transfer of rTg4510 brain-derived human tau. The rTg4510 brain extract (PBS-3,000g, 500 ng ml−1 human tau) was added to the 1st chamber and incubated for up to 14 days. Neurons were immunostained at different time points. Human tau positive 2nd chamber neurons (arrow head) and axons from the 1st chamber neuron (arrow) were detected after 5 days of incubation. Human tau positive axons were detected in the 3rd chamber after 8 days (arrow). Scale bar, 50 μm. *P<0.05.
Figure 5
Figure 5. rTg4510 brain-derived human tau was stable and propagated even after removal of brain extract from the chamber.
(a) rTg4510 brain extract (12-month-old, PBS-3,000g) was diluted in culture medium (500 ng ml−1 human tau in final concentration) and added to the 1st chamber of 3-chamber microfluidic neuron device. After 2 days (before tau propagation occurs) or 5 days (after tau propagation occurred, but not yet progressed to the 3rd chamber) of incubation, brain extract was washed out from the 1st chamber and replaced with fresh culture medium. (b,c) Neurons were immunostained for human tau (green) and total (human and mouse) tau (red) at designated time points. (b) Human tau positive neuron was detected in the 2nd chamber (day 8, arrow) even after Tg brain extract was washed out from the 1st chamber at day 2. (c) Human tau was detected in the 3rd chamber axons (arrow) even after Tg brain extract was washed out from the 1st chamber at day 5. Human tau taken up by the 1st chamber neuron was still detectable at day 14 (9 days after removal of Tg brain extract). Scale bar, 50 μm.
Figure 6
Figure 6. Neuronal uptake of PBS-soluble HMW tau derived from human AD brain.
(a,b) Primary neurons were incubated with AD or control brain extracts (cases were matched for age and postmortem interval (Supplementary Table S1)) and immunostained at day 2 (a). (b) Quantification of fluorescence intensity of human tau staining. One-way ANOVA and a subsequent Tukey-Kramer test. (c,d) Tau uptake (c) and seeding activity (d) assay in HEK-tau-biosensor cells. (Mann–Whitney U-test) (e) Subcellular localization of human tau taken up by neurons (PBS-3,000g, 500 ng ml−1 human tau). (f) Neuron-to-neuron transfer of tau in a 3-chamber microfluidic device. AD brain extract (PBS-3,000g, 500 ng ml−1 human tau) was added to the 1st chamber. Human tau positive neurons were detected in both the 1st and 2nd chamber at day 7 (arrow). (g,h) Quantification of total-tau (g) and phospho-tau (h) levels in AD and control brain extract (ELISA). Unpaired t-test. (i) Brain extracts were immunoblotted with phospho-tau specific antibodies recognizing different epitopes. Representative immunoblot and quantification of phospho-tau levels at each epitope. Unpaired t-test. (j,k) SEC analysis of PBS-soluble tau from AD and control brain. (j) Representative graph of total tau levels (ELISA) in SEC-separated samples. Small peaks for HMW fractions were detected in both groups (right panel). (k) Mean total tau levels of HMW SEC fractions. (l) Tau uptake from each SEC fraction (5 or 500 ng ml−1 human tau) by primary neurons. (m) Phospho-tau levels in each SEC fraction (ELISA). Unpaired t-test. Scale bar, 25 μm. *P<0.05, **P<0.01.
Figure 7
Figure 7. Tau phosphorylation correlates with cellular uptake.
(ac) Non-phosphorylated HMW tau was not taken up by neurons. (a) Tau oligomer mixture solution was prepared from recombinant human tau, followed by SEC and tau ELISA. (b) Phospho-tau levels in SEC fractions and brain extracts (pS396 tau ELISA). (c) Each SEC fraction was incubated with primary neurons. Neurons were immunostained at day 2. (df) Dephosphorylation reduced tau uptake. (d) Immunoblot analysis of total (Tau13)- and phospho-tau (pS396) levels in rTg4510 (12-month-old) brain extracts treated with lambda phosphatase. (e) SDD-AGE analysis of brain extracts treated with phosphatase. (f) Tau uptake assay. Phosphatase-treated brain extract was applied to HEK-tau-biosensor cells. (n=3, **P<0.01), unpaired t-test. (gj) Immunodepletion of phospho-tau reduced neuronal tau uptake. rTg4510 (12-month-old) brain extracts were immunodepleted with total- or phospho-tau specific antibodies. (n=5). (g) Total tau levels in tau-immunodepleted samples (ELISA). **P<0.01 versus control IgG. (h) Tau uptake in primary neurons (day 2). *P<0.05 versus control IgG. (i) Blocking efficiency was defined as the percentage of tau-uptake reduction (versus control IgG) multiplied by tau levels in the immunodepleted brain extracts (% control IgG). *P<0.05 versus total tau (HT7). One-way ANOVA and a subsequent Tukey-Kramer test. (j) Representative images of tau uptake in primary neurons. Scale bar, 50 μm.
Figure 8
Figure 8. Extracellular tau species from rTg4510 mouse brain can be taken up by primary neurons.
(a) A large-pore probe in vivo microdialysis with push–pull perfusion system. ISF samples were collected from freely moving rTg4510 and control mice (7-month-old) using a 1,000 kDa cutoff probe. (b) Representative probe placement. Horizontal brain sections were obtained after ISF collection (24 h after probe insertion) and stained for human tau (green) and DAPI. Dotted line depicts probe location (top). The probe was briefly perfused with Texas red dye (70 kDa, 1 mg ml−1) to locate the site of microdialysis. There was no morphological evidence of substantial neuronal loss. There was no apparent difference in the number of human tau positive neurons between ipsilateral (probe-implanted side) and contralateral hippocampal sections (b, bottom). Hip, hippocampus. (c) Representative graph of human tau levels in SEC-separated ISF sample from rTg4510 mouse. Microdialysate (400 ul) was loaded on SEC column and tau levels in each fraction were measured by ELISA. (d) ISF samples were incubated with primary neurons, which were then immunostained for human tau and total (human and mouse) tau. ISF from rTg4510 was diluted to a final concentration of 40 ng ml−1 human tau and the same volume of ISF from a control mouse was used for incubation. (e) Concentration dependency of ISF tau uptake by primary neurons. rTg4510 brain ISF was diluted in culture medium to obtain three different concentrations (10, 20 and 40 ng ml−1) of human tau. Scale bar, 50 μm.

Comment in

References

    1. Mandelkow E. M. et al.. Tau domains, phosphorylation, and interactions with microtubules. Neurobiol. Aging 16, 355–362 discussion 362–353 (1995). - PubMed
    1. Iqbal K., Liu F., Gong C. X. & Grundke-Iqbal I. Tau in Alzheimer disease and related tauopathies. Curr. Alzheimer Res. 7, 656–664 (2010). - PMC - PubMed
    1. Braak H. & Braak E. Neuropathological stageing of Alzheimer-related changes. Acta Neuropathol. 82, 239–259 (1991). - PubMed
    1. Hyman B. T., Van Hoesen G. W., Damasio A. R. & Barnes C. L. Alzheimer's disease: cell-specific pathology isolates the hippocampal formation. Science 225, 1168–1170 (1984). - PubMed
    1. Serrano-Pozo A. et al.. Examination of the clinicopathologic continuum of Alzheimer disease in the autopsy cohort of the National Alzheimer Coordinating Center. J. Neuropathol. Exp. Neurol. 72, 1182–1192 (2013). - PMC - PubMed

Publication types