. 2015 Oct 19;212(11):1967-85.
doi: 10.1084/jem.20141898. Epub 2015 Oct 12.

Loss of Tifab, a del(5q) MDS gene, alters hematopoiesis through derepression of Toll-like receptor-TRAF6 signaling

Affiliations

Loss of Tifab, a del(5q) MDS gene, alters hematopoiesis through derepression of Toll-like receptor-TRAF6 signaling

Melinda E Varney et al. J Exp Med. .

Abstract

TRAF-interacting protein with forkhead-associated domain B (TIFAB) is a haploinsufficient gene in del(5q) myelodysplastic syndrome (MDS). Deletion of Tifab results in progressive bone marrow (BM) and blood defects, including skewed hematopoietic stem/progenitor cell (HSPC) proportions and altered myeloid differentiation. A subset of mice transplanted with Tifab knockout (KO) HSPCs develop a BM failure with neutrophil dysplasia and cytopenia. In competitive transplants, Tifab KO HSPCs are out-competed by wild-type (WT) cells, suggesting a cell-intrinsic defect. Gene expression analysis of Tifab KO HSPCs identified dysregulation of immune-related signatures, and hypersensitivity to TLR4 stimulation. TIFAB forms a complex with TRAF6, a mediator of immune signaling, and reduces TRAF6 protein stability by a lysosome-dependent mechanism. In contrast, TIFAB loss increases TRAF6 protein and the dynamic range of TLR4 signaling, contributing to ineffective hematopoiesis. Moreover, combined deletion of TIFAB and miR-146a, two genes associated with del(5q) MDS/AML, results in a cooperative increase in TRAF6 expression and hematopoietic dysfunction. Re-expression of TIFAB in del(5q) MDS/AML cells results in attenuated TLR4 signaling and reduced viability. These findings underscore the importance of efficient regulation of innate immune/TRAF6 signaling within HSPCs by TIFAB, and its cooperation with miR-146a as it relates to the pathogenesis of hematopoietic malignancies, such as del(5q) MDS/AML.


Figures

Figure 1.
Figure 1.
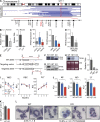
TIFAB deletion in del(5q) MDS/AML and mouse BM cells. (A) Schematic representation showing the genomic position of the TIFAB locus at chr 5q31.1. Below, blue/purple horizontal bars show extent of chr 5q deletions in human AML. (B) qPCR analysis of TIFAB mRNA in human CD34+ and CD34 (left), and mouse lineage positive (Lin+) and lineage negative (Lin; right) BM cells. (C) TIFAB mRNA expression in normal CD34+ BM cells (n = 17), refractory anemia, and refractory anemia with excess blasts MDS CD34+ cells with del(5q) (n = 47) or diploid 5q status (n = 127) adapted from public gene expression studies (Pellagatti et al., 2006; left). TIFAB mRNA expression was independently verified in normal, MDS dip(5q) (n = 4), and del(5q) (n = 4) BM mononuclear cells (right). *, P < 0.05; Student’s t test. (D) TIFAB mRNA expression by qRT-PCR in MDS (n = 12) and AML (n = 4) mononuclear cells with del(5q). (E) Schematic representation of targeted Tifab allele. Exon 3, which contains the entire coding sequence, is deleted and replaced with a β-galactosidase and neomycin-resistant gene cassette floxed by loxP sites. The position of the 3′ probe for Southern blot is shown in blue. (F) 3′ Southern blot is shown to confirm germline deletion of Tifab. (G) Immunoblot analysis of BM lysates for TIFAB and tubulin protein expression from Tifab+/+ (WT), Tifab+/− (HET), and Tifab−/− (KO) mice. (H) Tifab mRNA was determined by Northern blot analysis (left) and by qRT-PCR (right). (I) BM isolated from Tifab WT, HET, and KO mice was transplanted into lethally irradiated syngeneic recipient BoyJ mice. PB counts from mice transplanted with Tifab WT, HET, and KO BM cells at the indicated time points (months; n > 9 per group) from three independent transplants. *, P < 0.05; Student’s t test. WBC, white blood cell; RBC, red blood cell; and PLT, platelet. (J) PB counts from mice transplanted with Tifab WT, HET, and KO BM cells at 6 mo after transplant (n > 9 per group) from three independent experiments. *, P < 0.05; Student’s t test. NE, neutrophils; LY, lymphocytes; and MO, monocytes. (K) BM cellularity was determined for two femurs and one tibia (2F1T) for WT (n = 3) and KO (n = 3) mice. (L) Wright-Giemsa–stained BM cytospins from representative mice transplanted with Tifab WT, HET, and KO BM cells. Percent neutrophil dysplasia is shown for below the images for WT (n = 3) and KO (n = 3) BM cells. Bars show BM cytospins at low (20 µm) and high (7.5 µm) magnification. Error bars are mean ± SEM values.
Figure 2.
Figure 2.
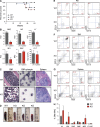
Transplantation of Tifab-deleted BM cells results in bone marrow failure. (A) Kaplan-Meier survival curves for transplanted mice reconstituted with Tifab WT (n = 9), HET (n = 15), or KO (n = 11) BM cells. Summary from three independent transplants. (B) PB counts from age-matched WT (n = 3) or moribund Tifab KO and HET (n = 4) mice. *, P < 0.05; Student’s t test. WBC, white blood cell; RBC, red blood cell; PLT, platelet; NE, neutrophils; LY, lymphocytes; and MO, monocytes. (C) H&E-stained femur and spleen, and Wright-Giemsa–stained BM cytospins from a representative moribund Tifab KO mouse. Bars: (BM) 100 µm; (cytospins) 20 µm; (spleen) 100 µm. (D) Representative spleens from age-matched WT and moribund Tifab KO mice. (E–G) Flow cytometric analysis of PB (E), BM (F), and spleen (G) cells isolated from a WT and representative moribund Tifab KO transplant mouse. (H) Flow cytometric analysis of HSPC proportions in the BM of Tifab WT (n = 3) and moribund KO (n = 2) transplanted mice. Error bars are mean ± SEM values. *, P < 0.05.
Figure 3.
Figure 3.
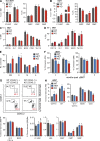
Tifab−/− BM cells exhibit altered hematopoietic proportions after transplantation. (A) LSK, LT-HSC (LSK+ CD150+CD48), MEP, CMP, and GMP in BM cells from Tifab WT or KO mice (n = 7). (B) LSK, LT-HSC (LSK+ CD150+CD48), MEP, CMP, and GMP in BM from mice transplanted with Tifab WT or KO BM cells from two independent experiments (n = 6). *, P < 0.05; Student’s t test. (C and D) BM (C) and PB (D) proportions from mice transplanted with Tifab WT or KO BM cells (n = 6) from three independent experiments. *, P < 0.05; Student’s t test. (E) Numbers of colony-forming cells in methylcellulose from LSK cells from Tifab WT, HET, or KO BM mice (n = 6; 2 independent BMT). *, P < 0.05; Student’s t test. GM, granulocyte-monocyte; G, granulocyte; M, monocyte; E, erythroid (BFU-E). (F) 3 × 10⁵ BM isolated from Tifab WT, HET, and KO mice (CD45.2) were mixed with equal numbers of competitor BoyJ BM cells (CD45.1), and then transplanted into lethally radiated syngeneic recipient BoyJ mice (CD45.1). PB and BM chimerism was determined at 4 and 8 mo after transplantation. Calculated chimerism is based on the ratio of CD45.1 and CD45.2 mononuclear cells. Three independent experiments were performed. (G) Representative flow cytometric blots of PB chimerism at 8 mo after transplantation on myeloid (Gr1+CD11b) and lymphoid (B220+) gated populations. (H and I) Flow cytometric analysis of myeloid (CD11b and Gr1), and lymphoid (CD3 and B220) donor-derived CD45.2+ proportions within the PB (H) and BM (I) of Tifab WT (n = 4), HET (n = 4), and KO (n = 5) competitively transplanted mice. *, P < 0.05; Student’s t test. (J) Flow cytometric analysis of HSPC donor-derived CD45.2+ proportions within the BM of Tifab WT (n = 4), HET (n = 4), and KO (n = 5) competitively transplanted mice at 8 mo. *, P < 0.05; Student’s t test and Mann-Whitney test. Error bars are mean ± SEM values.
Figure 4.
Figure 4.
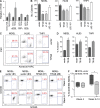
TIFAB suppresses immune signaling and NF-κB activation downstream of the TLR4 receptor in BM HSPCs. (A) Heat map generated from gene set enrichment analysis (GSEA) showing gene expression differences in LSK isolated from 3-mo-old mice transplanted with Tifab WT or KO BM cells (n = 3 mice/group). (B) GSEA of statistically significant gene sets enriched in the LSK cells of transplanted Tifab−/− cells (up in KO) or WT cells (down in KO). (C) Validation of gene expression of the indicated genes in BM MNC by qRT-PCR. *, P < 0.05; Student’s t test. (D and E) Expression analysis of the indicated genes in BM MNC by qRT-PCR after stimulation with LPS (D; 100 ng/ml) or TNF (E; 10 ng/ml) for the indicated time points. Expression was normalized to time 0 (1.0). *, P < 0.05; Student’s t test.
Figure 5.
Figure 5.
TIFAB binds to TRAF6 and suppresses NF-κB activation. (A) A representative silver stain after tandem affinity purification of FLAG-HA-TIFAB from HL60 cells. (B) TIFAB-expressing HL60 cells were lysed and fractionated into cytoplasmic (C) and nuclear (N) fractions, which were then subjected to coimmunoprecipitation of FLAG-HA-TIFAB. Immunoblotting for TRAF6, TIFAB, PARP (nuclear loading control), and GAPDH (cytosolic loading control) is shown. (C) Coimmunoprecipitation analysis of HEK293 transfected with empty vector, HA-TIFAB, FLAG-TRAF6, or HA-TIFAB and FLAG-TRAF6. Lysates were immunoprecipitated with anti-HA (TIFAB), and then blotted for FLAG (TRAF6). (D) Immunoblot analysis of THP1 and HL60 cells transduced with empty vector (Vec) or FLAG-TIFAB for phosphorylated IKKβ (pIKKβ), total IKKβ, and GAPDH. (E) Overview of TLR4 and TNFR-mediated activation of NF-κB, and the proposed regulation by TIFAB. (F–I) NF-κB activation was measured by κB-site containing reporter assays in HEK293 cells transfected with empty vector, TIFAB, and/or IKKβ (F), p65 (G), TRAF6 (H), or TRAF2 (I). Values are normalized to Renilla-luciferase and empty vector (1.0). Summary of three independent experiments. Error bars are mean ± SEM values. *, P < 0.05; Student’s t test.
Figure 6.
Figure 6.
TIFAB inhibits TLR4 signaling by inducing degradation of TRAF6 protein via lysosomes. (A) Immunoblot analysis of HEK293 cells transfected with empty vector, TRAF6, or FLAG-TIFAB (left), and HL60 cells transduced with empty vector (pMSCV-pGK-GFP) or FLAG-TIFAB (right). Images are representative from at least three independent experiments. (B) Immunoblot analysis of HEK293 transfected with empty vector, TIFAB, and/or TRAF6 (left) or TRAF2 (right). Images are representative from at least two independent experiments. (C) Immunoblot analysis of human THP1 cells transduced with scrambled control shRNA (shCTL) or an shRNA targeting human TIFAB (shTIFAB). (D) Immunoblot analysis for TRAF6 on Tifab WT or KO BM cells from independent pre and post-transplanted mice. (E) Expression analysis of TRAF6 mRNA by qRT-PCR in HEK293 cells transfected with empty vector, TRAF6, and/or FLAG-TIFAB. (F) Expression analysis of Tifab or Traf6 mRNA by qRT-PCR in Tifab WT and KO BM cells. (G) Immunoblot analysis of HEK293 transfected with empty vector, TIFAB, and/or TRAF6, and then treated with a proteasome inhibitor (MG132, 10 µM for 12 h) or a lysosome inhibitor (3-MA, 5 mM for 24 h). Images are representative from at least three independent experiments. (H) HEK293 cells were treated with MG132 or 3-MA as in G, and immunoblotted for total ubiquitin (Ub) and LC3B, respectively. (I) Expression analysis of Traf6 mRNA in Tifab WT or KO-transduced BM MNC expressing a scrambled control shRNA (shCTL) or an shRNA targeting mouse Traf6 (shTraf6). (J and K) QRT-PCR expression analysis of Tnfaip3 (J) and Sod2 (K) in Tifab WT or KO BM MNC expressing a scrambled control shRNA (shCTL) or an shRNA-targeting mouse Traf6 (shTraf6) after stimulation with LPS (100 ng/ml) for 4 h. Data are summarized from biological and technical replicates. Error bars are mean ± SEM values. *, P < 0.05; Student’s t test.
Figure 7.
Figure 7.
TIFAB and miR-146a cooperate to regulate TRAF6 and hematopoietic function. (A) Expression analysis of miR-146a in WT and KO BM MNC by qRT-PCR after stimulation with LPS (100 ng/ml) for the indicated time points. Expression was normalized to time 0 (1.0). *, P < 0.05; Student’s t test. (B) Expression analysis of Traf6 mRNA by qRT-PCR in WT, Tifab KO, miR-146a KO, and double KO (dKO) BM cells. *, P < 0.05; Student’s t test. (C) Immunoblot analysis for TRAF6 on WT, Tifab KO, miR-146a KO, and dKO BM cells from transplanted mice. (D) Total colony-forming cells in methylcellulose from BM MNC from WT, Tifab KO, miR-146a KO, and dKO BM (n = 5–6; two independent experiments). *, P < 0.05; Student’s t test. (E) Proportion of colonies formed from D. GM, granulocyte-monocyte; G, granulocyte; M, monocyte; E, erythroid (BFU-E). **, P < 0.01. (F) PB counts from mice transplanted with WT, Tifab KO, miR-146a KO, and dKO BM cells at 4 mo after transplant (n > 8 per group). Two independent transplantations experiments were performed. NE, neutrophils; LY, lymphocytes; and RBC, red blood cells. Error bars are mean ± SEM values. *, P < 0.05; **, P < 0.01; ***, P < 0.001, Student’s t test.
Figure 8.
Figure 8.
Inhibition of TRAF6 and NF-κB signaling depends on the TIFAB C-terminal domain and is independent of the FHA domain. (A) Overview of WT TIFAB and various TIFAB deletion mutants. Summary of NF-κB activation in HEK293 cells after expression of TIFAB mutants under basal (B) and TRAF6-induced conditions (C). Summary of TRAF6 protein expression in HEK293 cells after expression of TIFAB mutants (D). FHA, fork-head associated domain; FLAG, FLAG motif cloned at the N-terminal region of TIFAB mutants; nd, not determined. −, repression; +, normal levels; +/−, moderate repression. (B) NF-κB activation was measured by a κB-site containing reporter assays in HEK293 cells transfected with empty vector, TIFAB, or the indicated TIFAB deletion mutants. Values are normalized to Renilla-luciferase and empty vector (1.0). *, P < 0.05; Student’s t test. (C) NF-κB activation was measured by κB-site containing reporter assays in HEK293 cells transfected with empty vector, TRAF6, and TIFAB or the indicated TIFAB deletion mutants. Values are normalized to Renilla-luciferase and empty vector (1.0). *, P < 0.05; **, P < 0.01; ***, P < 0.001; Student’s t test. (D) Immunoblot analysis of HEK293 transfected with empty vector, TRAF6, and TIFAB or TIFAB deletion mutants. Error bars are mean ± SEM values.
Figure 9.
Figure 9.
TIFAB reexpression suppresses MDS/AML cells. (A) Relative TIFAB mRNA expression determined by qRT-PCR from normal and del(5q) AML patient BM MNC, and transduced cell lines with empty vector or FLAG-TIFAB. (B) Colony formation in methylcellulose of MDSL, HL60, and THP1 cells transduced with empty vector, FLAG-TIFAB, FLAG-TIFABΔ1-91, FLAG-TIFABΔ92-161 was measured after 7–9 d. *, P < 0.05; **, P < 0.01; Student’s t test. (C) Representative Annexin V staining for MDSL, HL60, and THP1 cells transduced with empty vector or FLAG-TIFAB (top). (D) The corresponding summary for Annexin V staining is shown for more than two independent experiments (bottom). *, P < 0.05; Student’s t test. (E) MDSL cells transduced with vector or TIFAB were engrafted into NSGS mice (n = 6/group) and monitored for BM chimerism at the indicated time points. BM engraftment is shown for individual mice transplanted with vector (#1 and #3)-MDSL and TIFAB (#7 and #8)-MDSL cells at 4 and 8–12 wk (human versus mouse CD45). Percent of human cell (MDSL) engraftment is shown for the representative mice. (F) Summary of BM engraftment for mice transplanted with vector- and TIFAB-MDSL cells (n > 5 mice per group). *, P < 0.05; Student’s t test.

References

    1. Barlow J.L., Drynan L.F., Hewett D.R., Holmes L.R., Lorenzo-Abalde S., Lane A.L., Jolin H.E., Pannell R., Middleton A.J., Wong S.H., et al. . 2010. A p53-dependent mechanism underlies macrocytic anemia in a mouse model of human 5q- syndrome. Nat. Med. 16:59–66. 10.1038/nm.2063 - DOI - PMC - PubMed
    1. Barreyro L., Will B., Bartholdy B., Zhou L., Todorova T.I., Stanley R.F., Ben-Neriah S., Montagna C., Parekh S., Pellagatti A., et al. . 2012. Overexpression of IL-1 receptor accessory protein in stem and progenitor cells and outcome correlation in AML and MDS. Blood. 120:1290–1298. 10.1182/blood-2012-01-404699 - DOI - PMC - PubMed
    1. Beg A.A., Sha W.C., Bronson R.T., and Baltimore D.. 1995. Constitutive NF-kappa B activation, enhanced granulopoiesis, and neonatal lethality in I kappa B alpha-deficient mice. Genes Dev. 9:2736–2746. 10.1101/gad.9.22.2736 - DOI - PubMed
    1. Boldin M.P., Taganov K.D., Rao D.S., Yang L., Zhao J.L., Kalwani M., Garcia-Flores Y., Luong M., Devrekanli A., Xu J., et al. . 2011. miR-146a is a significant brake on autoimmunity, myeloproliferation, and cancer in mice. J. Exp. Med. 208:1189–1201. 10.1084/jem.20101823 - DOI - PMC - PubMed
    1. Boultwood J., Fidler C., Lewis S., Kelly S., Sheridan H., Littlewood T.J., Buckle V.J., and Wainscoat J.S.. 1994. Molecular mapping of uncharacteristically small 5q deletions in two patients with the 5q- syndrome: delineation of the critical region on 5q and identification of a 5q- breakpoint. Genomics. 19:425–432. 10.1006/geno.1994.1090 - DOI - PubMed

Publication types