

HLA supertype variation across populations: new insights into the role of natural selection in the evolution of HLA-A and HLA-B polymorphisms
- PMID: 26459025
- PMCID: PMC4636516
- DOI: 10.1007/s00251-015-0875-9
HLA supertype variation across populations: new insights into the role of natural selection in the evolution of HLA-A and HLA-B polymorphisms
Abstract
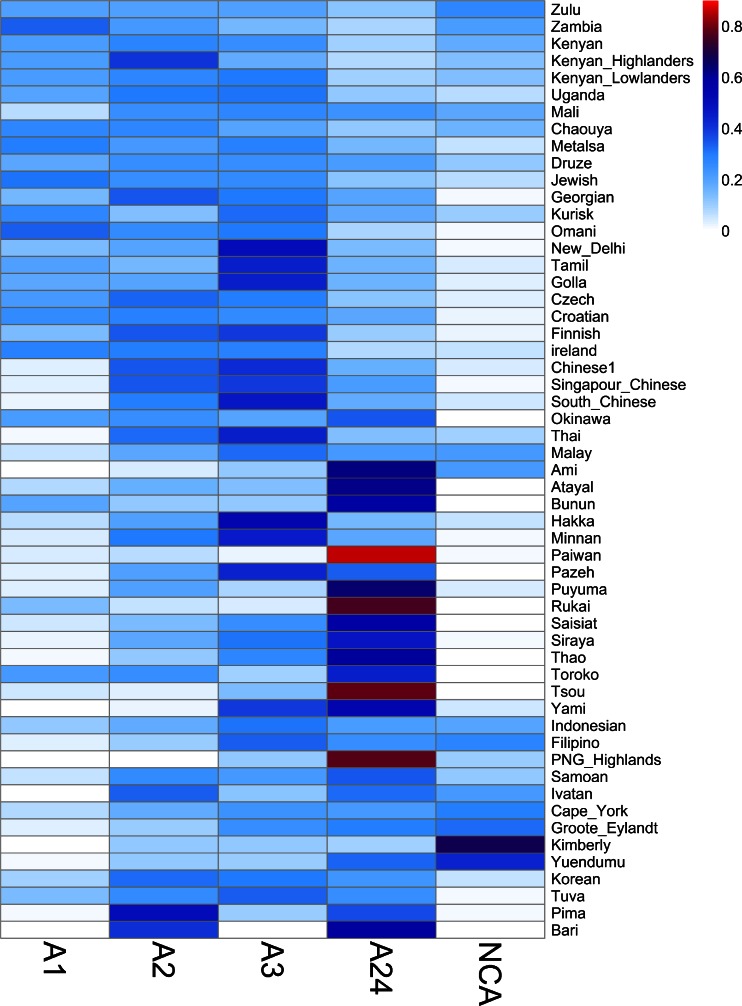
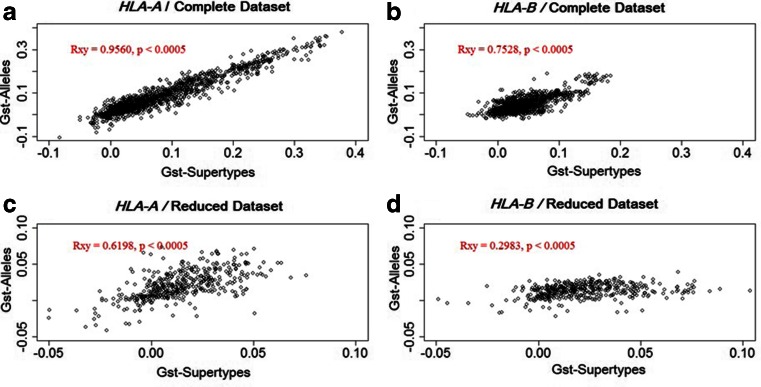
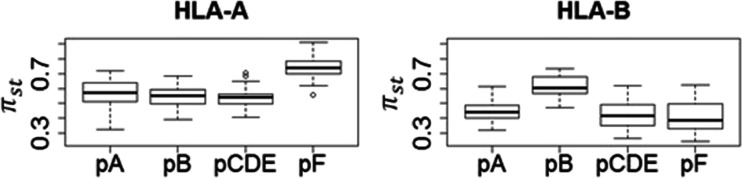
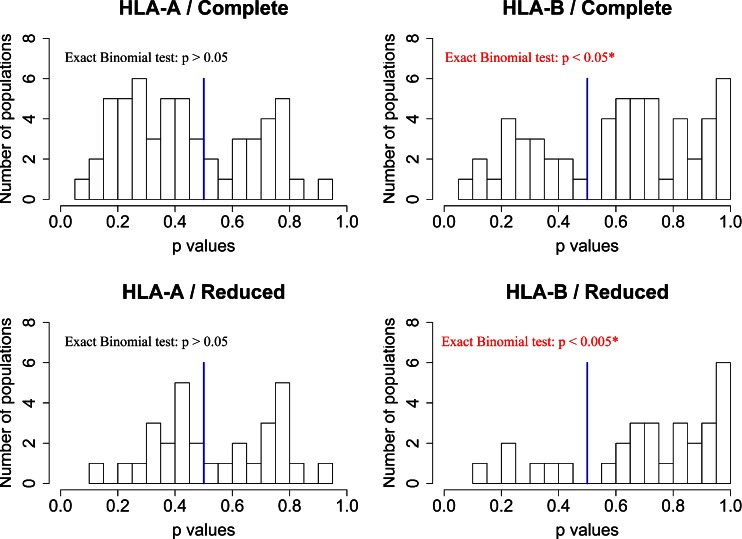
Supertypes are groups of human leukocyte antigen (HLA) alleles which bind overlapping sets of peptides due to sharing specific residues at the anchor positions-the B and F pockets-of the peptide-binding region (PBR). HLA alleles within the same supertype are expected to be functionally similar, while those from different supertypes are expected to be functionally distinct, presenting different sets of peptides. In this study, we applied the supertype classification to the HLA-A and HLA-B data of 55 worldwide populations in order to investigate the effect of natural selection on supertype rather than allelic variation at these loci. We compared the nucleotide diversity of the B and F pockets with that of the other PBR regions through a resampling procedure and compared the patterns of within-population heterozygosity (He) and between-population differentiation (G ST) observed when using the supertype definition to those estimated when using randomized groups of alleles. At HLA-A, low levels of variation are observed at B and F pockets and randomized He and G ST do not differ from the observed data. By contrast, HLA-B concentrates most of the differences between supertypes, the B pocket showing a particularly high level of variation. Moreover, at HLA-B, the reassignment of alleles into random groups does not reproduce the patterns of population differentiation observed with supertypes. We thus conclude that differently from HLA-A, for which supertype and allelic variation show similar patterns of nucleotide diversity within and between populations, HLA-B has likely evolved through specific adaptations of its B pocket to local pathogens.
Keywords: Adaptation; HLA; Human populations; Natural selection; Pathogens; Supertypes.
Figures


Similar articles
-
Degenerate cytotoxic T cell epitopes from P. falciparum restricted by multiple HLA-A and HLA-B supertype alleles.Immunity. 1997 Jul;7(1):97-112. doi: 10.1016/s1074-7613(00)80513-0. Immunity. 1997. PMID: 9252123
-
Nine major HLA class I supertypes account for the vast preponderance of HLA-A and -B polymorphism.Immunogenetics. 1999 Nov;50(3-4):201-12. doi: 10.1007/s002510050594. Immunogenetics. 1999. PMID: 10602880 Review.
-
Presence of strong association of the major histocompatibility complex (MHC) class I allele HLA-A*26:01 with idiopathic hypoparathyroidism.J Clin Endocrinol Metab. 2012 Sep;97(9):E1820-4. doi: 10.1210/jc.2012-1328. Epub 2012 Jun 20. J Clin Endocrinol Metab. 2012. PMID: 22723329
-
HLA class I variation in Iranian Lur and Kurd populations: high haplotype and allotype diversity with an abundance of KIR ligands.HLA. 2016 Sep;88(3):87-99. doi: 10.1111/tan.12852. Epub 2016 Aug 24. HLA. 2016. PMID: 27558013 Free PMC article.
-
A framework to sub-type HLA supertypes.Front Biosci. 2005 Jan 1;10:879-86. doi: 10.2741/1582. Print 2005 Jan 1. Front Biosci. 2005. PMID: 15569626 Review.
Cited by
-
Vaccine design based on 16 epitopes of SARS-CoV-2 spike protein.J Med Virol. 2021 Apr;93(4):2115-2131. doi: 10.1002/jmv.26596. Epub 2020 Nov 1. J Med Virol. 2021. PMID: 33091154 Free PMC article.
-
A Novel Orf Virus D1701-VrV-Based Dengue Virus (DENV) Vaccine Candidate Expressing HLA-Specific T Cell Epitopes: A Proof-of-Concept Study.Biomedicines. 2021 Dec 8;9(12):1862. doi: 10.3390/biomedicines9121862. Biomedicines. 2021. PMID: 34944678 Free PMC article.
-
Fine scale human genetic structure in three regions of Cameroon reveals episodic diversifying selection.Sci Rep. 2021 Jan 13;11(1):1039. doi: 10.1038/s41598-020-79124-1. Sci Rep. 2021. PMID: 33441574 Free PMC article.
-
High resolution class I HLA-A, -B, and -C diversity in Eastern and Southern African populations.Sci Rep. 2025 Jul 2;15(1):23667. doi: 10.1038/s41598-025-06704-4. Sci Rep. 2025. PMID: 40603473 Free PMC article.
-
Association of serum 25-hydroxyvitamin D concentration with HLA-B, -DRB1 and -DQB1 genetic polymorphisms.Eur J Clin Nutr. 2017 Jan;71(1):128-131. doi: 10.1038/ejcn.2016.160. Epub 2016 Sep 14. Eur J Clin Nutr. 2017. PMID: 27623983
References
-
- Chakraborty S, Rahman T, Chakravorty R, Kuchta A, Rabby A, Sahiuzzaman M. HLA supertypes contribute in HIV type 1 cytotoxic T lymphocyte epitope clustering in Nef and Gag proteins. AIDS Res Hum Retroviruses. 2013;29(2):270–278. - PubMed
Publication types
MeSH terms
Substances
LinkOut - more resources
Full Text Sources
Other Literature Sources
Research Materials
