. 2015 Nov 27;290(48):28869-86.
doi: 10.1074/jbc.M115.679969. Epub 2015 Oct 12.

The Solution Structure of the Lantibiotic Immunity Protein NisI and Its Interactions with Nisin

Affiliations

The Solution Structure of the Lantibiotic Immunity Protein NisI and Its Interactions with Nisin

Carolin Hacker et al. J Biol Chem. .

Abstract

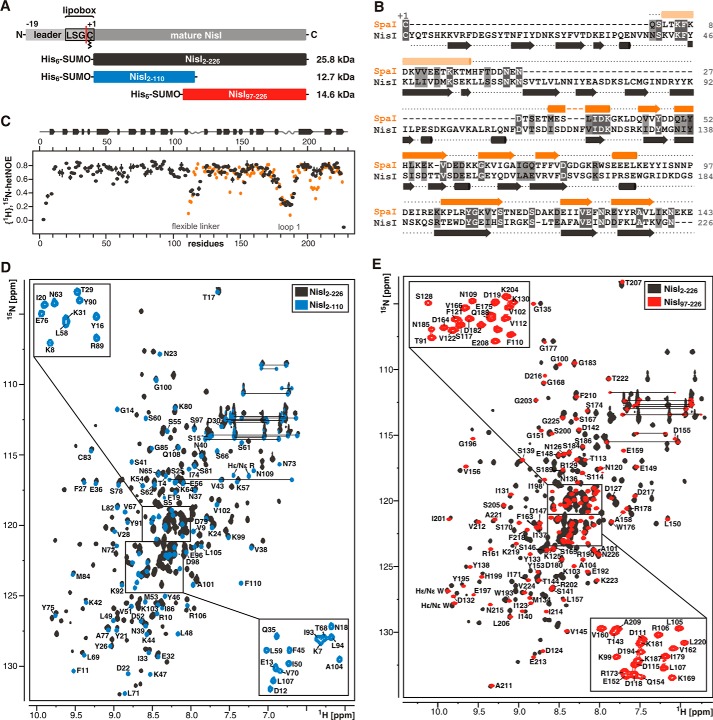
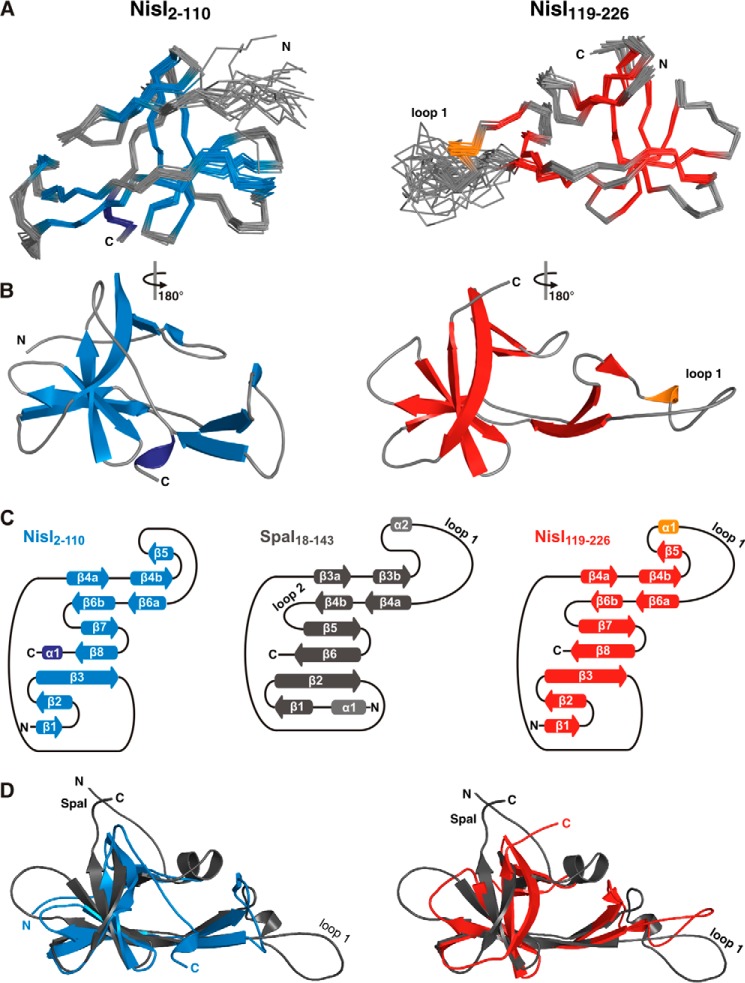
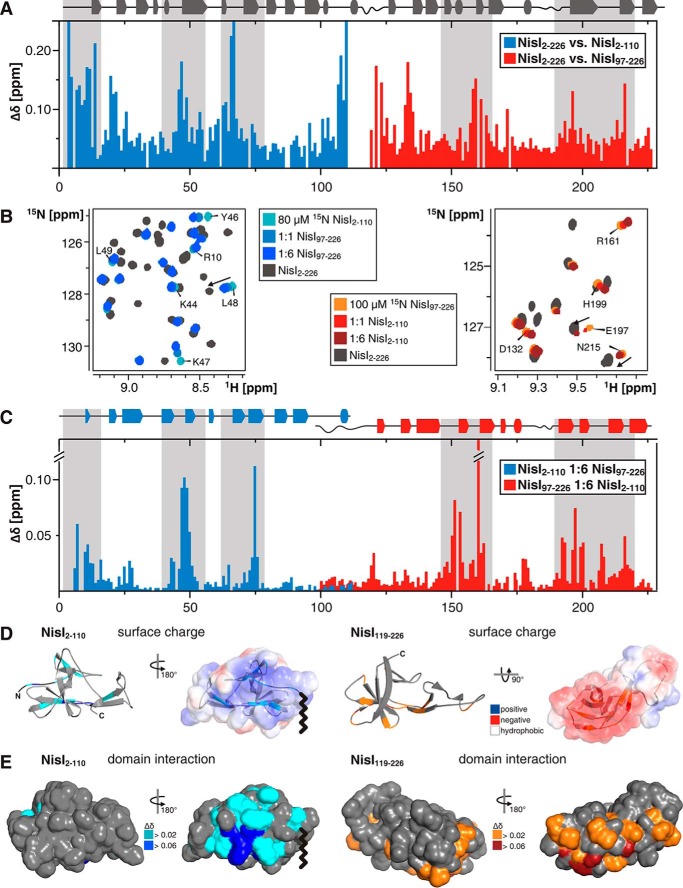
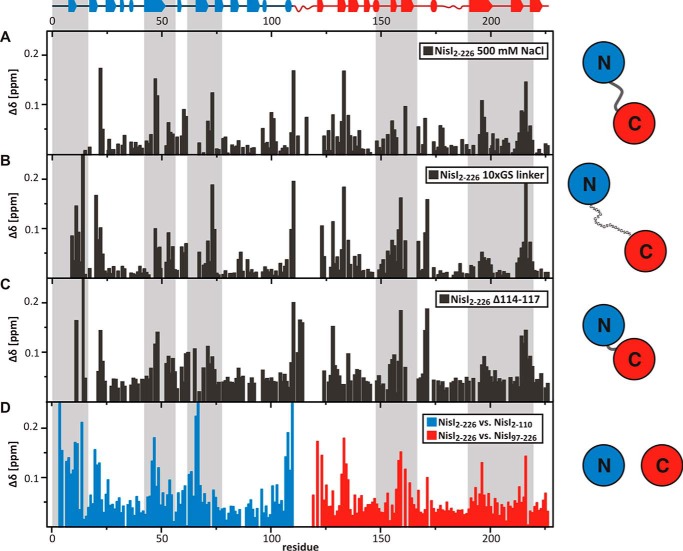
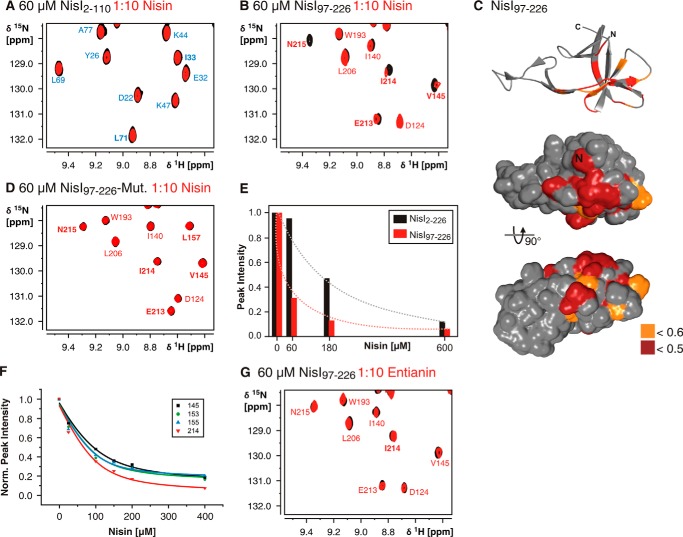
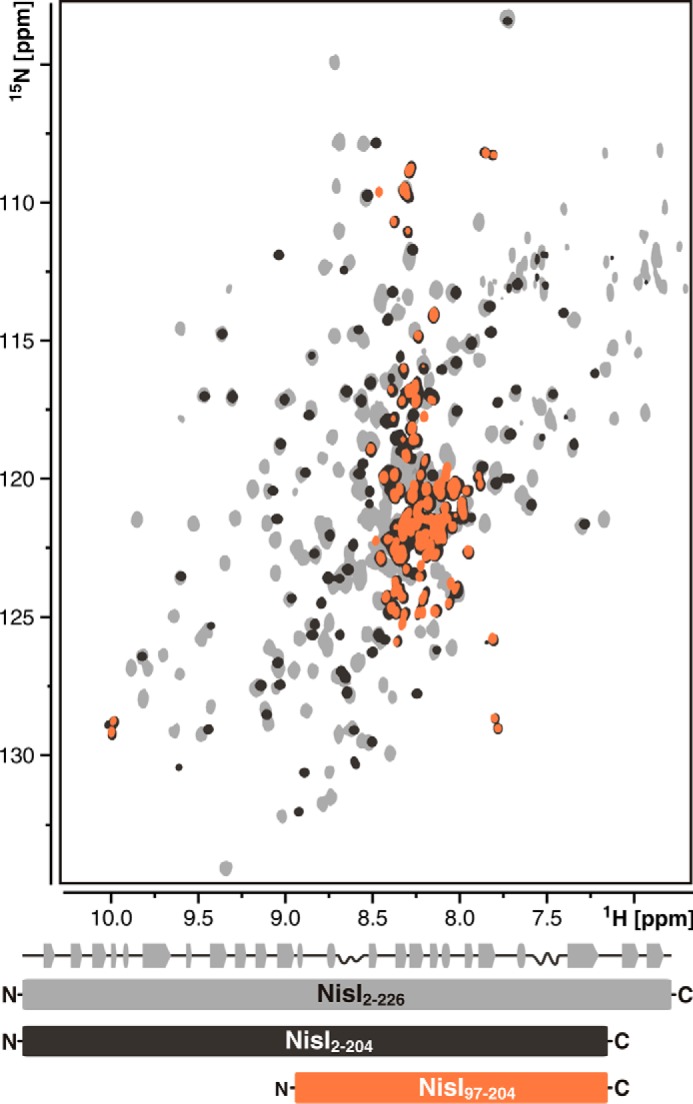
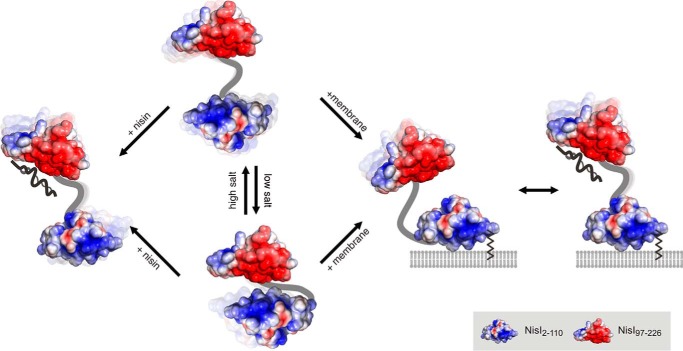
Many Gram-positive bacteria produce lantibiotics, genetically encoded and posttranslationally modified peptide antibiotics, which inhibit the growth of other Gram-positive bacteria. To protect themselves against their own lantibiotics these bacteria express a variety of immunity proteins including the LanI lipoproteins. The structural and mechanistic basis for LanI-mediated lantibiotic immunity is not yet understood. Lactococcus lactis produces the lantibiotic nisin, which is widely used as a food preservative. Its LanI protein NisI provides immunity against nisin but not against structurally very similar lantibiotics from other species such as subtilin from Bacillus subtilis. To understand the structural basis for LanI-mediated immunity and their specificity we investigated the structure of NisI. We found that NisI is a two-domain protein. Surprisingly, each of the two NisI domains has the same structure as the LanI protein from B. subtilis, SpaI, despite the lack of significant sequence homology. The two NisI domains and SpaI differ strongly in their surface properties and function. Additionally, SpaI-mediated lantibiotic immunity depends on the presence of a basic unstructured N-terminal region that tethers SpaI to the membrane. Such a region is absent from NisI. Instead, the N-terminal domain of NisI interacts with membranes but not with nisin. In contrast, the C-terminal domain specifically binds nisin and modulates the membrane affinity of the N-terminal domain. Thus, our results reveal an unexpected structural relationship between NisI and SpaI and shed light on the structural basis for LanI mediated lantibiotic immunity.

Keywords: antibiotic resistance; antibiotics; lantibiotic; lipoprotein; nisin binding; nuclear magnetic resonance (NMR); protein structure; small angle x-ray scattering.


Figures

FIGURE 1.
FIGURE 1.
NisI is a two-domain protein with a SpaI-like domain in its C-terminal half. A, schematic representation of the lipoprotein NisI and NMR constructs used in this study. NisI contains an N-terminal leader sequence for export across the cytoplasmic membrane followed by a lipobox motif where a diacylglyceryl moiety is covalently attached to the cysteine indicated. The red line indicates the cleavage site for the leader sequence. The NMR construct for full-length NisI starts at residue +2, where the +1 residue is the cysteine of the lipobox. B, sequence alignment of SpaI and NisI. Identical residues are highlighted with dark gray boxes and residues with similar chemical properties are shown in light gray boxes. The secondary structure based on chemical shift analysis for both proteins is indicated above and below the sequence with arrows representing β-sheets and cylinders α-helices. C, {1H},15N-hetNOE values for backbone amide groups of NisI-(2–226) in gray and SpaI-(18–143) in orange. The secondary structure of NisI is indicated above. D and E show overlays of the 15N-TROSY-HSQC spectra of NisI-(2–226) in gray and the 15N-HSQC spectra of NisI-(2–110) in blue (D) and NisI-(97–226) in red (E), respectively.
FIGURE 2.
FIGURE 2.
Both domains of NisI have a SpaI-like three-dimensional structure. A, backbone traces of the 19 lowest energy conformers and the regularized mean structure for NisI-(2–110) (left) and NisI-(119–226) (right). β-Sheets are shown in blue for NisI-(2–110) and red for NisI-(119–226). α-Helices are shown in dark blue for NisI-(2–110) and orange for NisI-(119–226). B, schematic representations of the energy minimized mean structures of Nis-(2–110) (left) and NisI-(119–226) (right) with the same color-coding as in A. C, schematic representation of the secondary structure of NisI-(2–110) (left), SpaI (middle), and NisI-(119–226) (right) with arrows representing β-sheets and cylinders representing α-helices. D, superpositions of the mean structure of SpaI colored gray with the mean structures of NisI-(2–110) (blue, left) and NisI-(119–226) (red, right).
FIGURE 3.
FIGURE 3.
Interdomain interactions in NisI. A, histogram of the measured amide backbone 1H,15N chemical shift differences between full-length NisI (NisI-(2–226)) and the isolated N-terminal (NisI-(2–110)) and C-terminal (NisI-(97–226)) domains. The secondary structure for full-length NisI is indicated by arrows and tubes atop of the histogram. B, overlay of a part of the 15N-HSQC spectra of 80 μm 15N-labeled NisI-(2–110) (left) and 100 μm 15N-labeled NisI-(97–226) (right) in the absence (light blue and light red) and presence of increasing amounts of the other domain in its unlabeled form. The molar ratios of the two domains are 1:1 (blue and red) and 1:6 (dark blue and dark red). The 15N-TROSY-HSQC of full-length NisI is shown in gray for comparison. Signals of residues of the individual domains, which move toward the chemical shift of the same residue in the full-length protein are indicated with arrows. C, histogram of the chemical shift differences of NisI-(2–110) (blue) and NisI-(97–226) (red) upon addition of a 6-fold molar excess of the other domain in its unlabeled form. D and E, show the chemical shift changes of NisI-(2–110) and NisI-(97–226) upon addition of the other unlabeled domain in 6-fold excess mapped either onto the schematic representation (D) or a solvent accessible surface representation (E) of the structure of NisI-(2–110) (left) and NisI-(119–226) (right) in two different orientations. For comparison, D also shows the electrostatic surface potentials of each domain mapped on the solvent accessible surfaces of each domain with negatively charged surface areas colored in red, positively charged areas colored in blue and white areas corresponding to hydrophobic surfaces. A wavy line indicates the approximate position of the diacylglycerol anchor connected to the cysteine of the lipobox in membrane bound NisI. The orientation of the electrostatic surface maps in D correspond to the orientation of the chemical shift maps shown on the right-hand side in each panel in E.
FIGURE 4.
FIGURE 4.
Chemical shift differences between full-length NisI (WT) in NMR buffer (100 mm NaCl) and full-length NisI (WT) in buffer containing 500 mm NaCl (A) or NisI constructs with either an extended 10xGS linker insertion (B) or with a truncated linker (C). For comparison, D shows the chemical shift differences between full-length NisI and the two isolated domains as shown in Fig. 3A and serves as a reference. Gray boxes highlight residues involved in interdomain interactions.
FIGURE 5.
FIGURE 5.
A dynamic global conformation of full-length NisI in solution as seen by SAXS. A, raw SAXS scattering data for NisI-(2–226) at three different salt concentrations and measured for three different protein concentrations under each condition as indicated. The insets show the corresponding Guinier plots, which demonstrate the absence of protein aggregation. B, SAXS curves show an extension of NisI at higher salt concentrations. SAXS data showing a comparison of the experimental radial density distributions of NisI with increasing salt concentrations as indicated. C and D, salt-dependent changes in the conformational ensemble of NisI. Rg (C) and Dmax (D) distributions of the ensemble optimization method models of full-length NisI at 25 and 500 mm NaCl in the initial pool of structures with randomized interdomain linkers (gray lines) and in the ensembles selected to represent the experimental data (solid and dashed black lines).
FIGURE 6.
FIGURE 6.
Changes in the global conformation in NisI linker mutants NisI-(2–226)-10xGS and NisI-(2–226)-Δ114–117. A, raw SAXS scattering data for both NisI linker mutants at three different protein concentrations recorded at a NaCl concentration of 100 mm. The insets show the corresponding Guinier plots. B, comparison of the experimental radial density distributions of the two NisI linker mutants with WT-NisI.
FIGURE 7.
FIGURE 7.
The interaction of NisI with membranes. A, NMR signal intensity changes in 15N-TROSY-HSQC spectra of full-length NisI after addition of liposomes in increasing concentrations mapped onto its sequence. Missing data points correspond to prolines or overlapping signals. Blue and red lines correspond to the average intensity changes observed for the N-terminal (blue) and the C-terminal (red) domain, respectively. B, SDS-PAGE analysis of the liposome floating assay for either full-length NisI (top) or the isolated N-terminal (middle) and C-terminal (bottom) domains. Lanes 1–6 correspond to fractions from the top (fraction 1) to the bottom (fraction 6) of the gradient after ultracentrifugation. Fractions 1 and 2 contain floated liposomes. Lane R corresponds to the protein-liposome mixture before ultracentrifugation as a reference.
FIGURE 8.
FIGURE 8.
Nisin binding of full-length NisI. A, overlay of a part of the 15N-TROSY-HSQC spectra of NisI-(2–226) in the absence (black) or presence of a 10-fold molar excess of nisin (red). Nisin binding causes a reduction in signal intensities in agreement with complex formation in intermediate exchange on the NMR time scale. Assignments for residues in the N-terminal domain are indicated in blue and assignments for residues of the C-terminal domain are indicated in red. The residues showing intensity changes are mapped onto the structure of the N-terminal domain (B) or the C-terminal domain (C). Large intensity changes with a relative intensity in the bound state of <0.5 are highlighted in darker colors, unaffected residues are colored gray. D, raw SAX scattering data for NisI-(2–226) in nisin titration buffer at three different concentrations and NisI-(2–226) (70 μm) upon addition of a 4-fold excess of nisin. The corresponding Guinier plots are shown as insets. E, a comparison of the experimental radial density distributions of NisI in the absence and presence of nisin.
FIGURE 9.
FIGURE 9.
Nisin binds to the isolated C-terminal domain of NisI (NisI-(97–226)). A, the isolated N-terminal domain of NisI (NisI-(2–110)) is not interacting with nisin. An overlay of 15N-HSQC spectra of the domain in the absence (black) and presence of a 10-fold molar excess of nisin shows no differences. B, an overlay of 15N-HSQC spectra of the isolated C-terminal domain in the absence (black) and presence of a 10-fold molar excess of nisin shows clear differences in a number of peak intensities indicative of nisin binding. C, mapping of the NMR signal intensity changes in 15N-HSQC spectra upon nisin addition to the isolated NisI C-terminal domain onto the solvent accessible surface map that is shown in the same orientations as in Fig. 8C. D, the NisI C-terminal domain double mutant Y153A,D155K has lost the ability to bind nisin. No changes in the 15N-HSQC spectra are observable upon addition of nisin. E, comparison of the NMR signal intensity changes for residue Tyr-153 as a function of nisin concentration in full-length NisI (black bars) and the isolated C-terminal domain (red bars). F, determination of the KD for the interaction of the NisI C-terminal domain for nisin by plotting the NMR signal intensities for exemplary residues in the nisin binding site as indicated as a function of nisin concentration. G, the C-terminal domain of NisI does not bind to the subtilin variant entianin as seen from an overlay of the 15N-HSQC spectra of the C-terminal domain in the absence (black) and presence (red) of a 10-fold molar excess of entianin, which shows no chemical shift differences.
FIGURE 10.
FIGURE 10.
Deletion of the 22 C-terminal amino acid residues leads to unfolding of the C-terminal domain of NisI. Overlay of 15N-TROSY-HSQC spectra of full-length NisI (NisI-(2–226)) (light gray), the C-terminal deletion mutant of NisI (NisI-(2–204)) (black), and the C-terminal deletion mutant of the isolated C-terminal domain (NisI-(97–204)) (orange). A schematic representation of the secondary structure of full-length NisI is shown atop a schematic representation of the NMR constructs below the spectral overlay with the same color-coding as used for the spectra.
FIGURE 11.
FIGURE 11.
Model representation of the solution conformational ensemble of NisI in different functional states. Free NisI consists of a conformational ensemble with prevalent interdomain interactions at low salt concentrations. The membrane interaction and nisin binding surfaces of the N- and C-terminal domains are partially shielded in this state. At higher salt concentrations, more open conformations without interdomain interactions dominate the conformational ensemble. Nisin binding or membrane interactions compete with interdomain interactions and might thereby lead to conformational ensembles with reduced interdomain interactions.

References

    1. Klaenhammer T. R. (1988) Bacteriocins of lactic acid bacteria. Biochimie 70, 337–349 - PubMed
    1. Cotter P. D., Ross R. P., and Hill C. (2013) Bacteriocins: a viable alternative to antibiotics? Nat. Rev. Microbiol. 11, 95–105 - PubMed
    1. Dischinger J., Basi Chipalu S., and Bierbaum G. (2014) Lantibiotics: promising candidates for future applications in health care. Int. J. Med. Microbiol. 304, 51–62 - PubMed
    1. Arnison P. G., Bibb M. J., Bierbaum G., Bowers A. A., Bugni T. S., Bulaj G., Camarero J. A., Campopiano D. J., Challis G. L., Clardy J., Cotter P. D., Craik D. J., Dawson M., Dittmann E., Donadio S., Dorrestein P. C., Entian K.-D., Fischbach M. A., Garavelli J. S., Göransson U., Gruber C. W., Haft D. H., Hemscheidt T. K., Hertweck C., Hill C., Horswill A. R., Jaspars M., Kelly W. L., Klinman J. P., Kuipers O. P., Link A. J., Liu W., Marahiel M. A., Mitchell D. A., Moll G. N., Moore B. S., Müller R., Nair S. K., Nes I. F., Norris G. E., Olivera B. M., Onaka H., Patchett M. L., Piel J., Reaney M. J., Rebuffat S., Ross R. P., Sahl H.-G., Schmidt E. W., Selsted M. E., Severinov K., Shen B., Sivonen K., Smith L., Stein T., Süssmuth R. D., Tagg J. R., Tang G.-L., Truman A. W., Vederas J. C., Walsh C. T., Walton J. D., Wenzel S. C., Willey J. M., and van der Donk W. A. (2013) Ribosomally synthesized and post-translationally modified peptide natural products: overview and recommendations for a universal nomenclature. Nat. Prod. Rep. 30, 108–160 - PMC - PubMed
    1. Schnell N., Entian K. D., Schneider U., Götz F., Zähner H., Kellner R., and Jung G. (1988) Prepeptide sequence of epidermin, a ribosomally synthesized antibiotic with four sulphide-rings. Nature 333, 276–278 - PubMed

Publication types

MeSH terms

LinkOut - more resources