. 2015 Nov 27;290(48):28932-43.
doi: 10.1074/jbc.M115.659912. Epub 2015 Oct 12.

Uncovering the Mechanism of Aggregation of Human Transthyretin

Affiliations

Uncovering the Mechanism of Aggregation of Human Transthyretin

Lorena Saelices et al. J Biol Chem. .

Abstract

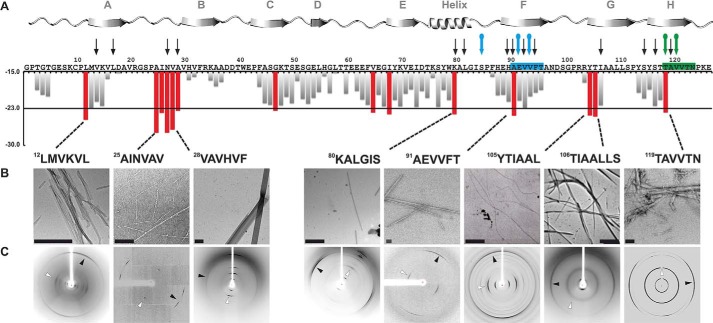
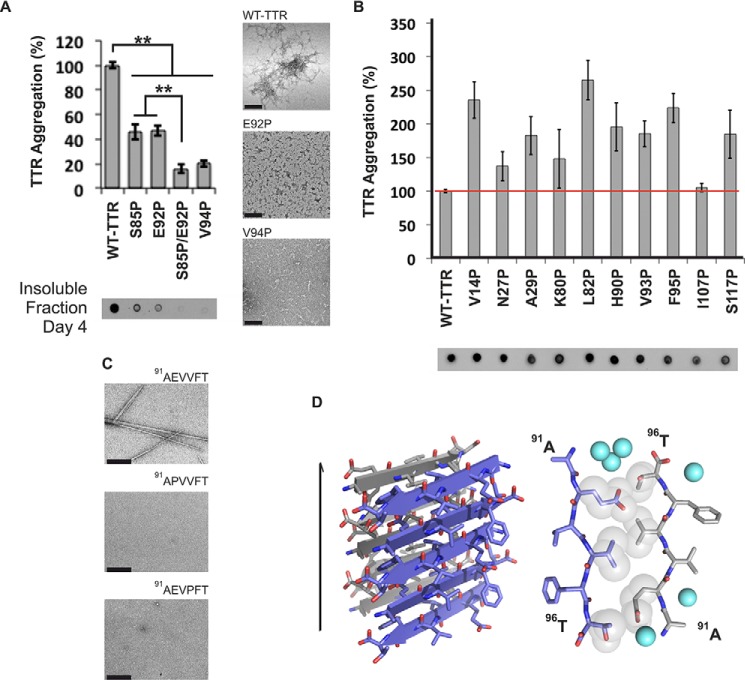
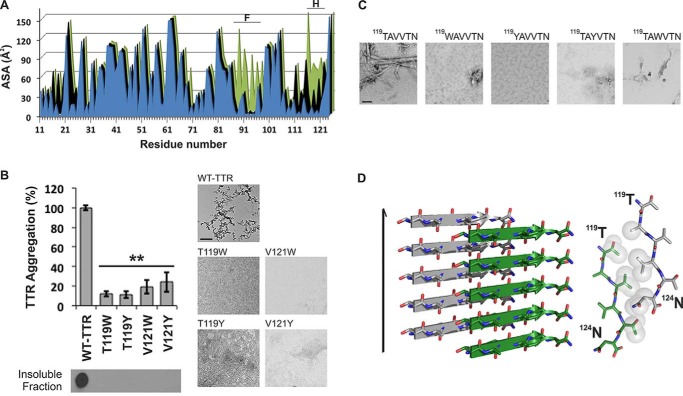
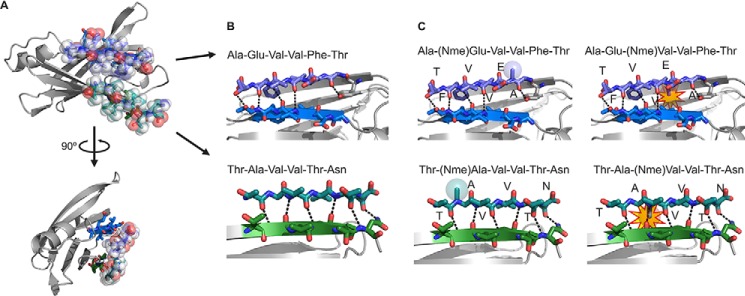
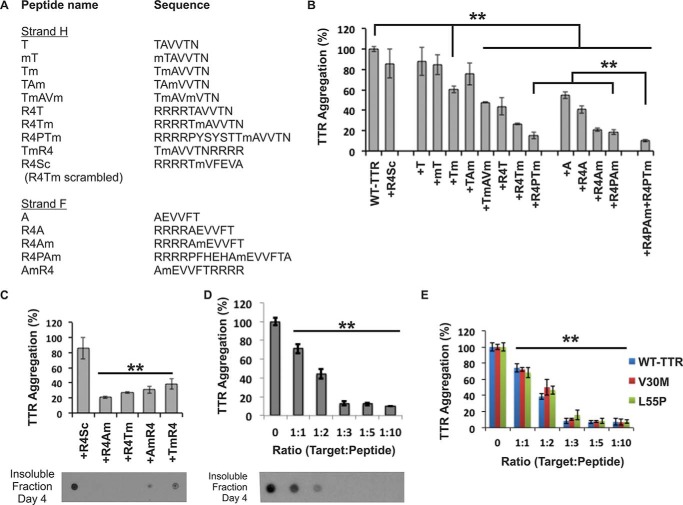
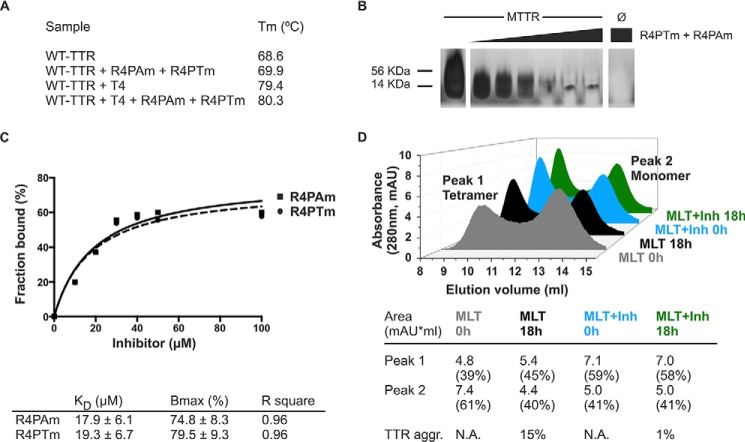
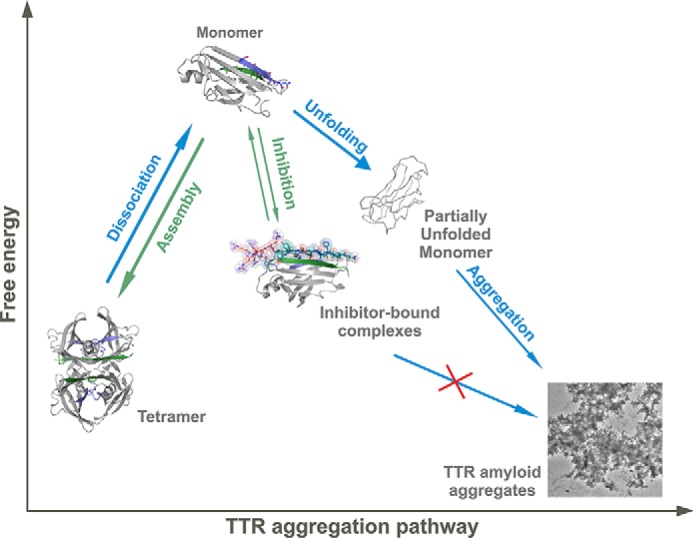
The tetrameric thyroxine transport protein transthyretin (TTR) forms amyloid fibrils upon dissociation and monomer unfolding. The aggregation of transthyretin has been reported as the cause of the life-threatening transthyretin amyloidosis. The standard treatment of familial cases of TTR amyloidosis has been liver transplantation. Although aggregation-preventing strategies involving ligands are known, understanding the mechanism of TTR aggregation can lead to additional inhibition approaches. Several models of TTR amyloid fibrils have been proposed, but the segments that drive aggregation of the protein have remained unknown. Here we identify β-strands F and H as necessary for TTR aggregation. Based on the crystal structures of these segments, we designed two non-natural peptide inhibitors that block aggregation. This work provides the first characterization of peptide inhibitors for TTR aggregation, establishing a novel therapeutic strategy.

Keywords: TTR; amyloid; inhibition mechanism; mutational analysis; peptide interaction; protein aggregation; transthyretin amyloidosis; x-ray crystallography.


Figures

FIGURE 1.
FIGURE 1.
Identifying amyloidogenic segments in TTR. A, propensities of steric zipper formation of each 6-residue segment within the TTR sequence. Computationally predicted segments with steric zipper propensities are represented with red bars. The schematic of the secondary structure of native TTR is shown on top of the sequence. Black arrows mark residues where proline replacement did not hinder TTR aggregation. Blue arrows mark proline replacements that hindered TTR aggregation. The green arrow marks the mutation T119M, which protects TTR against fibril formation (58). The green and blue boxes highlight the segment sequences critical for TTR aggregation that we described in this study. B, TEM micrographs of the fibrils formed after 7 days of incubation (scale bar, 500 nm). C, amyloid x-ray cross-β diffraction pattern of the samples containing fibrils shown in B. The arrowheads point to the meridional reflection at 4.7–4.8-Å spacings (parallel to the fibril axis; black arrowheads) and equatorial reflections at ∼10-Å spacings (white arrowheads). Notice that all eight of the examined segments predicted to form amyloid fibrils do in fact form amyloid fibrils.
FIGURE 2.
FIGURE 2.
β-Strand F as an aggregation-driving segment in TTR suitable for aggregation inhibitor design. TTR aggregation of the protein variants that showed significant delay (A) and those that did not decrease protein aggregation (B) is shown. Those TTR proline variants that are not shown here were found to be insoluble. Histograms show percentage of TTR aggregation using WT TTR to normalize to 100%. The aggregation was measured by absorbance of the samples at 400 nm after 4 days of incubation at 37 °C and pH 4.3 with no shaking. The bottom panel shows a His probe dot blot of the insoluble fraction corresponding to the sample above after solubilization with guanidinium hydrochloride. On the right are TEM micrographs of protein aggregates (scale bar, 100 nm) after 7 days of incubation. Notice that the proline substitutions within or next to β-strand F hindered TTR aggregation. Several of the other proline substitutions enhanced aggregation; these, like ATTR familial mutations, may alter native structure and/or protein stability (8). Error bars represent S.D., and ** symbolizes a p value ≤0.003 (n = 3). C, TEM micrographs of peptides in isolation after 7 days of incubation in PBS with no shaking (scale bar, 500 nm). D, crystal structure of the segment 91AEVVFT96 from β-strand F forming a Class-7 steric zipper. One sheet is shown as blue; the other is shown as gray. On the left is a lateral view of the fibril with the fibril axis shown by the narrow black arrow. On the right is the view down the fibril axis showing two β-sheets in projection. Water molecules are shown as aquamarine spheres. Spheres represent the van der Waals radii of the side chain atoms of the tightly packed fibril core.
FIGURE 3.
FIGURE 3.
β-Strand H as a second aggregation-driving segment suitable as a target for aggregation inhibitor design. A, residue solvent-accessible surface area (ASA; Å2) of TTR was calculated by Areaimol using the structure of WT TTR in three different conformations: tetramer (blue), dimer (black), and monomer (green). Notice that the strands F and H are indeed more exposed when TTR is in a monomeric form. 5.7% of the surface of the amyloidogenic segment 91AEVVFT96 is solvent-exposed in the tetramer, 5.7% is exposed in the dimer, and 32.1% is exposed in the monomer. Additionally, the amyloidogenic segment 119TAVVTN124 from strand H is 27.4% solvent-exposed in the tetramer, 43.4% solvent-exposed in the dimer, and 55.3% solvent-exposed in the monomer. B, TTR aggregation of variants with substitutions on strand H. The histogram at the top shows the percentage of TTR aggregation after 4 days of incubation measured by absorbance at 400 nm with WT aggregation normalized to 100%. Below, a His probe dot blot shows the insoluble fraction of the samples after 4 days of incubation and solubilization with guanidinium hydrochloride. Bottom panels, TEM images from the samples after 7 days of incubation. These show that the substitutions of residues Thr119 and Val121 did indeed hinder protein aggregation. Error bars represent S.D., and ** symbolizes a p value ≤0.003 (n = 3). C, TEM micrographs of peptides in isolation after 7 days of incubation in PBS with no shaking (scale bar, 500 nm). D, crystal structure of the segment 119TAVVTN124 from β-strand H forming a Class-2 steric zipper. One sheet of the zipper is gray; the other is green. On the left is a lateral view of the fibril with the fibril axis indicated by the narrow black arrow. On the right is the view down the fibril axis showing two β-sheets in projection. Spheres represent the van der Waals radii of the side chain atoms of the tightly packed fibril core.
FIGURE 4.
FIGURE 4.
Design of sequence-specific peptide inhibitors of TTR aggregation. A, computational docking model of the peptides AEVVFT and TAVVTN bound to strands F (blue) and H (green), respectively, of the TTR monomer. Peptides are shown with translucent spheres representing van der Waals radii; the TTR monomer is shown as ribbons with side chains of strands F and H as sticks. B, lateral, close-up view of the F and H strands in the docking model showing the designed pattern of hydrogen bonding (dashed lines) between the peptides (sticks) and the TTR β-strands (ribbon with sticks). C, docking models of N-methylated peptides predict which will bind TTR (same view as B). N-Methylations were added to increase peptide solubility, reduce aggregation, and reduce sensitivity. Colored spheres represent the van der Waals radii of the N-methyl groups (Nme) in favorable positions; yellow stars highlight clashes of the N-methyl modifications with the TTR monomer.
FIGURE 5.
FIGURE 5.
Designed peptides are sequence-specific inhibitors of TTR aggregation. A, list of inhibiting peptides tested as TTR aggregation inhibitors. B–E, evaluation of the peptide inhibitors. The graphs show the percentage of TTR aggregation after 4 days of incubation in the presence or absence of peptide inhibitor measured by absorbance at 400 nm; WT inhibition-free aggregation was normalized to 100%. The initial concentration of soluble TTR was 1 (B–D) or 0.2 mg/ml, which corresponds to the concentration of TTR in plasma (E). The molar excess of peptide inhibitor over target (TTR monomer) is 3-fold unless labeled otherwise. In C and D, a His probe dot blot shows the insoluble fraction of the samples after 4 days of incubation and solubilization with guanidinium hydrochloride. B, initial screening of inhibitors showing that three modifications significantly improved the effectiveness: (i) increasing the length of the matched sequence of the peptide and the target, (ii) addition of a charged tag, and (iii) addition of an N-methyl group in positions predicted to be favorable by the docking model (Fig. 4C). The two best inhibitors of TTR aggregation were R4PAm and R4PTm. C, the peptide inhibitors are more effective with the charged tag at the N terminus than at the C terminus. D, dose-dependent effectiveness of the peptides R4PAm and R4PTm in combination. Maximal inhibition of TTR aggregation is reached when the target to peptide molar ratio is 1:3. E, aggregation assay of the familial mutants V30M and L55P in the presence of R4PAm and R4PTm in combination using a physiological concentration of protein (3.6 μm). Error bars represent S.D. (n = 3), and ** symbolizes a p value ≤0.003.
FIGURE 6.
FIGURE 6.
Analysis of the mechanism of action of the TTR inhibitors. A, midpoint temperatures of the thermal unfolding transition (Tm) of wild-type TTR at different conditions were determined by differential scanning calorimetry. Relative stability is compared in the presence and absence of a 5:1 molar ratio of T4 and/or the combination of R4PAm and R4PTm to TTR monomer. The TTR concentration was 1 mg/ml. Notice that the addition of the natural ligand T4 increased the protein thermostability by 10.8 °C. The addition of the peptide inhibitors increased it only by 1.3 °C in the absence of T4 and by 0.9 °C when the ligand was present. B, inhibition of oligomer formation of MTTR after incubation with R4PTm and R4PAm. A fixed amount of MTTR (0.5 mg/ml) was incubated in the presence of increasing concentrations of TTR inhibitors (0–5-fold excess) and subjected to non-denaturing electrophoresis. The sizes of His-tagged TTR monomer (14 kDa) and tetramer (56 kDa) are shown next to the gel. R4PTm and R4PAm inhibited MTTR oligomer formation in a dose-dependent manner. C, fraction of the inhibitors R4PAm (solid line, squares) and R4PTm (dashed line, circles) bound to MTTR. The soluble fraction of the samples was collected after ultracentrifugation followed by acid precipitation of soluble MTTR and inhibitor-bound complexes. The unbound fraction of inhibitors was analyzed by HPLC-MS. One-site specific binding analysis was performed using GraphPad Prism 6 to calculate binding parameters KD as apparent binding affinity and Bmax as maximum bound fraction. D, analysis of tetrameric and monomeric populations of MLT after incubation with TTR inhibitors. Size exclusion chromatography of MLT reveals that the presence of TTR inhibitors does not drive the protein equilibrium to populate the monomeric species. In contrast, an increase of tetrameric species was found after incubation with inhibitors (Inh). TTR aggregation (TTR agg.) was measured by absorbance at 400 nm with the initial protein amount normalized to 100%. mAU, milli-absorbance units; N.A., not applicable.
FIGURE 7.
FIGURE 7.
Model of peptide-based inhibition of TTR aggregation. The low free energy of TTR amyloid fibrils drives aggregation with TTR dissociation providing a kinetic barrier (4). The inhibitors do not affect stability of the TTR tetramer but bind to intermediate species, hindering unfolding and aggregation. Although the inhibitor-bound complex is more stable than the free monomer, it is less stable than the tetramer, thereby favoring tetramer reassembly. Note that in this scheme the hydrophobic pocket of the tetramer remains accessible for complementary treatment with a stabilizer compound such as tafamidis or diflunisal (10, 49).

Similar articles

Cited by

References

    1. Chung C. M., Connors L. H., Benson M. D., and Walsh M. T. (2001) Biophysical analysis of normal transthyretin: implications for fibril formation in senile systemic amyloidosis. Amyloid 8, 75–83 - PubMed
    1. Westermark P., Sletten K., Johansson B., and Cornwell G. G. 3rd (1990) Fibril in senile systemic amyloidosis is derived from normal transthyretin. Proc. Natl. Acad. Sci. U.S.A. 87, 2843–2845 - PMC - PubMed
    1. Colon W., and Kelly J. W. (1992) Partial denaturation of transthyretin is sufficient for amyloid fibril formation in vitro. Biochemistry 31, 8654–8660 - PubMed
    1. Foss T. R., Wiseman R. L., and Kelly J. W. (2005) The pathway by which the tetrameric protein transthyretin dissociates. Biochemistry 44, 15525–15533 - PubMed
    1. Lai Z., Colón W., and Kelly J. W. (1996) The acid-mediated denaturation pathway of transthyretin yields a conformational intermediate that can self-assemble into amyloid. Biochemistry 35, 6470–6482 - PubMed

Publication types

Supplementary concepts