. 2015 Oct 12;211(1):39-51.
doi: 10.1083/jcb.201503017.

Inhibition of β-catenin-TCF1 interaction delays differentiation of mouse embryonic stem cells

Affiliations

Inhibition of β-catenin-TCF1 interaction delays differentiation of mouse embryonic stem cells

Sujash S Chatterjee et al. J Cell Biol. .

Abstract

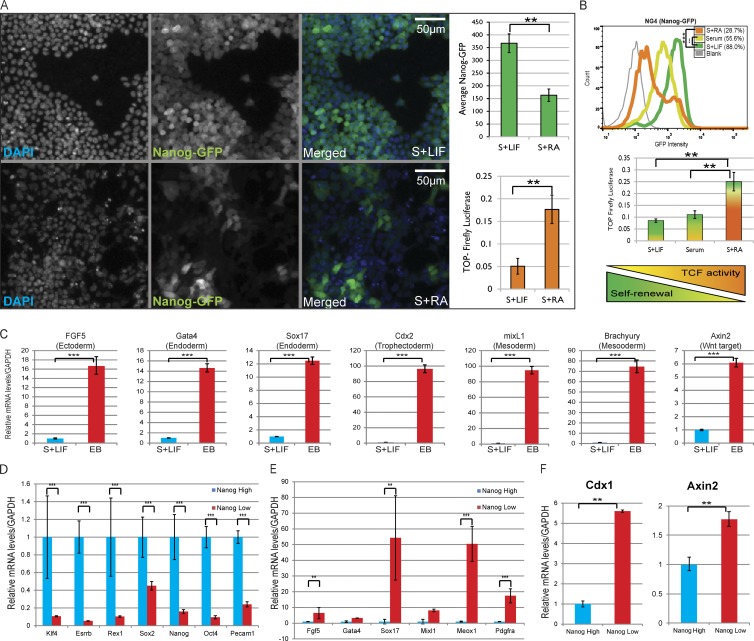
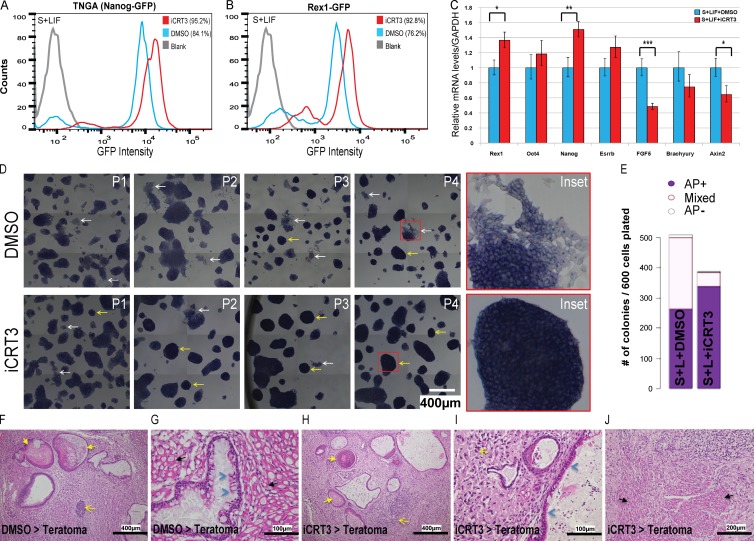
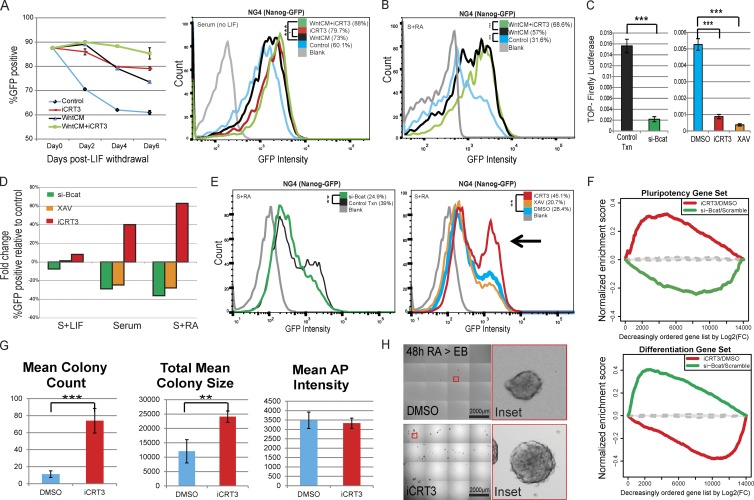
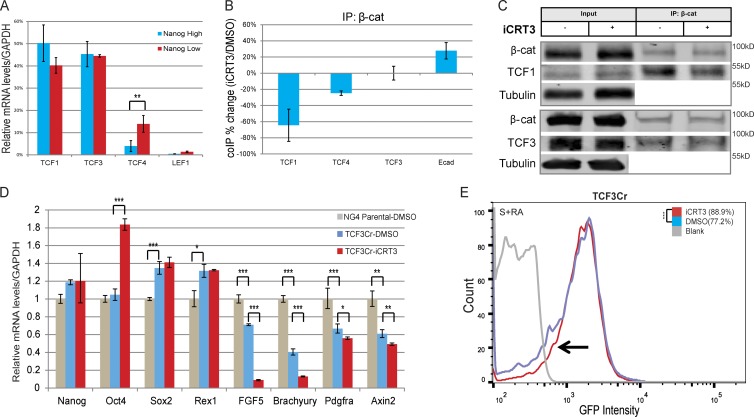
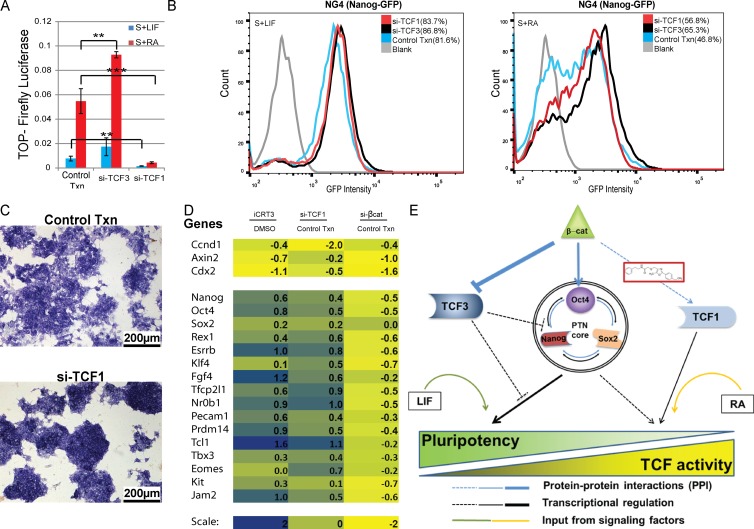
The ability of mouse embryonic stem cells (mESCs) to self-renew or differentiate into various cell lineages is regulated by signaling pathways and a core pluripotency transcriptional network (PTN) comprising Nanog, Oct4, and Sox2. The Wnt/β-catenin pathway promotes pluripotency by alleviating T cell factor TCF3-mediated repression of the PTN. However, it has remained unclear how β-catenin's function as a transcriptional activator with TCF1 influences mESC fate. Here, we show that TCF1-mediated transcription is up-regulated in differentiating mESCs and that chemical inhibition of β-catenin/TCF1 interaction improves long-term self-renewal and enhances functional pluripotency. Genetic loss of TCF1 inhibited differentiation by delaying exit from pluripotency and conferred a transcriptional profile strikingly reminiscent of self-renewing mESCs with high Nanog expression. Together, our data suggest that β-catenin's function in regulating mESCs is highly context specific and that its interaction with TCF1 promotes differentiation, further highlighting the need for understanding how its individual protein-protein interactions drive stem cell fate.


Figures

Figure 1.
Figure 1.
TCF-dependent transcriptional activation is up-regulated during mESC differentiation. (A) Mean Nanog-GFP levels (green bar graph; mean ± SD of four replicates) in NG4-TOPluc cells maintained in serum plus LIF (S+LIF; top) and serum plus RA (S+RA; bottom). Normalized TOPFlash reporter activity in simultaneously cultured NG4-TOPluc (orange bar graph; mean ± SD of three replicates). Resized original images shown are from a single representative experiment out of four replicates, with number of cells measured ≥1,000 per experiment. (B) Comparison of Nanog-GFP (by flow cytometry, top; representative data of three replicates) and transfected TOPFlash (middle; mean ± SD of three replicates) expression in mESCs cultured for 48 h in S+LIF, serum, or S+RA. Graphical summary reflecting inverse correlation between TCF-mediated transcriptional activity and self-renewal (bottom). (C) qPCR analysis of differentiation markers and TCF target genes in EBs versus the parental ESCs. Mean ± SD of three replicates. (D) Relative mRNA levels of pluripotency markers in sorted NanogHigh and NanogLow mESCs. Mean ± SD of two replicates. (E) Relative mRNA levels of differentiation markers in sorted NanogHigh and NanogLow mESCs. Mean ± SD of two replicates. (F) Relative mRNA levels of TCF target genes Cdx1 (mean ± SD of two replicates) and Axin2 (mean ± SD of three replicates) in sorted NanogHigh (S+LIF) and NanogLow (S+RA) mESCs. **, P < 0.01; ***, P < 0.001.
Figure 2.
Figure 2.
Long-term inhibition of β-catenin/TCFmediated transcriptional activity enhances self-renewal of mESCs. (A and B) Flow cytometry of TNGA (Nanog reporter) (A) and Rex1-GFP (B) mESCs grown in serum plus LIF (S+LIF) with iCRT3 (14 d). Two independent experiments were set up with TNGA and Rex1-GFP cell lines. (C) qPCR analysis for pluripotency/differentiation markers and TCF target genes in cells maintained in iCRT3 for four passages. Mean ± SD of three replicates. (D) Representative bright-field images of mESCs maintained in S+LIF over multiple passages of iCRT3 treatment (P1–P4). Note that iCRT3-treated cells demonstrate lower spontaneous differentiation (white arrows and inset), more compact colony morphology, and higher AP expression (yellow arrows and inset), compared with DMSO. Resized original images and additional ×6 digitally magnified insets shown are from a single representative experiment (for NG4) out of three replicates for each of NG4 and Rex1-GFP cell lines. (E) Representative quantification of AP levels of colonies formed from E14Tg2A mESCs after iCRT3 treatment in stem conditions (S+LIF).These results are representative of identical experiments set up for two independent E14Tg2A and CBA cell lines. (F–J) Representative staining of teratomas derived from NG4 cells treated with DMSO (F and G) or iCRT3 (H–J). Detection of tissue derived from all three germ layers is suggestive of teratoma arising from pluripotent cells and is marked by keratin in lumen of cysts lined by squamous keratinized epithelium (ectoderm, yellow arrows), neoplastic neuronal tissue/neuron rosettes (ectoderm, yellow open arrows), cysts lined by single layer of cuboidal or pseudostratified columnar ciliated epithelium (endoderm, blue arrowheads), and skeletal muscles (mesoderm, black arrows). Resized original images provided by IMCB Histopathology Core (A*Star) are from a single representative experiment out of eight pairs of teratomas generated from cells treated with DMSO/iCRT3 for 14 d. Refer to Fig. S1 F for representative immunofluorescence staining of germ layer markers in teratoma generated from iCRT3-treated cells. *, P < 0.05; **, P < 0.01; ***, P < 0.001.
Figure 3.
Figure 3.
iCRT3 treatment allows mESCs to resist induced differentiation. (A) Flow cytometry analysis of Nanog-GFP cells maintained for 6 d (three passages) without LIF to assay the effect of iCRT3 relative to WntCM. (left) In the absence of LIF, WntCM (black) progressively promotes ESC differentiation, as suggested by loss of Nanog-GFP–positive population in contrast with cells maintained with WntCM plus iCRT3 (green) or iCRT3 alone (red). Mean ± SD of three replicates. (right) Histogram plot for Nanog-GFP levels for cells maintained without LIF for 6 d with or without WntCM and iCRT3. Representative data of three replicates. (B) Flow cytometry of mESCs treated with RA (48 h) revealed that cells maintained in WntCM with iCRT3 (green) showed reduced differentiation relative to those grown with WntCM alone (black). Representative data of three replicates. (C) Normalized TOPFlash activity shows a marked reduction in reporter expression upon treatment with si-β-cat, XAV939, or iCRT3. Mean ± SD of three replicates. (D) Bar graph depicting single representative data for fold changes in Nanog-GFP expression upon treatment with XAV939 (orange), si-β-cat (green), or specific inhibition of β-catenin/TCF–dependent transcription using iCRT3 (red) relative to controls (DMSO or Scramble siRNA). (E) Histogram plots depicting changes in Nanog-GFP levels upon loss of β-catenin by si-β-cat or XAV939, and specific inhibition of β-catenin/TCF–dependent transcriptional activity using iCRT3 during RA-induced differentiation. The arrowhead highlights the Nanog-GFP–positive cell population that resists differentiation in presence of iCRT3. Representative data of two replicates. (F) GSEA plots showing how mRNA expression in cells treated with iCRT3 or si-βcat correlates to statistically significant pluripotency and differentiation gene sets (Online supplemental material). Genes were ordered on the x axis by log2 fold changes for treatments of iCRT3 (relative to DMSO) or si-βcat (relative to control transfection) during RA-mediated differentiation. The range of GSEA curves generated by randomly selected gene sets is shown in gray (interquartile range based on 500 size-matched random gene sets). (G) Colony-forming efficiency (CFE) of cells precultured in RA with iCRT3 or DMSO for 48 h. After treatment, cells were plated in limiting dilutions back into serum plus LIF (S+LIF) without any inhibitors for an additional 48 h (please refer to schematic in Fig. S2 C). CFE quantified for mean colony count, colony area, and AP intensities. Mean ± SD of four replicates. (H) Representative resized bright-field images as well as ×10 digitally magnified insets of four replicates showing control mESCs exposed to serum plus RA with DMSO that produced fewer EBs (top) relative to the enhanced efficiency of those grown in serum plus RA with iCRT3 (bottom; please refer to schematic in Fig. S2 C). **, P < 0.01; ***, P < 0.001. FC, fold change; Txn, transfection.
Figure 4.
Figure 4.
iCRT3 delays mESC differentiation by inhibiting β-cateninTCF1 interaction independent of TCF3. (A) Bar graph showing relative mRNA levels for TCF/LEF factors from expression profiles of sorted NanogHigh and NanogLow mESCs, expressed as a percentage of the total pool of TCF/LEF transcripts. Mean ± SD of two replicates. (B) Bar graphs quantifying CoIP analysis from total cell lysate show the altered interactions of β-catenin in the presence of iCRT3 during RA-induced differentiation. Mean ± SD of three replicates. (C) Representative Western blots of three CoIP experiments from total cell lysates of differentiating cells (serum plus RA [S+RA]) maintained with iCRT3 for 48 h show that although β-catenin’s interaction with TCF1 is reduced relative to DMSO control, β-catenin/TCF3 complex formation is unchanged. Tubulin is used as loading control. (D) qPCR analysis of NG4 (parental line) and CRISPR-mediated TCF3-null cells maintained in RA-induced differentiating conditions (48 h) reveal reduced expression of differentiation markers after iCRT3 treatment. Mean ± SD of three replicates. (E) Flow cytometry of TCF3Cr mESCs during RA-induced differentiation reveal an increase in the Nanog-GFP–positive population of iCRT3-treated cells relative to the DMSO control. Representative data of three replicates. *, P < 0.05; **, P < 0.01; ***, P < 0.001.
Figure 5.
Figure 5.
Loss of TCF1 reduces mESC differentiation. (A) Normalized TOPFlash activity showing a marked reduction in reporter expression upon treatment with si-TCF1. Positive control cells treated with si-TCF3 have relatively higher TOPFlash activity. Mean ± SD of three replicates. (B) Flow cytometry of cells maintained in serum plus LIF (S+LIF; left) and serum + RA (S+RA; right) for 48 h, showing that similar to si-TCF3–treated cells, si-TCF1 tends to enhance Nanog-GFP expression. (C) Bright-field image showing that RNAi-mediated loss of TCF1 delays differentiation of RA-treated cells, as indicated by their higher AP expression and more compact colony morphology. Resized original images shown are from a single representative experiment out of three replicates. (D) Heat map plot showing relative mRNA expression levels of TCF target genes (top) and pluripotency-associated genes (bottom) upon iCRT3 treatment, or siRNA knockdown of TCF1 or β-catenin compared with DMSO or transfection of the Scrambled control, respectively. (E) Model depicting proposed mechanism for how the Wnt pathway regulates pluripotency and differentiation of mESCs. β-Catenin can alleviate the repressive effect of TCF3 on the transcriptional output of the PTN core, and it can also prevent TCF3 from binding to Oct4 and inhibiting transcription of pluripotency-associated genes. Our results suggest that β-catenin’s interaction with TCF1 activates transcription of differentiation promoting target genes. Although inhibition of β-catenin/TCF1 interaction by iCRT3 or loss of TCF1 does not affect β-catenin/TCF3 interaction, it reduces Wnt target gene expression and delays mESC differentiation. iCRT3 treatment also enhances the formation of β-catenin/Oct4 complex, which has been previously correlated to ground-state pluripotency. In addition, extrinsic signaling factors such as LIF and RA promote pluripotency and differentiation, respectively. **, P < 0.01; ***, P < 0.001. Txn, transfection.

References

    1. Anders S., and Huber W.. 2010. Differential expression analysis for sequence count data. Genome Biol. 11:R106 10.1186/gb-2010-11-10-r106 - DOI - PMC - PubMed
    1. Arnold S.J., Stappert J., Bauer A., Kispert A., Herrmann B.G., and Kemler R.. 2000. Brachyury is a target gene of the Wnt/beta-catenin signaling pathway. Mech. Dev. 91:249–258. 10.1016/S0925-4773(99)00309-3 - DOI - PubMed
    1. Aulicino F., Theka I., Ombrato L., Lluis F., and Cosma M.P.. 2014. Temporal perturbation of the Wnt signaling pathway in the control of cell reprogramming is modulated by TCF1. Stem Cell Reports. 2:707–720. 10.1016/j.stemcr.2014.04.001 - DOI - PMC - PubMed
    1. Blair K., Wray J., and Smith A.. 2011. The liberation of embryonic stem cells. PLoS Genet. 7:e1002019 10.1371/journal.pgen.1002019 - DOI - PMC - PubMed
    1. Chambers I., Silva J., Colby D., Nichols J., Nijmeijer B., Robertson M., Vrana J., Jones K., Grotewold L., and Smith A.. 2007. Nanog safeguards pluripotency and mediates germline development. Nature. 450:1230–1234. 10.1038/nature06403 - DOI - PubMed

Publication types

MeSH terms