. 2015 Oct 12;211(1):91-104.
doi: 10.1083/jcb.201502103.

Ribosome binding induces repositioning of the signal recognition particle receptor on the translocon

Affiliations

Ribosome binding induces repositioning of the signal recognition particle receptor on the translocon

Patrick Kuhn et al. J Cell Biol. .

Abstract

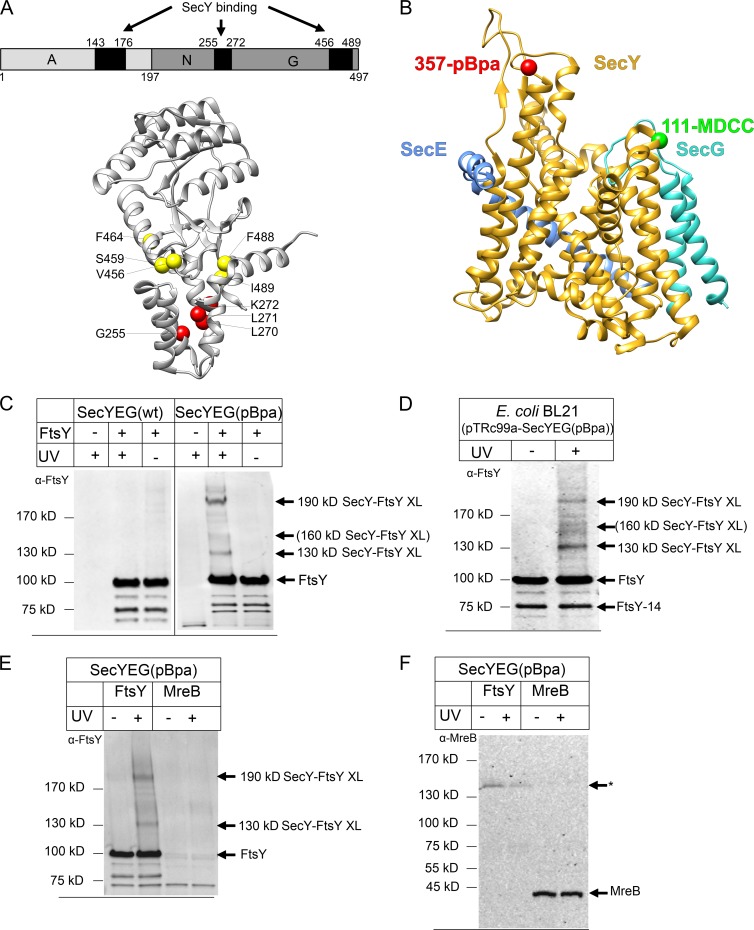
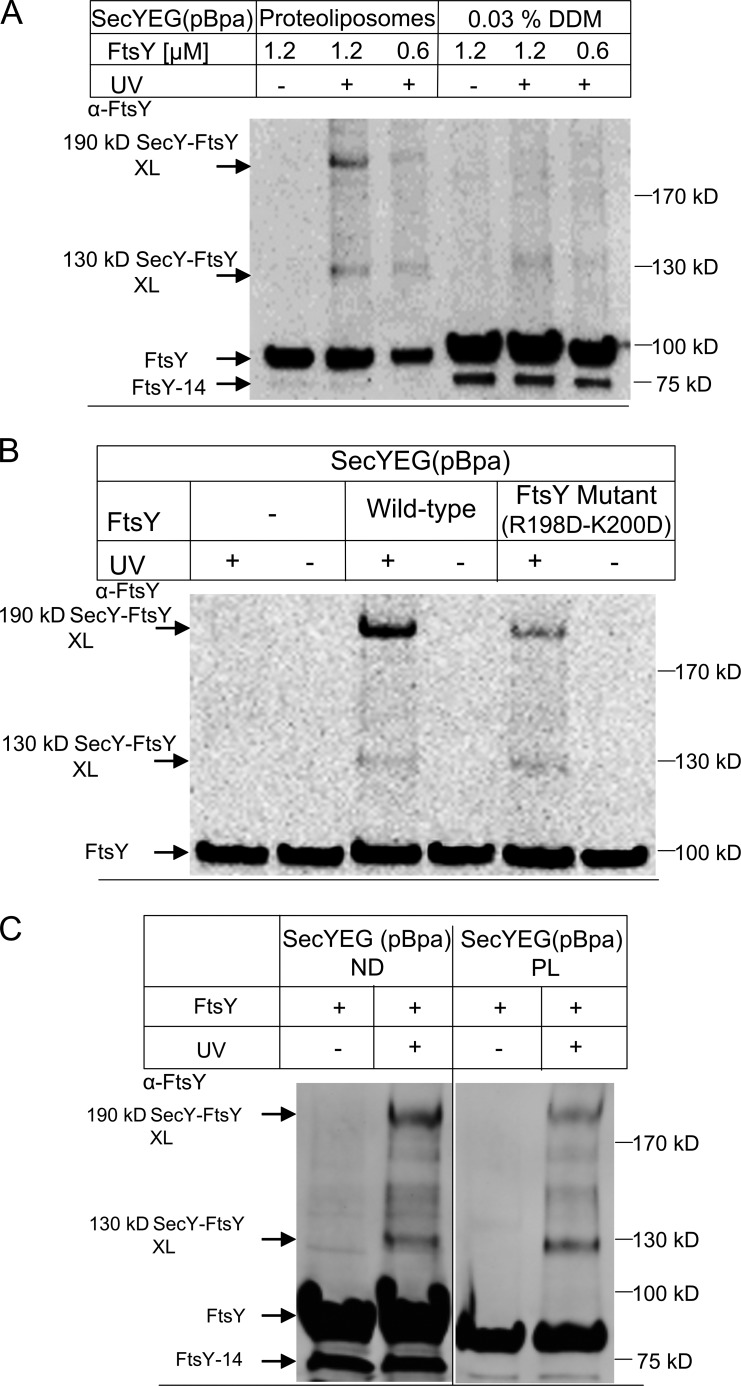
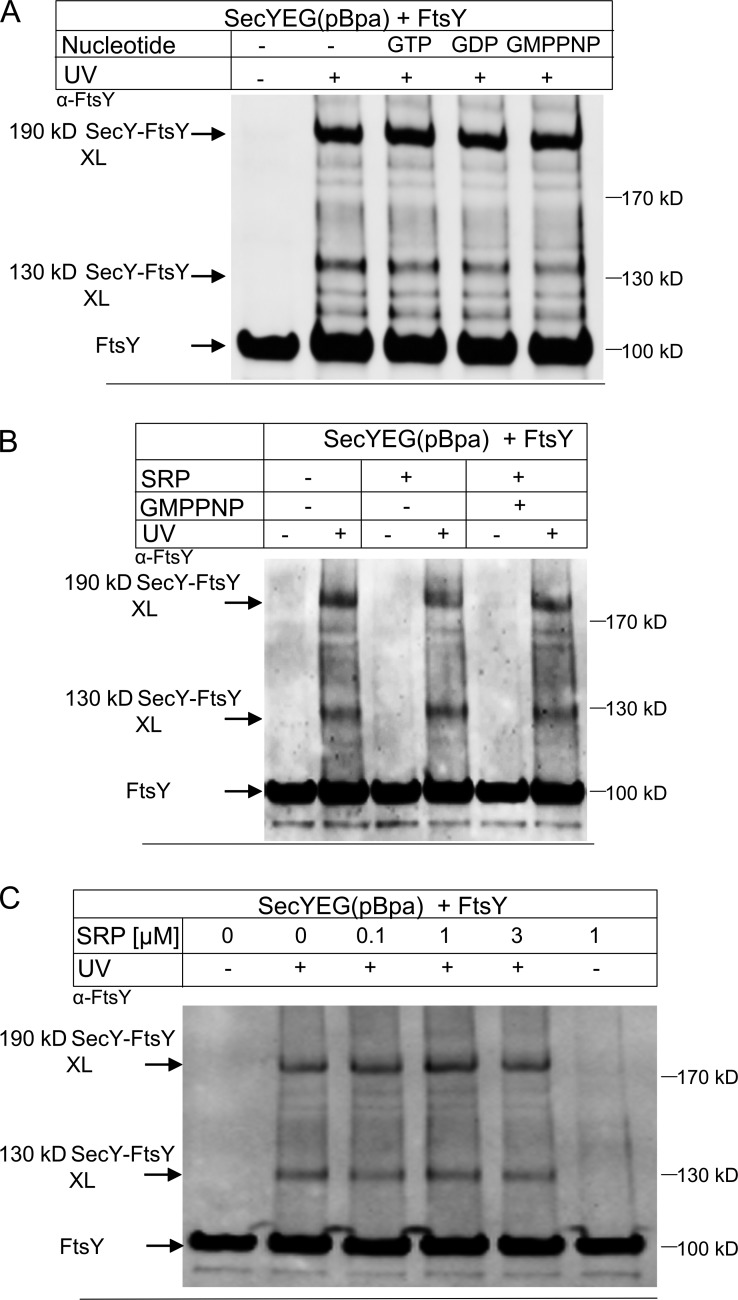
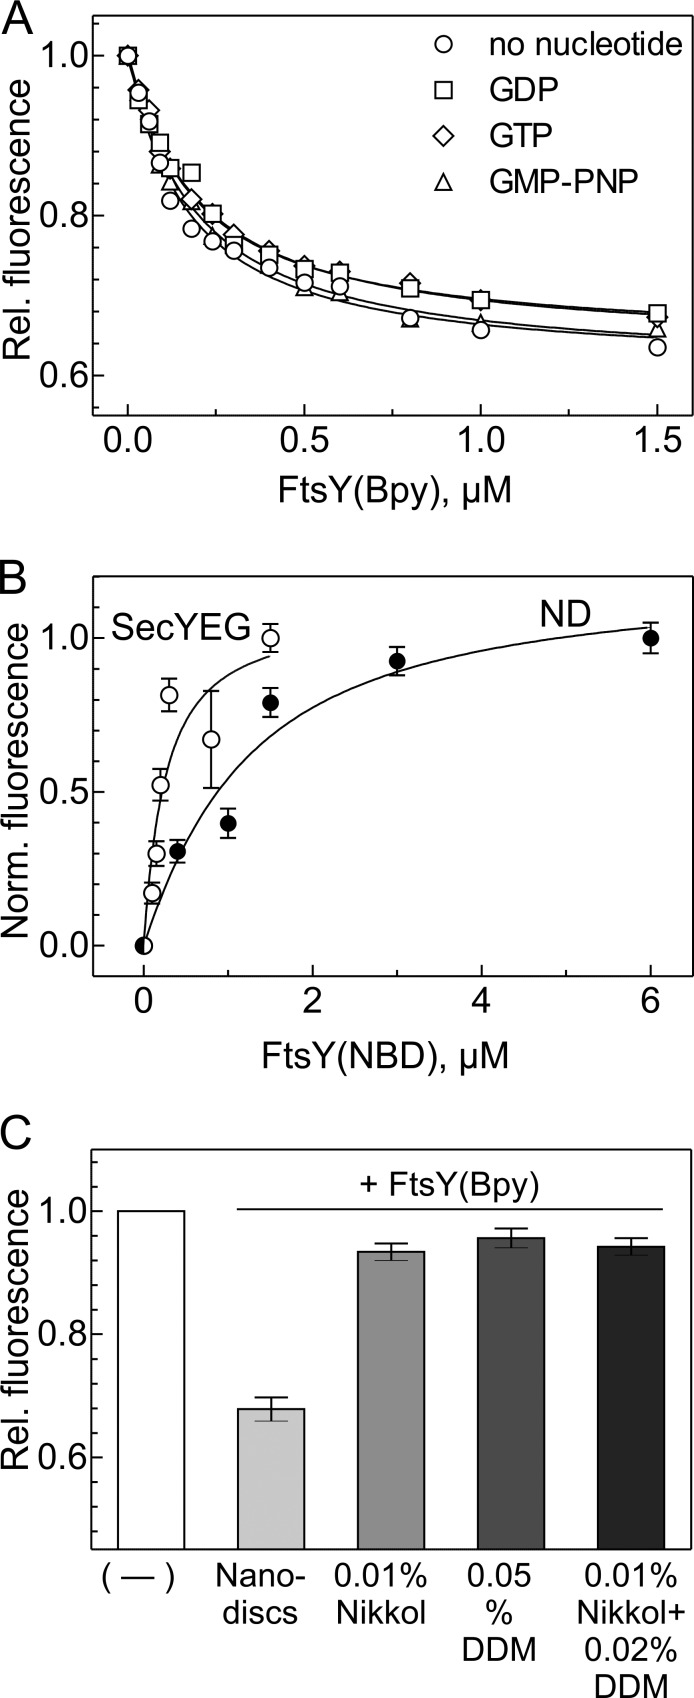
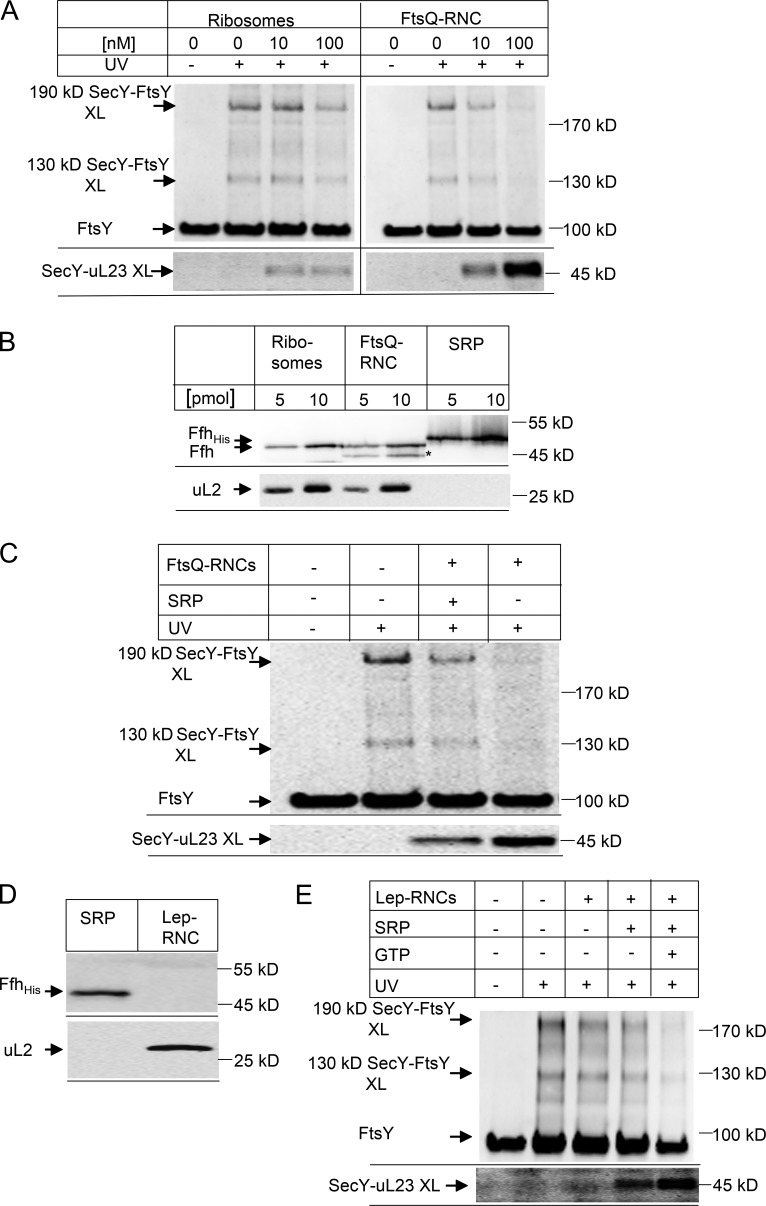
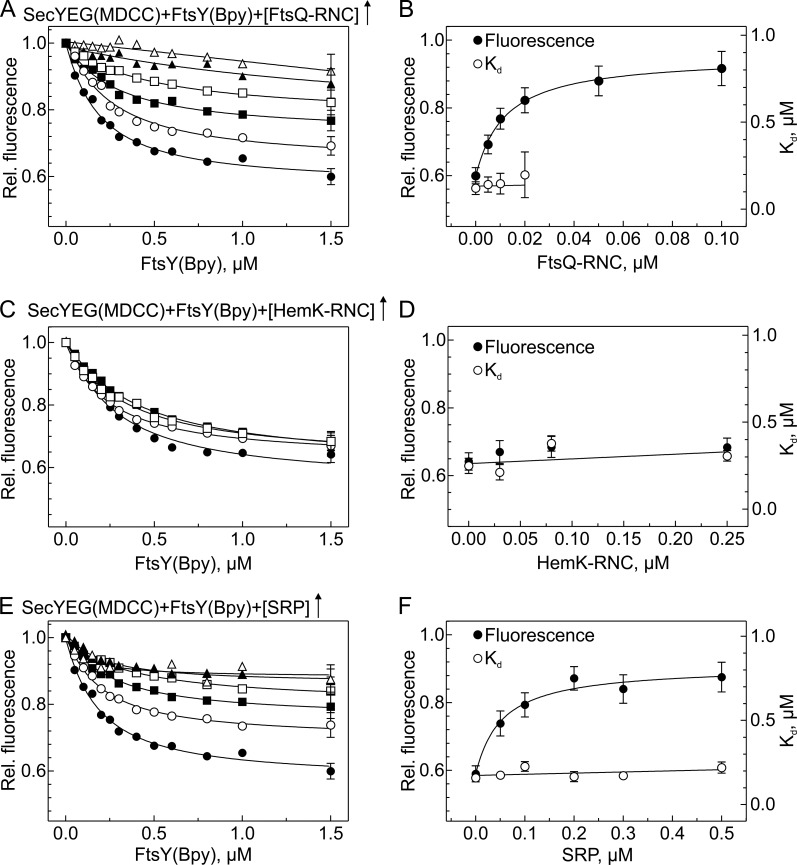
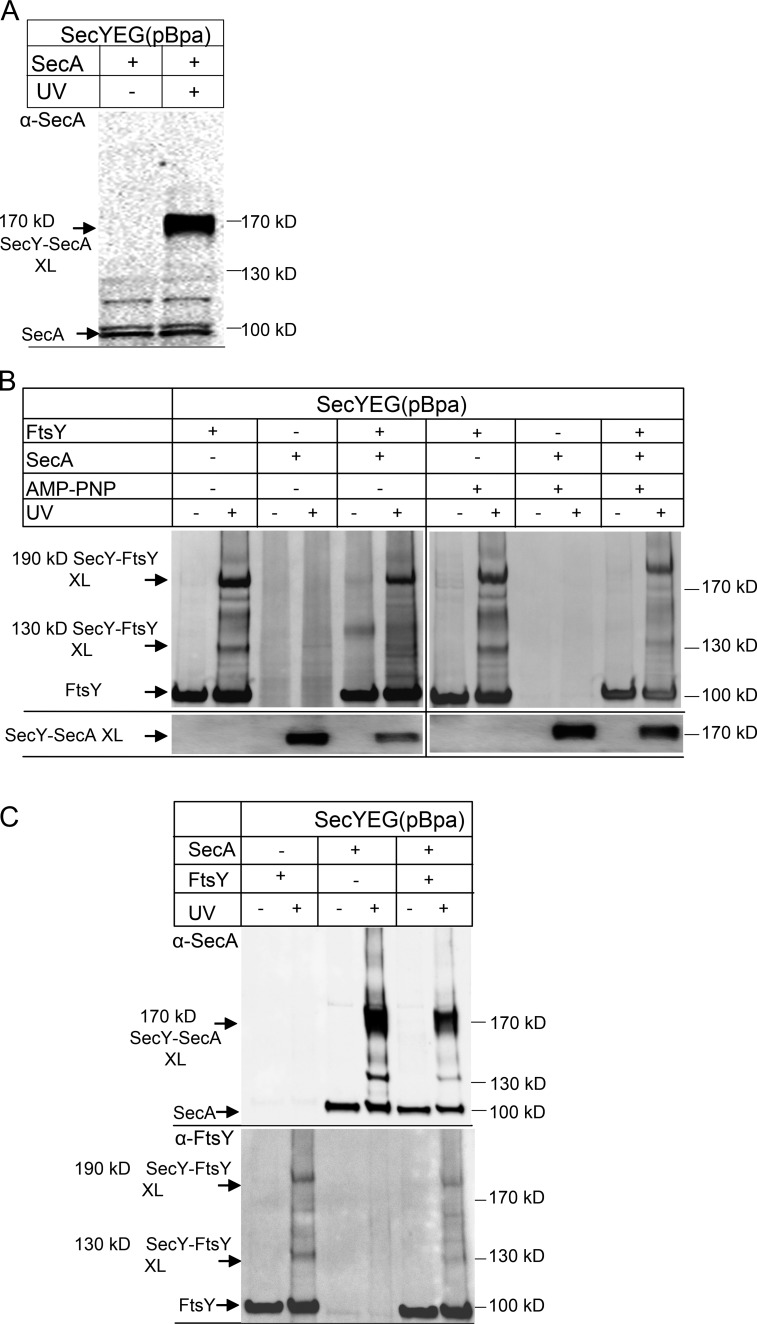
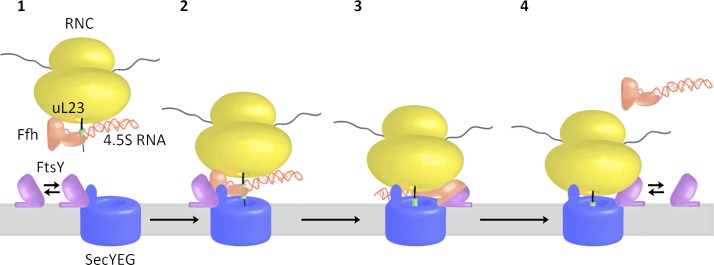
Cotranslational protein targeting delivers proteins to the bacterial cytoplasmic membrane or to the eukaryotic endoplasmic reticulum membrane. The signal recognition particle (SRP) binds to signal sequences emerging from the ribosomal tunnel and targets the ribosome-nascent-chain complex (RNC) to the SRP receptor, termed FtsY in bacteria. FtsY interacts with the fifth cytosolic loop of SecY in the SecYEG translocon, but the functional role of the interaction is unclear. By using photo-cross-linking and fluorescence resonance energy transfer measurements, we show that FtsY-SecY complex formation is guanosine triphosphate independent but requires a phospholipid environment. Binding of an SRP-RNC complex exposing a hydrophobic transmembrane segment induces a rearrangement of the SecY-FtsY complex, which allows the subsequent contact between SecY and ribosomal protein uL23. These results suggest that direct RNC transfer to the translocon is guided by the interaction between SRP and translocon-bound FtsY in a quaternary targeting complex.


Figures

Figure 1.
Figure 1.
A reconstituted system for analyzing the SecY–FtsY interaction. (A) Domain structure of E. coli FtsY (top). The FtsY regions that were cross-linked to SecY are indicated by black boxes. Crystal structure of the FtsY NG domain with the membrane targeting sequence (Stjepanovic et al., 2011; PDB accession no. 2YHS; bottom). The FtsY residues within the N domain that were cross-linked to SecY are indicated by red spheres and those within the G domain by yellow spheres. (B) Crystal structure of E. coli SecYEG (Park et al., 2014; PDB accession no. 3J45). Position 357 of SecY, where pBpa was incorporated, is indicated in red and position 111, at which the fluorophore MDCC was attached, is indicated in green. (C) SecYEG(pBpa)-PLs (SecYEG(pBpa); 10 nM SecYEG) were incubated with FtsY (1.2 µM) or buffer (−). After UV treatment for activating pBpa, the sample was extracted with Na2CO3 for removing excess FtsY and separated by SDS-PAGE. After Western transfer, the blot was decorated with polyclonal α-FtsY antibodies. Indicated are FtsY and the SecY–FtsY cross-link products at 130 and 190 kD. Weak cross-linking products at ∼160 kD are indicated in brackets. As a control, PLs containing SecYEG without pBpa [SecYEG(wt)] were analyzed. (D) For comparison, an in vivo cross-linking assay of E. coli cells expressing SecYEG(pBpa) was performed. After UV exposure of whole cells, SecYEG(pBpa) and its cross-link products were purified and separated by SDS-PAGE. The UV-dependent cross-link products are indicated. Independently of UV exposure, FtsY co-purifies with SecY and is visible as full-length protein and N-terminally truncated derivative (FtsY-14). (E) SecYEG(pBpa)-PLs were incubated with 1.2 µM FtsY or 1.2 µM MreB and treated as described in A. After Western transfer, the blot was decorated with polyclonal α-FtsY antibodies. (F) The material described in E was decorated with polyclonal α-MreB antibodies. The asterisk indicates an unidentified protein that is nonspecifically recognized by α-MreB in the FtsY-containing sample.
Figure 2.
Figure 2.
The SecY–FtsY interaction requires the presence of lipids. (A) SecYEG(pBpa)-PL or SecYEG(pBpa) in detergent solution (0.03% DDM) were incubated with different FtsY concentrations and UV activated. SecYEG(pBpa)-PLs were Na2CO3 treated as described in the legend to Fig. 1, and SecYEG(pBpa) in detergent was directly precipitated with TCA. Pellets after centrifugation were loaded on SDS-PAGE and further treated as in Fig. 1. FtsY-14 does not efficiently interact with membranes (Weiche et al., 2008) and is therefore not visible in the carbonate-treated sample. (B) SecYEG(pBpa)-PL were incubated with wild-type FtsY or the FtsY(R198D-K200D) mutant. The conditions for cross-linking and the detection of cross-links were as in A. (C) The SecY–FtsY interaction was monitored in both PL and nanodiscs. Treatment and conditions were identical as in Fig. 1, except that cross-linking products of SecYEG(pBpa)-nanodiscs were not carbonate extracted.
Figure 3.
Figure 3.
The SecY–FtsY cross-links are nucleotide independent and not influenced by SRP. (A) SecYEG(pBpa)-PL (10 nM SecYEG) were incubated with FtsY (1.2 µM), either in the absence or presence of nucleotides (50 µM final concentration). Samples were processed as in Fig. 1. Indicated are FtsY and the SecY–FtsY cross-link products at 130 and 190 kD. (B) SecYEG(pBpa)-PL were incubated with FtsY as in A. When indicated SRP (1 µM) and GMP-PNP (50 µM) were added before UV exposure. (C) SecYEG(pBpa)-PL were incubated with FtsY as described in A and increasing SRP concentrations together with GMP-PNP (50 µM). Samples were further processed as in A.
Figure 4.
Figure 4.
FtsY binding to SecYEG monitored by fluorescence. (A) Equilibrium titrations of SecYEG-FtsY complex formation monitored by FRET. SecYEG embedded into nanodiscs was titrated with FtsY in the absence of guanine nucleotide (○) or in the presence of 0.5 mM each of GDP (□), GTP (⋄), or GMP-PNP (△). SecY was labeled with the donor fluorophore MDCC at position 111 and FtsY with the acceptor fluorophore BODIPY FL at position 196 [FtsY(Bpy)]. Donor fluorescence is plotted relative to the initial fluorescence measured before FtsY(Bpy) addition and set to 1.0. Plotted are mean values from two titrations; SEMs were ≤5%. Kd values were obtained by nonlinear fitting using equation 1 (see Materials and methods); errors are SEMs of the fits. (B) Equilibrium titrations of FtsY binding to SecYEG in nanodiscs (○) and to empty nanodiscs (●) monitored by the fluorescence increase of an NBD label attached to position 26 of FtsY, corrected for the linear signal increase measured upon titrating FtsY(NBD) into buffer (Materials and methods). Plotted are mean values from two titrations each; error bars represent SEM. Upon complex formation, the fluorescence signal of FtsY(NBD) increased 6–8-fold; to facilitate comparison, the fluorescence increase is plotted in normalized numbers. Kd values of 0.16 ± 0.02 µM (SecYEG in nanodiscs) and 1.2 ± 0.4 µM (empty nanodiscs) were determined by nonlinear fitting using equation 1 (Materials and methods); errors are SEMs of the fits. (C) Inhibition of FtsY binding to SecYEG in the presence of nonionic detergents. The fluorescence of SecYEG(MDCC) (0.05 µM) embedded in nanodiscs or solubilized by detergent, as indicated, was monitored on addition of FtsY(Bpy) (1 µM). The fluorescence signal measured after the addition of FtsY(Bpy) is plotted relative to the respective initial signal set to 1.0. The error bars indicate the SD (n = 3).
Figure 5.
Figure 5.
Nascent membrane proteins abolish SecY–FtsY cross-linking. (A) SecYEG(pBpa)-PL (10 nM final concentration SecYEG) were incubated with 1.2 µM FtsY and 50 µM GTP in the absence or presence of different concentrations of FtsQ ribosome nascent chains of 102 amino acid length (FtsQ-RNCs) or nontranslating ribosomes. After SDS-PAGE and Western transfer, the membrane was horizontally cut and the upper part was decorated with polyclonal α-FtsY antibodies (top) and the lower part with polyclonal α-uL23 antibodies (bottom). (B) Different amounts of the ribosomes and FtsQ-RNCs used in (A) were separated by SDS-PAGE and after Western transfer decorated with antibodies against Ffh, the protein component of the bacterial SRP. Purified His-tagged SRP was used as reference, and antibodies against the ribosomal protein uL2 were used to determine the ribosome concentration. A band nonspecifically recognized by α-Ffh antibodies in the FtsQ-RNC sample is marked with an asterisk. (C) SecYEG(pBpa)-PL were incubated with FtsY as in A in the presence of 50 µM GTP. When indicated, 100 nM FtsQ-RNC was added without additional SRP or with 100 nM SRP. (D) RNCs of leader peptidase (Lep-RNCs, 94 amino acid length, 10 pmol) were separated by SDS-PAGE and after Western transfer were decorated with antibodies against uL2 and Ffh. His-tagged Ffh (10 pmol) served as a control. (E) SRP-free Lep-RNCs (100 nM) were incubated with SecYEG(pBpa)-PL and FtsY as in A. When indicated, SRP (1 µM) and GTP (50 µM) were added. The top panel was decorated with antibodies against FtsY and the bottom panel with antibodies against uL23.
Figure 6.
Figure 6.
SecYEG-FtsY complex formation in the presence of FtsQ-RNC, HemK-RNC, or SRP. (A) SecYEG-FtsY complex formation in the presence of FtsQ-RNC. MDCC-labeled SecYEG in nanodiscs was titrated with FtsY(Bpy) in the presence of increasing concentrations of FtsQ-RNC (µM): 0, ●; 0.005, ○; 0.01, ■; 0.02, □; 0.05, ▲; 0.1, △. For clarity, representative error bars (SEM; n = 2) are indicated only on the last titration point. Kd values of ∼0.18 µM were determined by nonlinear fitting using equation 1 (Materials and methods); at concentrations of FtsQ-RNC >0.02 µM, the fluorescence change was too small to allow for the estimation of reliable Kd values. (B) Effect of FtsQ-RNC binding on the SecYEG-FtsY complex. Kd values from A are plotted against the concentration of FtsQ-RNC (○; right Y-axis). Donor (MDCC) fluorescence measured at saturation with FtsY(Bpy) (●, left Y-axis) is plotted relative to the initial fluorescence of SecYEG(MDCC) measured before the addition of FtsY(Bpy); error bars represent SEM from (A). Nonlinear fitting to equation 2 (Materials and methods) yielded an apparent Kd = 8 ± 1 nM for the binding of FtsQ-RNC to the SecYEG-FtsY complex. (C) SecYEG-FtsY complex formation in the presence of HemK-RNC. Titrations were performed as in A in the presence of increasing concentrations of HemK-RNC (µM): 0, ●; 0.03, ○; 0.08, ■; 0.25, □. (D) No effect of HemK-RNC on SecYEG-FtsY complex formation. (E) SecYEG-FtsY complex formation in the presence of SRP. MDCC-labeled SecYEG was titrated with FtsY(Bpy) in the presence of increasing concentrations of SRP (µM): 0, ●; 0.05, ○; 0.1, ■; 0.2, □; 0.3, ▲; 0.5, △. Apparent Kd values of ∼0.2 µM (○, right Y-axis) were determined by nonlinear fitting as in A. (F) Effect of SRP on the SecYEG-FtsY complex. Kd values from C are plotted against the SRP concentration (○). Donor (MDCC) fluorescence measured at saturation (●, left Y-axis) is plotted relative to the initial fluorescence measured before the addition of FtsY(Bpy). Nonlinear fitting as in B yielded an apparent Kd of 40 ± 10 nM for the binding of SRP to the SecYEG-FtsY complex.
Figure 7.
Figure 7.
SecA and FtsY compete for access to the SecYEG translocon. (A) SecYEG(pBpa)-PL (10 nM SecYEG final concentration) were incubated with 1.0 µM SecA and UV exposed, when indicated. After Na2CO3 extraction the sample was separated by SDS-PAGE and, after Western transfer, decorated with polyclonal α-SecA antibodies. Indicated are SecA and the 170 kD SecY–SecA cross-link product. (B) SecYEG(pBpa)-PL were incubated with FtsY or SecA or with both proteins and UV exposed. When both FtsY and SecA were present, FtsY was added before SecA. After SDS-PAGE and Western transfer, the membrane was decorated with polyclonal α-FtsY antibodies (top). After stripping of the membrane by treatment with SDS/DTT, the membrane was decorated with polyclonal α-SecA antibodies (bottom). (C) As in B, but when both FtsY and SecA were present, SecA was added before FtsY. The blot was decorated with polyclonal α-SecA antibodies (top) or polyclonal α-FtsY antibodies (bottom).
Figure 8.
Figure 8.
Model for cotranslational targeting of SRP–RNCs to the SecYEG translocon. For details, see the text.

References

    1. Akopian D., Dalal K., Shen K., Duong F., and Shan S.O.. 2013a SecYEG activates GTPases to drive the completion of cotranslational protein targeting. J. Cell Biol. 200:397–405. 10.1083/jcb.201208045 - DOI - PMC - PubMed
    1. Akopian D., Shen K., Zhang X., and Shan S.O.. 2013b Signal recognition particle: an essential protein-targeting machine. Annu. Rev. Biochem. 82:693–721. 10.1146/annurev-biochem-072711-164732 - DOI - PMC - PubMed
    1. Alami M., Dalal K., Lelj-Garolla B., Sligar S.G., and Duong F.. 2007. Nanodiscs unravel the interaction between the SecYEG channel and its cytosolic partner SecA. EMBO J. 26:1995–2004. 10.1038/sj.emboj.7601661 - DOI - PMC - PubMed
    1. Angelini S., Deitermann S., and Koch H.G.. 2005. FtsY, the bacterial signal-recognition particle receptor, interacts functionally and physically with the SecYEG translocon. EMBO Rep. 6:476–481. 10.1038/sj.embor.7400385 - DOI - PMC - PubMed
    1. Angelini S., Boy D., Schiltz E., and Koch H.G.. 2006. Membrane binding of the bacterial signal recognition particle receptor involves two distinct binding sites. J. Cell Biol. 174:715–724. 10.1083/jcb.200606093 - DOI - PMC - PubMed

Publication types

LinkOut - more resources