. 2015 Oct 12;211(1):105-22.
doi: 10.1083/jcb.201411128.

mTORC2 promotes cell survival through c-Myc-dependent up-regulation of E2F1

Affiliations

mTORC2 promotes cell survival through c-Myc-dependent up-regulation of E2F1

Zhipeng Zou et al. J Cell Biol. .

Abstract

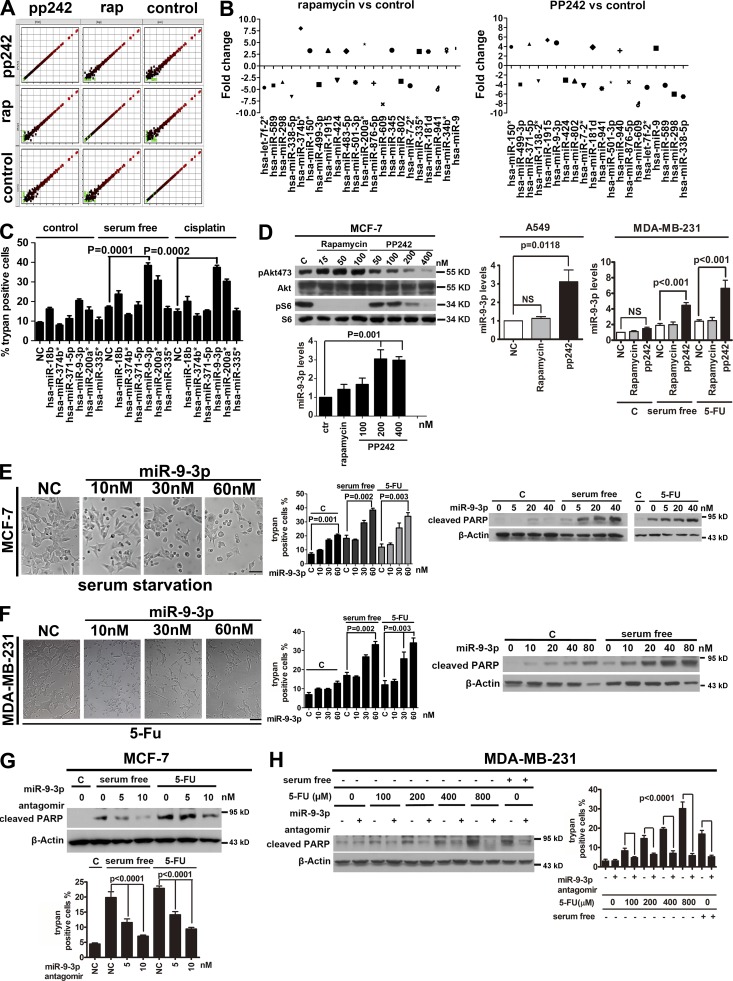
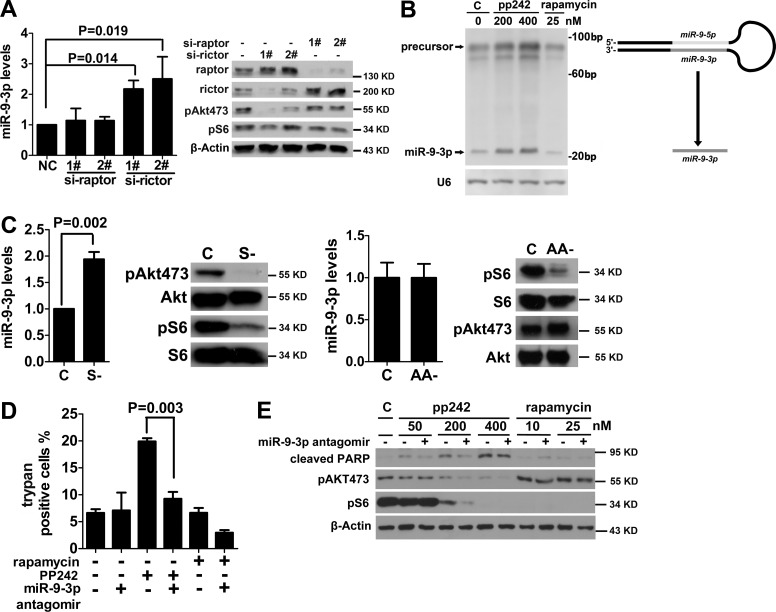
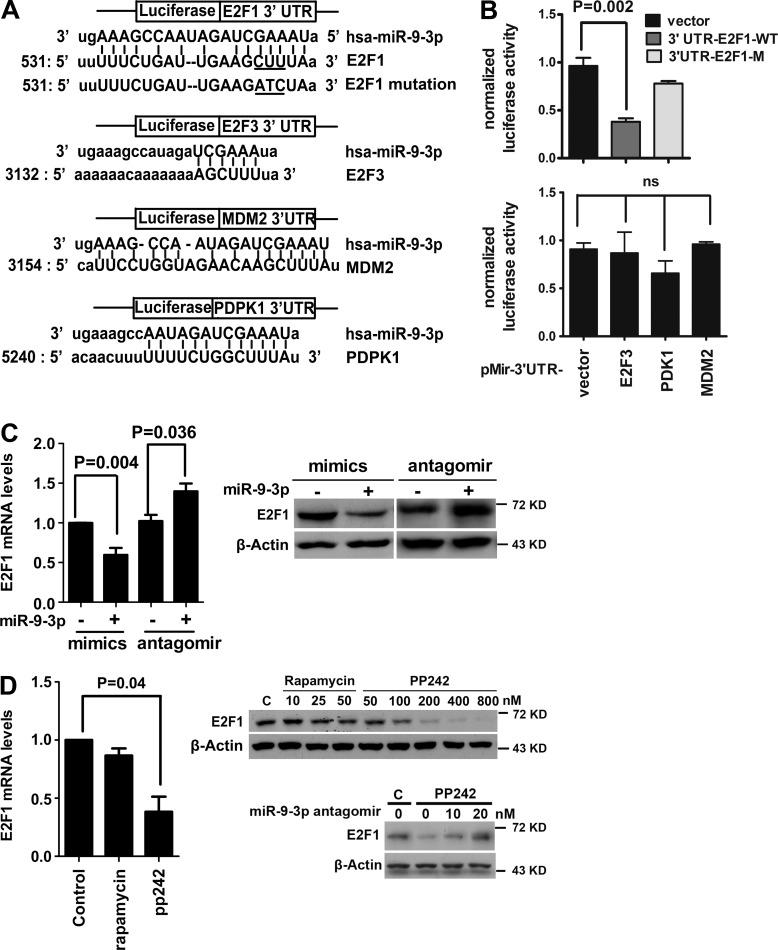
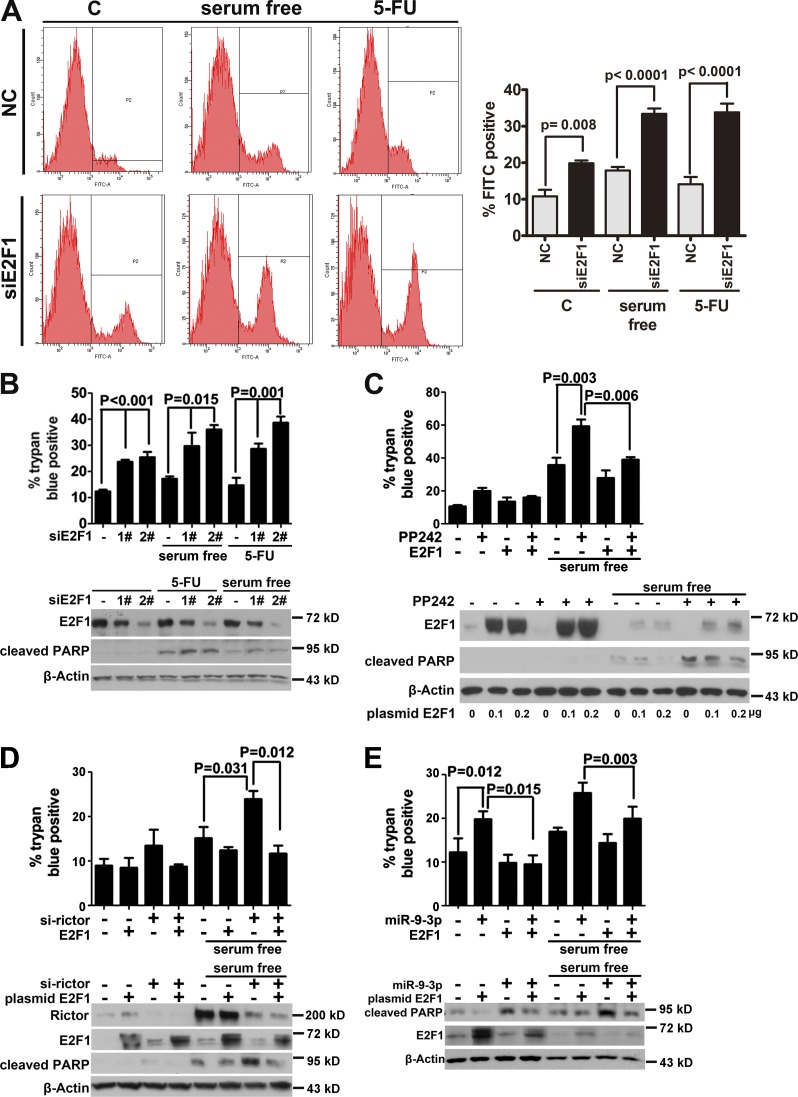
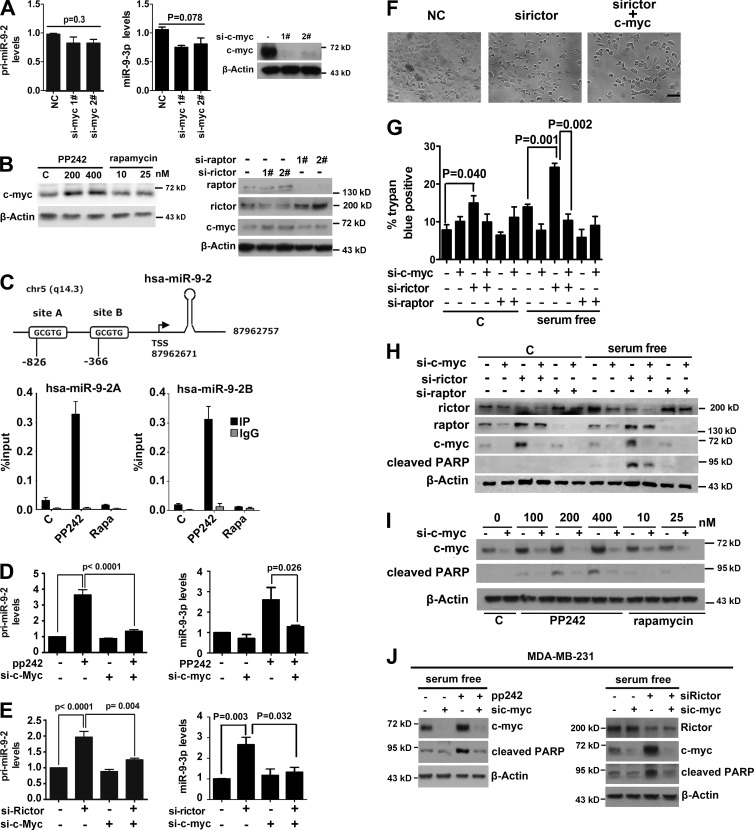
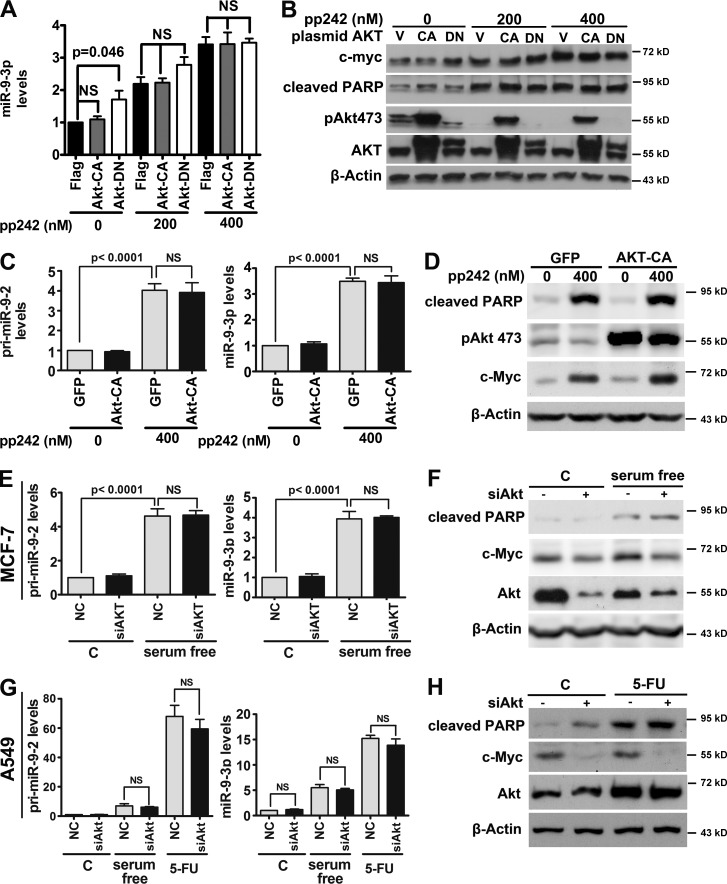
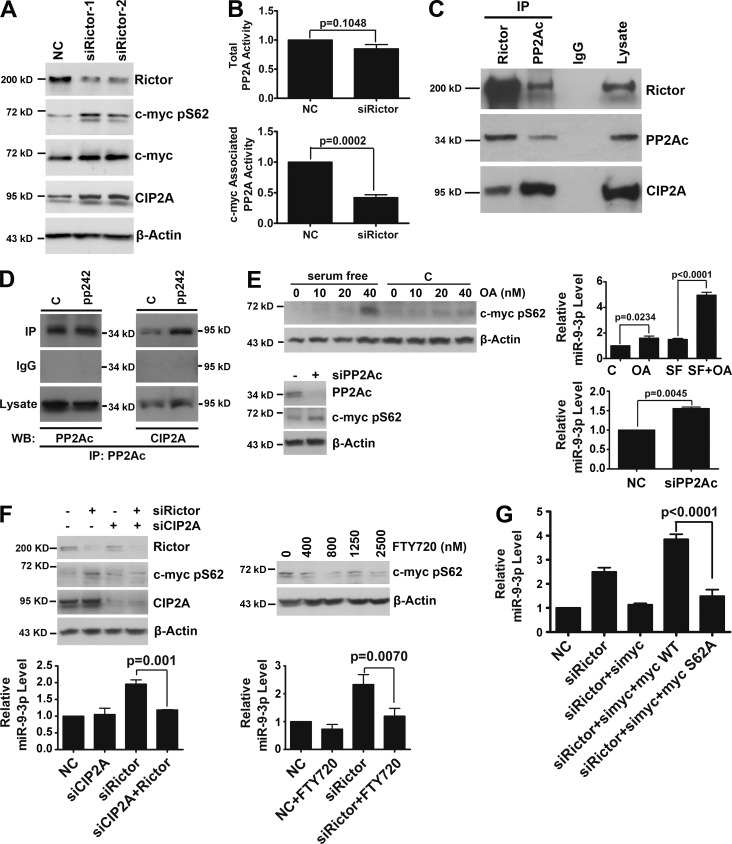
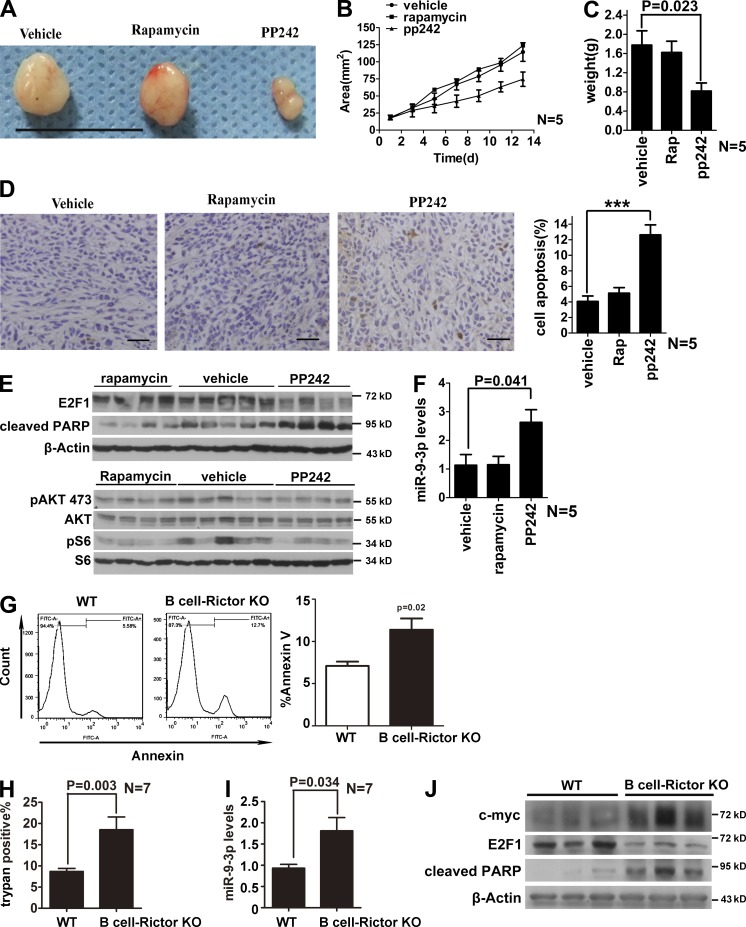
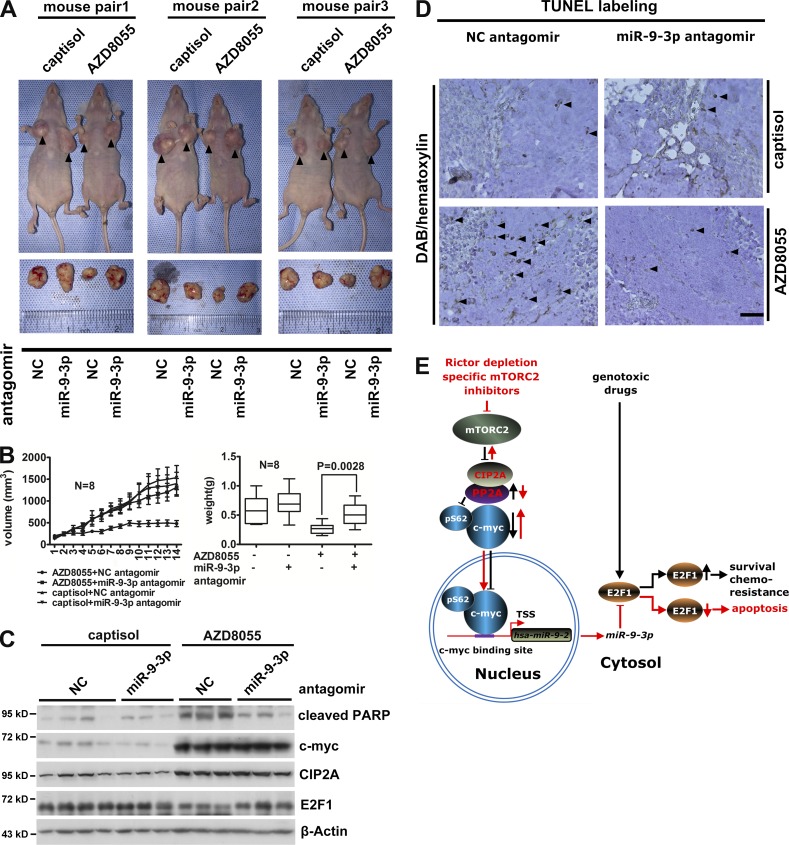
Previous studies have reported that mTORC2 promotes cell survival through phosphorylating AKT and enhancing its activity. We reveal another mechanism by which mTORC2 controls apoptosis. Inactivation of mTORC2 promotes binding of CIP2A to PP2A, leading to reduced PP2A activity toward c-Myc serine 62 and, consequently, enhancement of c-Myc phosphorylation and expression. Increased c-Myc activity induces transcription of pri-miR-9-2/miR-9-3p, in turn inhibiting expression of E2F1, a transcriptional factor critical for cancer cell survival and tumor progression, resulting in enhanced apoptosis. In vivo experiments using B cell-specific mTORC2 (rapamycin-insensitive companion of mTOR) deletion mice and a xenograft tumor model confirmed that inactivation of mTORC2 causes up-regulation of c-Myc and miR-9-3p, down-regulation of E2F1, and consequent reduction in cell survival. Conversely, Antagomir-9-3p reversed mTORC1/2 inhibitor-potentiated E2F1 suppression and resultant apoptosis in xenograft tumors. Our in vitro and in vivo findings collectively demonstrate that mTORC2 promotes cell survival by stimulating E2F1 expression through a c-Myc- and miR-9-3p-dependent mechanism.


Figures

Figure 1.
Figure 1.
miRNAs are differentially regulated by mTORC1 and mTORC2, and miR-9-3p is a proapoptotic miRNA induced by pp242 in multiple cell lines. (A) MCF-7 cells were treated with control, 200-nM PP242, or 100-nM rapamycin, and after 48 h total miRNAs were analyzed with microarray. This experiment was completed once. Differential expression patterns of miRNAs between the groups are shown using a matrix plot. (B) PP242 and rapamycin-responsive miRNAs (at least threefold changes in expression vs. control) are presented. (C) Mimics of several miRNAs were transfected into MCF-7 cells, followed by 20-µM cisplatin treatment or serum starvation for 24 h, and consequent cell death was monitored using trypan blue staining. (D) miR-9-3p levels of MCF-7, A549, and MDA-MB-231 cells subjected to PP242 or rapamycin treatment were assayed using RT-qPCR to verify microarray results. Phosphorylated S6 and Akt were additionally monitored using Western blotting to ensure effective and specific treatment. (E and F) MCF-7 (E) and MDA-MB-231 (F) cells were transfected with miR-9-3p mimics at different concentrations as indicated and subsequently left untreated or subjected to serum starvation or 5-FU exposure. 60 h after transfection, cells were imaged using a light microscope (left), detached with trypsin, and monitored using trypan blue staining (middle) or harvested and analyzed via Western blotting for PARP cleavage (right). Bars, 50 µm. (G and H) MCF-7 (G) and MDA-MB-231 (H) cells were transfected with miR-9-3p antagomir at various concentrations and either analyzed for PARP cleavage or death rate, as indicated. Error bars represent mean values ± SEM. C, control; ctr, control; NC, negative control.
Figure 2.
Figure 2.
mTORC2, but not mTORC1, suppresses miR-9-3p to promote cell survival. (A) MCF-7 cells were transfected with nontargeted siRNA (NC) or two siRNAs targeting different regions of Rictor or Raptor mRNA. After 60 h, cells were harvested and lysed, and the miR-9-3p level was monitored using RT-qPCR (left). Expression of Rictor or Raptor and phosphorylation of S6 or Akt were assessed using Western blotting to ensure siRNA-induced depletion and inhibition of mTORC1 or mTORC2 (right). (B) MCF-7 cells were treated with either pp242 or rapamycin as indicated. At 24 h after treatment, miR-9-3p and its precursor were detected by Northern blotting. (C) MCF-7 cells were subjected to serum (left) or amino acid (AA; right) starvation, and the miR-9-3p level was analyzed along with S6 or Akt phosphorylation. MCF-7 cells transfected with the miR-9-3p antagomir were treated with PP242 or rapamycin, as indicated. (D and E) 48 h after transfection, cells were assayed for apoptosis via trypan blue staining (D) or PARP cleavage using Western blotting (E). Error bars represent mean values ± SEM. C, control; NC, negative control; S, serum.
Figure 3.
Figure 3.
miR-9-3p down-regulates E2F1 by directly targeting its 3′ UTR. (A) WT 3′ UTR of E2F1, E2F3, MDM2, or PDK1 or mutant 3′ UTR of E2F1 mRNA was cloned into pMIR-REPORT downstream of Firefly luciferase, and the resulting plasmid was designated pMIR-3′-UTR-E2F1, pMIR-3′-UTR-E2F3, pMIR-3′-UTR-MDM2, pMIR-3′-UTR-PDK1, or pMIR-3′-UTR-E2F1 mutant, respectively (the underlines represent the mutated seed regions). (B) Nontargeted or miR-9-3p mimic was transfected into MCF-7 cells together with pMIR-3′-UTR-E2F1, pMIR-3′-UTR-E2F3, pMIR-3′-UTR-MDM2, pMIR-3′-UTR-PDK1, or pMIR-3′-UTR-E2F1 mutant and a control Renilla luciferase expression vector. 60 h after transfection, cells were harvested and assayed for relative luciferase units. (C) MCF-7 cells were transfected with nontargeted miRNA, miR-9-3p mimic, or miR-9-3p antagomir. 60 h after transfection, cells were harvested, and E2F1 expression was analyzed using RT-qPCR at the mRNA level (left) or Western blotting at the protein level (right). (D, top) MCF-7 cells were treated with PP242 or rapamycin as indicated and analyzed for E2F1 expression as described in C. (Bottom) 36 h after transfection with a miR-9-3p antagomir gradient, MCF-7 cells were treated with 200-nM PP242 for an additional 24 h, and E2F1 expression was analyzed via Western blotting. Error bars represent mean values ± SEM. ns, not significant.
Figure 4.
Figure 4.
miR-9-3p acts downstream of mTORC2 and triggers apoptosis by targeting E2F1. (A) MCF-7 cells were transfected with a pool of two siRNAs (1:1) targeting different regions of E2F1 mRNA. After 36 h, cells were serum starved or treated with 400-µM 5-FU for an additional 24 h, harvested, and labeled with Annexin V–FITC and propidium iodide for analysis of apoptosis. The data shown are from a single representative experiment out of three repeats. (B) MCF-7 cells were transfected separately with the two siRNAs and treated as in A, followed by trypan blue staining (top) or Western blotting (bottom). (C) MCF-7 cells were transfected with vehicle or WT E2F1 in the absence or presence of PP242, as indicated. 12 h after transfection, cells were serum starved for an additional 24 h and harvested for either trypan blue staining (top) or Western blotting (bottom). (D) MCF-7 cells were sequentially transfected with Rictor siRNA and WT E2F1. After 24 h of serum starvation, the effects of ectopic E2F1 expression on Rictor knockdown were monitored via trypan blue staining (top) and Western blotting (bottom). (E) MCF-7 cells were sequentially transfected with miR-9-3p and E2F1, followed by assay as described in C. Error bars represent mean values ± SEM. C, control; NC, negative control.
Figure 5.
Figure 5.
mTORC2 mediates pri-miR-9-2/miR-9-3p/E2F1 signaling and apoptosis via c-Myc. (A) The effect of silencing c-Myc on the pri-miR-9-2/miR-9-3p level was assayed using RT-qPCR (left and middle). Protein expression of c-Myc was analyzed via Western blotting (right). (B) MCF-7 cells were treated with PP242 or rapamycin (left) or transfected with two different siRNAs for Rictor and Raptor (right) as indicated, and their effects on c-Myc expression were monitored using Western blotting. (C) MCF-7 cells were treated with 200-nM PP242 or 10-nM rapamycin for 24 h and subjected to chromatin extraction. Sheared chromatin was immunoprecipitated with a c-Myc antibody and the two binding promoter regions of hsa-miR-9-2 (one of three miR-9-3p–coding DNAs) augmented using RT-qPCR. (D and E) The effect of c-Myc silencing on the pri-miR-9-2/miR-9-3p level regulated by PP242 (D) or Rictor knockdown (E) was analyzed using RT-qPCR. (F–I) The effect of c-Myc silencing on apoptosis induced upon Rictor depletion or PP242 treatment was detected with a light microscope (F), trypan blue staining (G), or Western blotting (H and I), as indicated. Bar, 50 µm. (J) In MDA-MB-231 cells, the effect of c-Myc silencing on apoptosis induced upon 200-nM PP242 treatment (left) or Rictor depletion (right) was detected with Western blot analysis of PARP cleavage. C, control; NC, negative control; TSS, transcription start site. Error bars represent mean values ± SEM.
Figure 6.
Figure 6.
mTORC2 suppresses c-Myc/pri-miR-9-2/miR-9-3p in an Akt-independent manner. (A and B) MCF-7 cells were transfected with vector, pUSE-Akt CA, or pUSE-Akt DN, as indicated. 24 h after transfection, cells were treated with or without PP242 for an additional 24 h, harvested, and monitored to determine the miR-9-3p level using RT-qPCR (A) or analyzed for c-Myc expression and PARP cleavage using Western blotting (B). MCF-7 cells were cotransfected with pEGFP-N1 and pUSE-Akt CA (vector) and treated as in A, followed by FACS sorting. (C and D) Sorted cells were analyzed for pri-miR-9-2/miR-9-3p levels (C) or c-Myc expression and PARP cleavage (D). (E–H) MCF-7 (E and F) and A549 (G and H) cells were transfected with a pool of two different siRNAs of Akt1 (1:1). (E and G) 36 h after transfection, cells were serum starved or treated with 400-µM 5-FU for an additional 24 h and analyzed for pri-miR-9-2 (left), miR-9-3p (middle), or c-Myc expression and PARP cleavage (F and H). Error bars represent mean values ± SEM. C, control; NC, negative control; V, vector.
Figure 7.
Figure 7.
mTORC2 suppresses c-Myc/miR-9-3p via PP2A-mediated dephosphorylation of c-Myc. (A) MCF-7 cells were transfected with nontargeted siRNA (NC) or two siRNAs targeting different regions of Rictor mRNA. After 60 h, cells were harvested for Western blot analysis. (B) 60 h after transfection as indicated, MCF-7 cells were lysed and immunoprecipitated with PP2A (top) or c-Myc (bottom) and assayed for PP2A activity. For the latter, PP2A activity was normalized to immunoprecipitated c-Myc levels. (C) MCF-7 lysates were immunoprecipitated with antibodies against Rictor or PP2Ac and blotted for Rictor, PP2Ac, and CIP2A. (D) 200-nM PP242–treated MCF-7 cells were lysed, immunoprecipitated, and blotted as indicated. (E) MCF-7 cells were treated with OA gradient, as indicated, in the presence or absence of serum starvation for 24 h. After 24 h, cells were harvested for Western blotting (top left) or RT-qPCR analysis of miR-9-3p level (top right). MCF-7 cells were transfected with siRNA for PP2Ac (siPP2A). After 60 h, cells were harvested for Western blotting (bottom left) or RT-qPCR analysis of the miR-9-3p level (bottom right). (F) MCF-7 cells were cotransfected with siRNAs for both Rictor and CIP2A (left) or transfected with siRNA for Rictor followed by 2.5-µM FTY720 treatment for 24 h (right). 60 h after transfection, cells were harvested either for Western blot analysis (top) or RT-qPCR assay of miR-9-3p (bottom). (G) Effects of ectopic expression of WT c-Myc (myc WT) or S62A mutant (myc S62A) on the miR-9-3p level regulated by simultaneous silencing of Rictor and c-Myc were analyzed using RT-qPCR. Error bars represent mean values ± SEM. C, control; IP, immunoprecipitation; NC, negative control; SF, serum free; WB, Western blot.
Figure 8.
Figure 8.
mTORC2 modulates c-Myc/miR-9-3p/E2F1 to promote survival in tumor xenografts and a mouse genetic model. (A and B) Images (A) and tumor growth curves (B) of MDA-MB-231 xenografts in BALB/c nude mice treated with vehicle, rapamycin, or PP242 daily by gavage. Treatment groups comprised five mice each. Each data point signifies the estimated tumor areas. Bar, 1 in. (C) Tumor weights of MDA-MB-231 xenografts in nude mice treated with vehicle, rapamycin, or PP242. (D) MDA-MB-231 xenografts were subjected to TUNEL labeling, with the percentage of apoptotic cells calculated under a light microscope. ***, P < 0.001 for comparison of PP242 therapy versus control therapy. Bars, 50 µm. (E and F) MDA-MB-231 xenografts were analyzed for expression of the indicated proteins via Western blotting (E) or miR-9-3p via RT-qPCR (F). (G–J) B lymphocytes from mice conditionally deficient in the Rictor gene were harvested and analyzed for cell death rate with Annexin V labeling (G) and trypan blue staining (H), expression of miR-9-3p with RT-qPCR (I), or cleavage of PARP and expression of c-Myc and E2F1 using Western blotting (J). The figures shown are from a single representative experiment out of three repeats. Error bars represent mean values ± SEM.
Figure 9.
Figure 9.
Antagomir-9-3p restores AZD8055-suppressed growth and survival of tumor xenografts. (A and B) BALB/c nude mice were treated with captisol or AZD8055 by gavage and intratumorally injected with antagomirs of NC and miR-9-3p. Each treatment group comprised eight mice. (A) Representative images of mice (top) and MDA-MB-231 xenografts (bottom). (B) Tumor growth curves (left) and tumor weights (right) of MDA-MB-231 xenografts. (C and D) MDA-MB-231 xenografts treated as described in A were either analyzed for the indicated proteins by Western blotting (C) or subjected to TUNEL labeling (D). Images of DAB/hematoxylin staining under a light microscope (40×) are shown. Bar, 50 µm. Arrowheads indicate apoptotic cells. (E) A schematic diagram illustrates the currently defined mTORC2–CIP2A–PP2A–c-Myc–miR-9-3p–E2F1 pathway. Error bars represent mean values ± SEM. NC, negative control.

References

    1. AlQurashi N., Hashimi S.M., and Wei M.Q.. 2013. Chemical inhibitors and microRNAs (miRNA) targeting the mammalian target of rapamycin (mTOR) pathway: Potential for novel anticancer therapeutics. Int. J. Mol. Sci. 14:3874–3900. 10.3390/ijms14023874 - DOI - PMC - PubMed
    1. Askew D.S., Ashmun R.A., Simmons B.C., and Cleveland J.L.. 1991. Constitutive c-myc expression in an IL-3-dependent myeloid cell line suppresses cell cycle arrest and accelerates apoptosis. Oncogene. 6:1915–1922. - PubMed
    1. Bai X., and Jiang Y.. 2010. Key factors in mTOR regulation. Cell. Mol. Life Sci. 67:239–253. 10.1007/s00018-009-0163-7 - DOI - PMC - PubMed
    1. Benjamin D., Colombi M., Moroni C., and Hall M.N.. 2011. Rapamycin passes the torch: A new generation of mTOR inhibitors. Nat. Rev. Drug Discov. 10:868–880. 10.1038/nrd3531 - DOI - PubMed
    1. Biswas A.K., and Johnson D.G.. 2012. Transcriptional and nontranscriptional functions of E2F1 in response to DNA damage. Cancer Res. 72:13–17. 10.1158/0008-5472.CAN-11-2196 - DOI - PMC - PubMed

Publication types

MeSH terms