. 2015 Oct 12;211(1):123-44.
doi: 10.1083/jcb.201311117.

APPL endosomes are not obligatory endocytic intermediates but act as stable cargo-sorting compartments

Affiliations

APPL endosomes are not obligatory endocytic intermediates but act as stable cargo-sorting compartments

Inna Kalaidzidis et al. J Cell Biol. .

Abstract

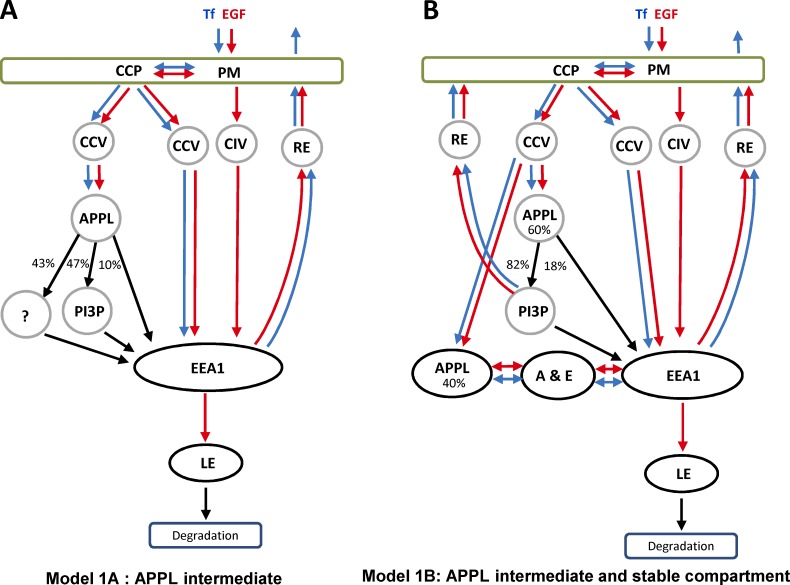
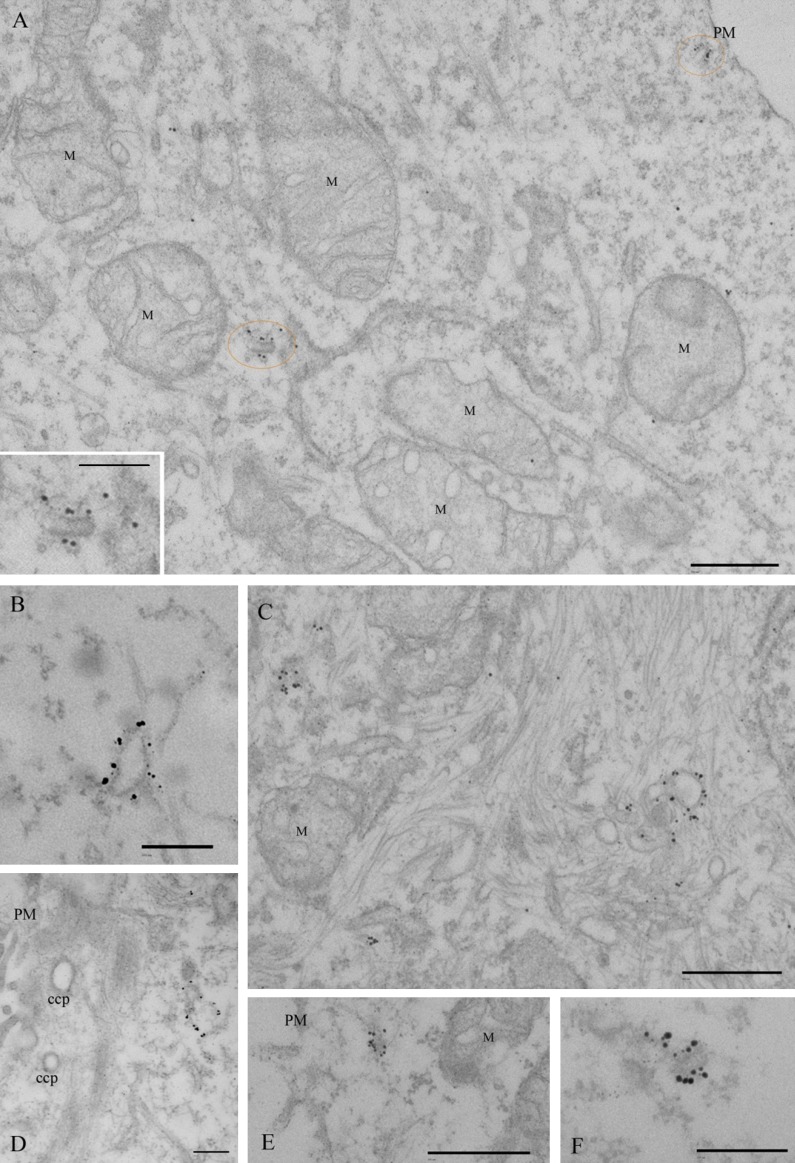
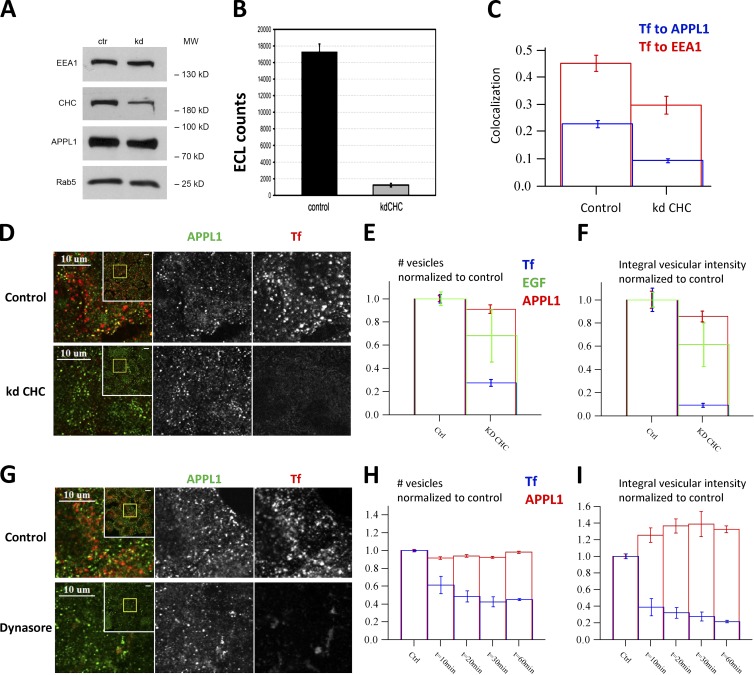
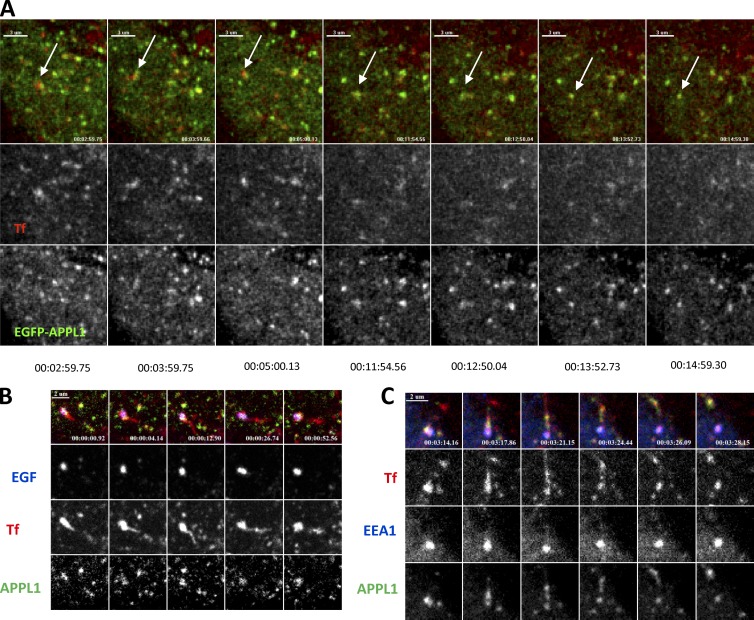
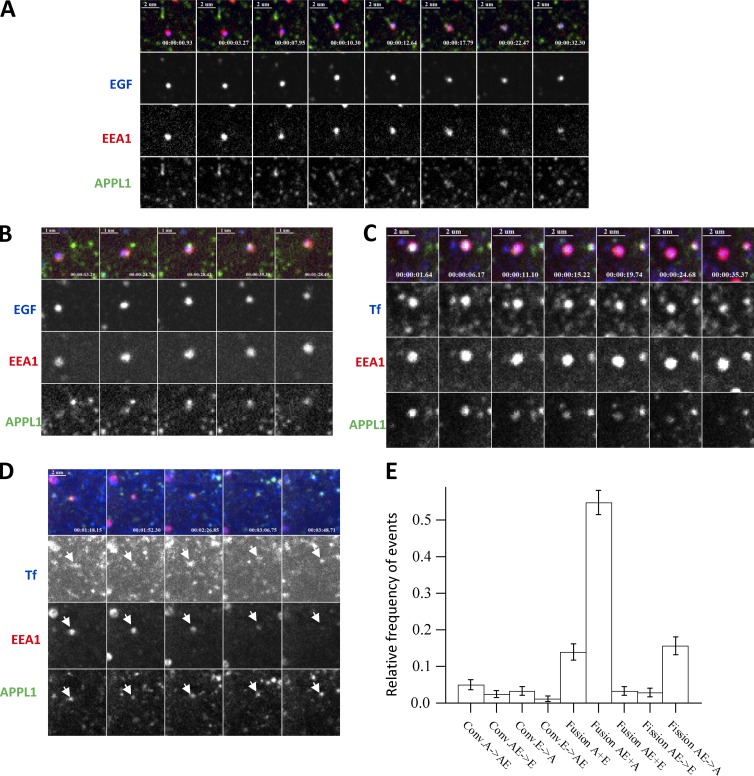
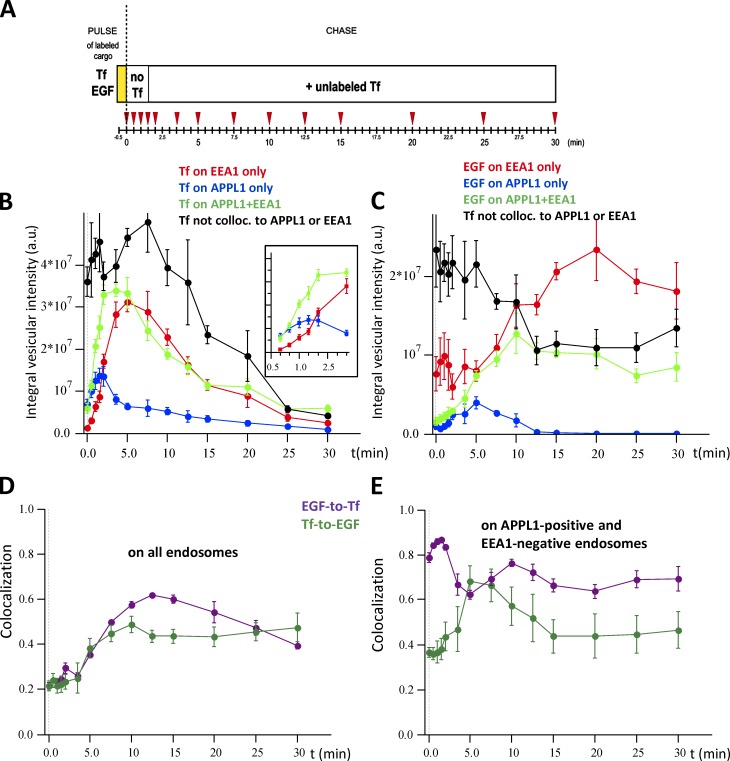
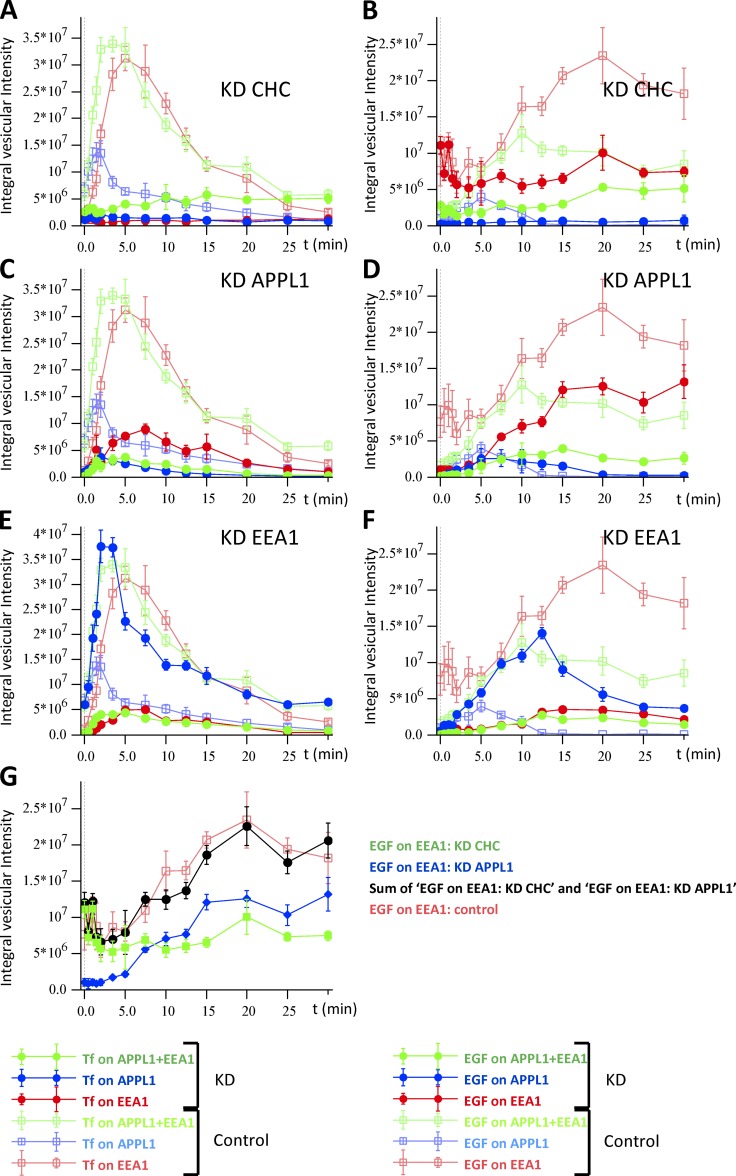
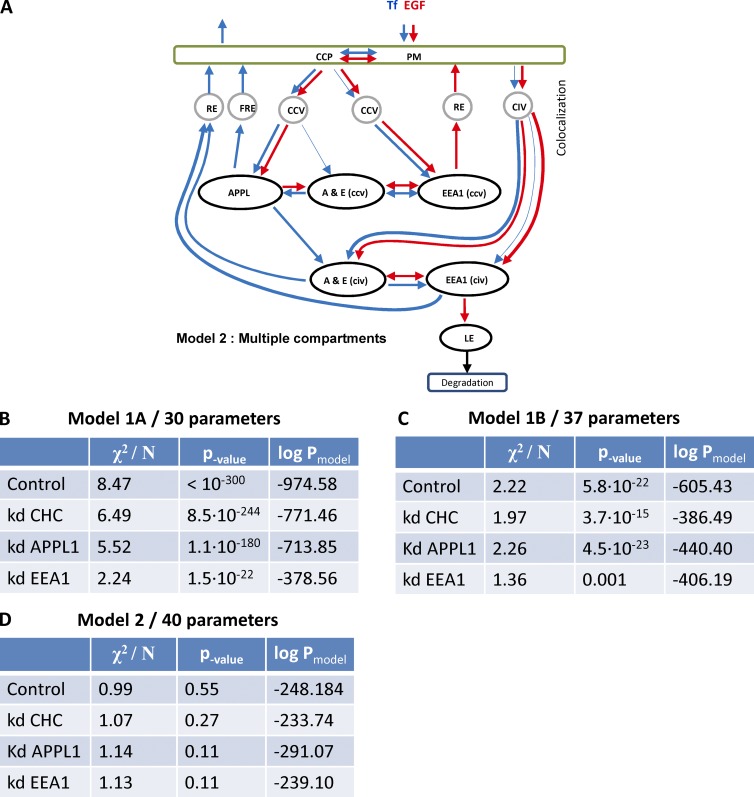
Endocytosis allows cargo to enter a series of specialized endosomal compartments, beginning with early endosomes harboring Rab5 and its effector EEA1. There are, however, additional structures labeled by the Rab5 effector APPL1 whose role in endocytic transport remains unclear. It has been proposed that APPL1 vesicles are transport intermediates that convert into EEA1 endosomes. Here, we tested this model by analyzing the ultrastructural morphology, kinetics of cargo transport, and stability of the APPL1 compartment over time. We found that APPL1 resides on a tubulo-vesicular compartment that is capable of sorting cargo for recycling or degradation and that displays long lifetimes, all features typical of early endosomes. Fitting mathematical models to experimental data rules out maturation of APPL1 vesicles into EEA1 endosomes as a primary mechanism for cargo transport. Our data suggest instead that APPL1 endosomes represent a distinct population of Rab5-positive sorting endosomes, thus providing important insights into the compartmental organization of the early endocytic pathway.


Figures

Figure 1.
Figure 1.
Models of cargo trafficking through APPL and EEA1 compartments. (A) In model 1, the APPL compartment serves as an intermediate en route to EEA1-positive endosomes. Cargo first binds to receptors on the PM and is internalized via CDE or CIE. The CDE includes formation of CCPs and internalization CCVs. Some CCVs acquire APPL1 or fuse with APPL1 membranes. Other CCVs and CIV directly fuse with EEA1 endosomes. APPL1 vesicles directly (10% through an APPL1+EEA1 double-positive endocytic intermediate [A & E]) or indirectly (47%+43%) convert into EEA1 endosomes. Cargo can be recycled to the surface via recycling endosomes (RE) or transported to late endosomes (LE) and lysosomes for degradation. Blue and red arrows demark transport of Tf and EGF, respectively. Black arrows, steps that must be common for both cargos. (B) In model 2, APPL1 endosomes that were not accounted in the literature (43%) constitute a stable endocytic compartment. These endosomes sort cargo for recycling and bi-directionally exchange of cargo with EEA1 endosomes through APPL1+EEA1 double-positive endosomes. Transition to late endocytic compartment occurs through EEA1 by conversion mechanism.
Figure 2.
Figure 2.
Immunoelectron microscopic localization of APPL1. HeLa cells were labeled with antibodies to APPL1, followed by a Nanogold-labeled conjugate. Gold particles were visualized by silver enhancement. (A) A low-magnification view with two APPL-positive structures circled in orange, one of which is shown at higher magnification in the inset. (B–F) A gallery of representative structures. Dense labeling is associated with small tubular profiles close to the PM or deeper inside the cell as well as with larger heterogeneous structures. Note that labeling of the PM or CCPs is very low. M, mitochondria. Bars: (A, C, and E) 500 nm; (A [inset], B, D, and F) 200 nm.
Figure 3.
Figure 3.
Cargo internalization into APPL endosomes is clathrin dependent but their biogenesis is not. (A) Silencing of CHC by RNAi in HeLa cells assessed by Western blot in comparison to EEA1, APPL1, and Rab5 as controls. (B) Internalization of biotinylated Tf (b-Tf) (after 30 min of continuous uptake) is inhibited upon CHC knockdown. The amounts of b-Tf in cell lysates were quantified by electrochemiluminescence. (C) Knockdown of CHC decreased colocalization of Tf to EEA1 (red) and APPL1 (blue). Colocalization was quantified after 3.5-min chase after 0.5-min internalization pulse of Tf. (D–F) Knockdown of clathrin inhibits Tf uptake but does not affect the number of APPL1-positive vesicles. Example images of endogenous APPL1 and fluorescent Tf at 3.5-min chase after the 30-s internalization pulse in control and clathrin-depleted cells (D). Inset presents full image, yellow rectangle depicts zoomed part. The numbers of vesicles marked by APPL1 (red), Tf (blue) or EGF (green) (E) and their integral intensities (F) are plotted (quantifications based on 80 images and ∼320,000 APPL1 endosomes). (G–I) Dynasore treatment (from 10 to 60 min) does not affect the number of APPL1-positive vesicles but progressively suppresses Tf uptake (10 min of Tf internalization). (G) Example images of HeLa cells treated with Dynasore (80 µM) for 60 min. The numbers of vesicles marked by APPL1 (red) and Tf (blue) (H) and their integral intensities (I) in cells pretreated with Dynasore for the indicated times are plotted (quantifications based on 10 images, ∼110 cells, and ∼45,000 APPL1 endosomes). Bars: (D and G, inset) 10 µm.
Figure 4.
Figure 4.
APPL endosomes are stable structures. (A) Gallery of images showing a long-lived APPL endosome (arrow) containing internalized Tf, tracked for 12 min in HeLa cells expressing EGFP-APPL1 (see Video 1). (B) APPL1 (green) endosome with EGF (blue) and Tf (red) sorts Tf from EGF. Tf-positive tubule growing over time and pinched-off from APPL1 endosome (see Video 3). (C) Double EEA1 (blue) + APPL1 (green) endosome produces Tf- (red) and APPL1-positive, EEA1-negative tubule (see Video 4). Later this tubule was separated from the main endosome body.
Figure 5.
Figure 5.
APPL endosomes exhibit features of cargo sorting by live cell imaging. (A) Sequential images showing an EEA1-positive APPL1-negative vesicle carrying EGF, which fuses with multiple preexisting APPL1 endosomes (see Video 5). (B) Sequential images depicting fusion of a double APPL1+EEA1–positive endosome with an APPL1-positive endosome (see Video 6). (C) Double APPL1+EEA1 endosome gradually loses APPL1 and converts to EEA1 endosome (see Video 7). (D) Double APPL1+EEA1–positive endosome gradually loses EEA1 and converts to APPL1 endosome (see Video 8). (E) Relative frequencies of individual events of interaction between APPL1- (A), EEA1- (E), and double APPL1+EEA1 (AE)–positive endosomes (error bars represent SEMs). Data were collected from 34 movies.Total number of events equals 234.
Figure 6.
Figure 6.
Time course of cargo distribution in EEA1- and APPL1-positive structures. Fluorescently labeled Tf and EGF were internalized for 30 s and chased for the indicated periods of time (A). All experimental data are the mean of four independent experiments. The intensity of Tf and EGF colocalized to EEA1 and APPL1 was corrected for apparent (random) colocalization (Kalaidzidis et al., 2015). (B and C) Kinetics of fluorescence intensity of Tf (B) or EGF (C) colocalized with EEA1-positive and APPL1-negative endosomes (red), APPL1-positive and EEA1-negative endosomes (blue), with double EEA1+APPL1–positive endosomes (green) and colocalized with none of them (black). The inset shows the part of the curve corresponding to the initial 3 min of the time course. (D) Time course of colocalization of EGF-with-Tf (magenta) and Tf-with-EGF (green) on all endosomes. (E) Time course of colocalization of EGF-with-Tf (magenta) and Tf-with-EGF (green) on APPL1-positive and EEA1-negative endosomes. This colocalization is defined as the ratio of the amount of EGF colocalized with Tf on APPL1 endosomes to the total amount of EGF on APPL endosomes. The same applies to Tf-with-EGF colocalization on APPL endosomes. Error bars represent SEMs.
Figure 7.
Figure 7.
Time course of Tf (A, C, and E) and EGF (B, D, and F) distribution in EEA1- and APPL1-positive structures under down-regulation of CHC, APPL1, and EEA1. Cells were transfected by siRNA for CHC (A and B), APPL1 (C and D) and EEA1 (E and F) for 48 h (see Materials and methods). Then fluorescently labeled Tf and EGF were internalized and chased as described in Fig. 6. Solid circles present the integral intensity of cargo colocalized with EEA1- (red), APPL1- (blue), and double APPL1+EEA1–positive endosomes (green). The control curves are presented by empty squares. Down-regulation of CHC, APPL1, and EEA1 was 95%, 70%, and 90%, respectively. Traffic of cargo in the control condition is repeatedly presented on panels A–F by empty squares. (G) Integral intensity of EGF colocalized with EEA1 under CHC knockdown (green) and APPL1 knockdown (blue). Sum of blue and green curves (sum of integral intensities of EGF colocalized with EEA1 upon APPL1 or CHC knockdown) is plotted by solid black circles. The time course of integral intensities of EGF colocalized with EEA1 for control is plotted by red squares.
Figure 8.
Figure 8.
Proposed models of cargo trafficking through APPL and EEA1 compartments. (A) In model 2, cargo on PM follows either the clathrin pathway through CCPs to CCVs or the clathrin-independent route by CIVs. About 94% of Tf (blue) and 25% of EGF (red) follow CDE. Almost 75% of EGF and only 6% of Tf are internalized by CIVs. In line with model 1, A and B, we considered two pools of CCV that deliver cargo to APPL1-positive (36% EGF and 99.5%Tf) and EEA1-positive (64% EGF, 0.5%Tf) endosomes. The flux of Tf through CCV to EEA1 increased up to 22% by down-regulation of APPL1. The fit of model suggests that CIVs deliver cargo to APPL1+EEA1 and EEA1 endosomes. The dynamic of cargo traffic through EEA1-positive demonstrated complex behavior that cannot be explained in case of kinetically homogeneous compartments. The down-regulation of APPL1 and CHC revealed that cargo traffic consists of two components that can be separately inhibited. Therefore, we introduced in the model 2 two kinetically distinct EEA1 compartments, which we denote EEA1(ccv) and EEA1(civ) according to the main mode of cargo delivery. The corresponding double APPL1+EEA1 compartments were denoted A&E(ccv) and A&E(civ) accordingly. The sorting of cargo toward the recycling route occurs in the all three endocytic compartments APPL1, APPL1+EEA1, and EEA1. However, the delivery of EGF to the late endosomes (LE) and following degradation (∼70% of EGF degrade in 30 min) occurs only through EEA1 compartment. We denote the recycling endosomes en route to PM and perinuclear recycling endosome in accordance to the kinetic rates of either fast recycling endosomes (FRE) or recycling endosomes RE. The thin arrows denote the routes that transport less than 10% of cargo from compartment, however the removal of them makes the fit to the experimental data unsatisfactory (P < 0.01). (B–D) Tables present results of the best fit of model 1A (B), model 1B (C), and model 2 (D) to the experimental data in control and perturbed cell. X2/N denotes normalized χ2: χ2/N=1Ni=1N+1(fidi)2σi2, where fi and di are model prediction and experimental data, σi is SEM of experimental data, N = 167. The p-values were calculated by χ2 distribution. (B) The probability of null hypothesis that the deviation of the model prediction from the experiment is the result of random noise (p-value) is extremely low for all four conditions. Therefore, model 1A has to be rejected. (C) The probability of null hypothesis is very low for all conditions, although the logarithm of probability of model 1B (see Materials and methods) is much higher than those of 1A. Nevertheless, model 1B has to be rejected as well. (D) The probability of null hypothesis is high. Therefore, most probably the deviation of model 2 from the experiment is the result of experimental uncertainty. The model 2 is much more probable ln(P) > 100 than model 1B for all conditions. Therefore, the improvement of the quality of fit is statistically significant to justify three additional parameters.

References

    1. Bökel C., Schwabedissen A., Entchev E., Renaud O., and González-Gaitán M.. 2006. Sara endosomes and the maintenance of Dpp signaling levels across mitosis. Science. 314:1135–1139. 10.1126/science.1132524 - DOI - PubMed
    1. Chavrier P., Parton R.G., Hauri H.P., Simons K., and Zerial M.. 1990. Localization of low molecular weight GTP binding proteins to exocytic and endocytic compartments. Cell. 62:317–329. 10.1016/0092-8674(90)90369-P - DOI - PubMed
    1. Chen H., and De Camilli P.. 2005. The association of epsin with ubiquitinated cargo along the endocytic pathway is negatively regulated by its interaction with clathrin. Proc. Natl. Acad. Sci. USA. 102:2766–2771. 10.1073/pnas.0409719102 - DOI - PMC - PubMed
    1. Cheng K.K., Lam K.S., Wu D., Wang Y., Sweeney G., Hoo R.L., Zhang J., and Xu A.. 2012. APPL1 potentiates insulin secretion in pancreatic β cells by enhancing protein kinase Akt-dependent expression of SNARE proteins in mice. Proc. Natl. Acad. Sci. USA. 109:8919–8924. 10.1073/pnas.1202435109 - DOI - PMC - PubMed
    1. Cheng Y., Boll W., Kirchhausen T., Harrison S.C., and Walz T.. 2007. Cryo-electron tomography of clathrin-coated vesicles: structural implications for coat assembly. J. Mol. Biol. 365:892–899. 10.1016/j.jmb.2006.10.036 - DOI - PMC - PubMed

Publication types

Substances